
Chapter 10. Managing and monitoring the ESB
In this chapter:
- Implementing the Wire Tap, Message Store, and Detour patterns in Mule and ServiceMix
- Using JConsole and JMX to manage the Mule and ServiceMix environments
- Introducing Mule Galaxy and MuleHQ
- Using MC4J to monitor the Mule and ServiceMix environments
In the chapters so far, we’ve focused on ESB functionality such as routing, connectivity, support for Enterprise Integration patterns, and more. You’ve seen how easy it is to solve complex integration problems using the default building blocks these ESBs provide. We’ve mainly focused on the development part of integration; we haven’t paid much attention to how you manage and monitor ESBs once your integration scenario is running.
Managing and monitoring integration products and running flows on them is a complex task. You have to work with a running system where messages are being sent between components and services and where it’s difficult to debug and replay certain scenarios. This is especially difficult on a production system. In this chapter, we look at the options Mule and ServiceMix provide for managing and monitoring the ESB and how they let you monitor and control specific flows. We examine the following management and monitoring subjects:
- System management Enterprise Integration patterns— Before we dive into the management and monitoring features supplied by Mule and ServiceMix, we examine a couple of Enterprise Integration patterns that can help you monitor integration flows. We discuss the Wire Tap pattern, the Message Store pattern, and the Detour pattern.
- Monitoring using JMX— Java Management eXtensions (JMX) is a standard Java means of managing and monitoring applications. With JMX, you can track certain attributes of an application at runtime and invoke operations on exposed objects. Both Mule and ServiceMix provide a management API through JMX, which you’ll use in this chapter.
In chapter 9, we showed how to implement an imaginary restaurant reservation service with Mule and with ServiceMix. We focused on how to create a design based on Enterprise Integration patterns and how to translate that design into an implementation using Mule and ServiceMix.
In this chapter, you’ll take that example and add system-management and -monitoring functionality to it. You’ll start by applying the Wire Tap, Message Store, and Detour patterns. Using these patterns, you can easily debug and monitor messages transmitted between the various components. We also discuss how you can manage ESBs using standard JMX-based tooling.
10.1. System-management Enterprise Integration patterns
The book Enterprise Integration Patterns describes many different system-management patterns. In this section, we examine three of them that can be useful when you’re working with an ESB. You’ll start by adding a wire tap to a specific channel of the message flow from chapter 9, which will let you see the content of the message that is sent over that channel.
10.1.1. The Wire Tap pattern
You place a wire tap on certain endpoints to let you see the messages received by those endpoints. A copy of each message is made and sent to a different endpoint so you can look at the message’s content without having to pause the processing of the original message or do anything else that might disrupt the running system. When you add a wire tap to a production system, it lets you check the messages that are being sent and that might cause problems, without interfering with the messages’ normal flow. Before we discuss the details of the wire-tap implementation, let’s examine the restaurant example from chapter 9 and add a wire tap to it, as shown in figure 10.1.
Figure 10.1. A design diagram showing the Wire Tap pattern being applied to the reservation example from chapter 9. All messages to the Lakeview restaurant service are also sent to the channel specified by the wire tap.
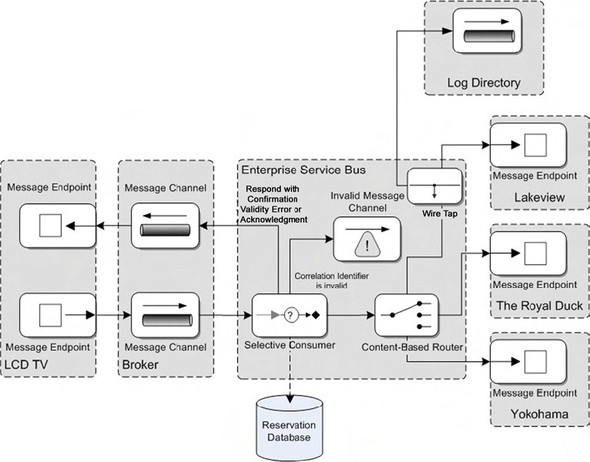
We added a single wire tap that picks up all messages sent to the Lakeview endpoint, makes a copy, and sends it to the configured endpoint. The rest of the scenario stays exactly the same and the involved parties won’t notice this change. Now, let’s get started with the Mule implementation of this scenario. After that, you do the same for ServiceMix.
Mule wire-tap implementation
Using the Wire Tap pattern in Mule is simple, because Mule provides a list of standard routers out of the box and one of them is a wire-tap router. All you have to do is add a configuration such as the one shown in listing 10.1 to the inbound section of a Mule service; a copy of all incoming messages will be made and routed to the specified endpoint.
Listing 10.1. Sample wire-tap configuration in Mule
<inbound>
  <inbound-endpoint address="vm://FromUser"/>
  <wire-tap-router>
    <file:outbound-endpoint path="log-directory">
  </wire-tap-router>
</inbound >
Let’s add this configuration to one of the services you saw in chapter 9. We don’t show the complete configuration; we focus on how to apply this pattern to one of the services defined in the reservation example.
In chapter 9, you implemented an example that sent messages to different restaurants and waited for a reply. If a reply took too much time, a notification was sent to the client and the message could be ignored. Now, imagine that you want to monitor the incoming requests to one of those restaurants, because this restaurant claims it’s not receiving any requests. Listing 10.2 shows how to apply the Wire Tap pattern to one of those services.
Listing 10.2. Mule restaurant service extended with the Wire Tap pattern
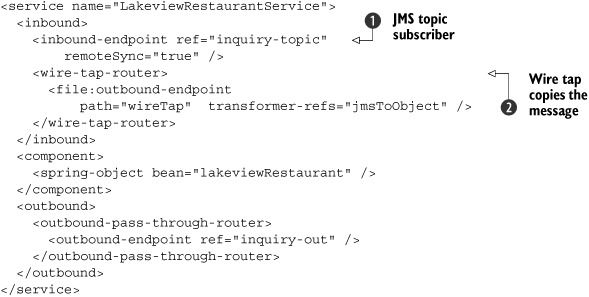
You alter the inbound part of the LakeviewRestaurantService and add a wire-tap-router to it
![]() . This router sends a copy of each incoming message from the topic subscriber
. This router sends a copy of each incoming message from the topic subscriber
![]() to the specified endpoint, which in this case is a directory on the file system. You also add a transformer to this endpoint,
because the message you get here is still a JMSObject. We mentioned earlier that Mule doesn’t use a specific normalized message format. You see this when you use this pattern.
If a Java object is sent to the endpoint specified by the wire-tap-router, it’s sent to the configured endpoint. If no transformers are specified on this endpoint, the Java object is serialized to
the file system. If you want to view this data later, you have to deserialize this object before you can access its content.
If you want to quickly test this, you can use the JavaToX-StreamTransformer, which is included in the sources. With this transformer, you can quickly serialize a Java object to an XML string without
having to configure anything or create a mapping, as you would with JiBX.
to the specified endpoint, which in this case is a directory on the file system. You also add a transformer to this endpoint,
because the message you get here is still a JMSObject. We mentioned earlier that Mule doesn’t use a specific normalized message format. You see this when you use this pattern.
If a Java object is sent to the endpoint specified by the wire-tap-router, it’s sent to the configured endpoint. If no transformers are specified on this endpoint, the Java object is serialized to
the file system. If you want to view this data later, you have to deserialize this object before you can access its content.
If you want to quickly test this, you can use the JavaToX-StreamTransformer, which is included in the sources. With this transformer, you can quickly serialize a Java object to an XML string without
having to configure anything or create a mapping, as you would with JiBX.
If you run the example with the ch10-build.xml Ant build file and test the example with the Swing test client, you see that when a message is sent to LakeviewRestaurantService, a copy of the message is also be sent to the endpoint-configured wire-tap router. Let’s now discuss how you can implement the Wire Tap pattern in ServiceMix.
ServiceMix Wire Tap implementation
For ServiceMix, you also have an out-of-the-box component that implements the Wire Tap pattern. This is provided by the servicemix-eip Service Engine. Listing 10.3 shows an example configuration of the Wire Tap pattern from the EIP service engine.
Listing 10.3. ServiceMix configuration for the Wire Tap pattern
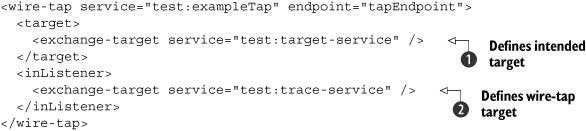
The wire-tap component makes a copy of every incoming message and forwards the copy to a different Java Business Integration
(JBI) service endpoint
![]() , where you can, for instance, store it in the file system. The original message is sent to the intended target JBI service
, where you can, for instance, store it in the file system. The original message is sent to the intended target JBI service
![]() , where it’s processed as if nothing happened in the message-flow execution.
, where it’s processed as if nothing happened in the message-flow execution.
Now that you’ve seen how you can configure a wire tap, let’s examine how to configure a wire tap for the reservation example from chapter 9. You first need to create a new service unit that implements the Wire Tap pattern configuration, as shown in listing 10.4.
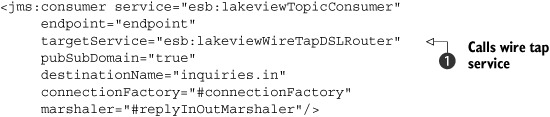
Listing 10.4. ServiceMix wire-tap implementation in the EIP service unit
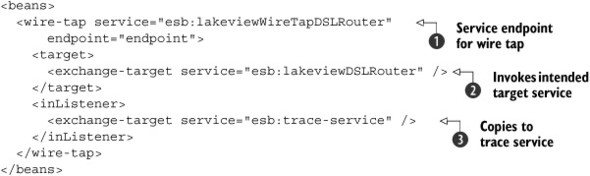
When this wire-tap service is called on its service endpoint
![]() , it routes the message to the intended target lakeviewDSLRouter
, it routes the message to the intended target lakeviewDSLRouter
![]() and sends a copy to the service specified in the exchange-target element
and sends a copy to the service specified in the exchange-target element
![]() . We don’t show the details of the esb:trace-service because it’s a simple file sender that you’ve implemented a number of times before.
. We don’t show the details of the esb:trace-service because it’s a simple file sender that you’ve implemented a number of times before.
But you’re not there yet. The wire tap you’ve created has a specific service endpoint
![]() . You must make sure the service that called the esb:lakeviewDSLRouter service now calls the service with the wire tap you just created. The new JMS service configuration that calls the esb:lakeviewDSLRouter service is shown in listing 10.5.
. You must make sure the service that called the esb:lakeviewDSLRouter service now calls the service with the wire tap you just created. The new JMS service configuration that calls the esb:lakeviewDSLRouter service is shown in listing 10.5.
Listing 10.5. Modified JMS consumer that calls the wire-tap service
When you run this example, the flow runs as if nothing has changed. The only difference is that now you get a copy of every message that passes through your wire tap, which you can use for debugging purposes. The advantage here is that the message is already in XML format so you don’t have to apply an additional transformation to make it readable as we had to do with Mule.
The Message Store pattern does something similar to the Wire Tap pattern.
10.1.2. The Message Store pattern
The primary advantage of message stores is that you can store messages over a long period of time without interfering with their normal flow. Each message, or a selection of its properties, is copied to the message store, which can be analyzed at a more convenient time. The biggest difference between a message store and a wire tap is that with a message store, you can make sure the data stored is easily accessible. This can, for instance, be used to determine which messages cause performance issues, or which types of messages are sent the most often and are a target for optimization.
With a message store, you don’t necessarily have to store the complete message; usually you store the message’s most important properties—the properties for which you want to generate reports, or which are required for analysis.
For this pattern, we show you two implementations. The implementation with Mule will store the message’s generated ID and timestamp properties in a JDBC database. You also store the reservation time and number of persons fields from the message. For the ServiceMix example, you use the normalized message (which is XML) and store the message’s complete data in an XML database. Let’s begin by looking at how you can configure the Mule scenario to store each message in a database.
Mule message-store implementation
For the Mule message-store implementation, you once again use the wire-tap concept to make a copy of the message and log that message. Instead of sending the copied message to a file endpoint, you send it to a JDBC endpoint, which will store the message in a database for later analysis. This Mule configuration is shown in listing 10.6.
Listing 10.6. Mule configuration, implementing the Message Store pattern
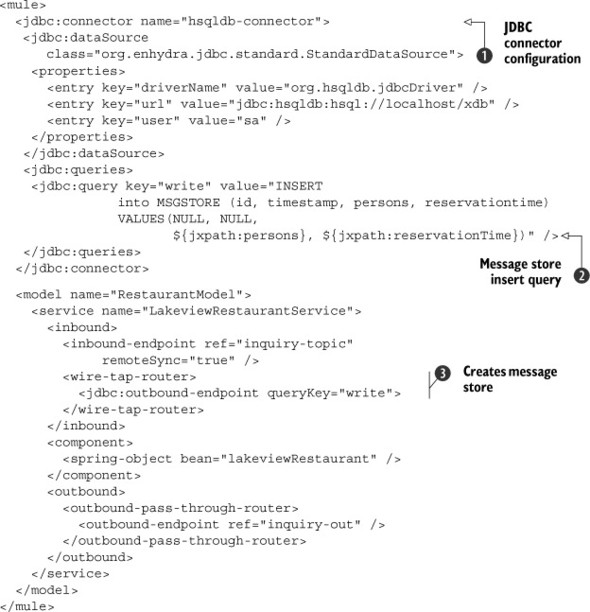
In this code, you configure a simple message-store implementation. You add a wire tap to the inbound configuration of a Mule
service
![]() and configure this wire tap to store information from the message in the HSQL database
and configure this wire tap to store information from the message in the HSQL database
![]() .
.
With the JDBC connector definition, you can connect to an HSQL database
![]() and use the insert query named write. The SQL for this query
and use the insert query named write. The SQL for this query
![]() is an insert into the MSGSTORE table. In the query, you also add a number of properties. Mule will replace these with properties from the received message
using JXPath.
is an insert into the MSGSTORE table. In the query, you also add a number of properties. Mule will replace these with properties from the received message
using JXPath.
For this example, as in all the other examples in this chapter, an Ant build file is provided in the resources/chapter10 directory of the Mule workspace. You’ll find targets in that build file to create the database and run the examples.
If you run the scenario a couple of times with various messages, you see the database being filled. Other applications can use the database to analyze the messages without interfering with the message flow.
Now that we’ve shown you how to create a message store in Mule using a relational database, let’s implement the same pattern in ServiceMix.
ServiceMix message-store implementation
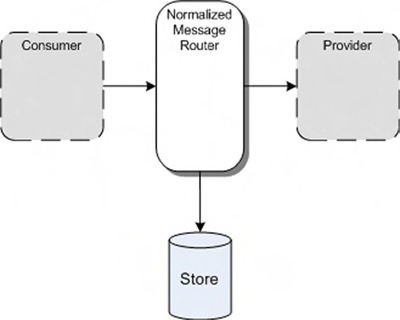
You could use the same setup you used for the wire-tap example to create a message store for ServiceMix. But for this example, you use a feature ServiceMix provides to add auditing functionality to the complete ServiceMix environment. You do this by adding a message listener to the Normalized Message Router (NMR). In chapter 2, we explained that internal message routing in ServiceMix is done via the NMR. If you send a message from a service consumer to a service provider, this message is first sent to the NMR, which passes it on to the service provider. Because all the messages are routed by the NMR, the NMR is a good place to add a message store without having to alter any of the service Units.
You use an open source eXist XML database to store the messages. Just as for all the other servers used in this book, you can start this database from the Ant build file for this chapter, which is in the resources/chapter10 directory of the ServiceMix workspace. The message store example you implement in this section is shown in figure 10.2.
Figure 10.2. How the Message Store pattern is implemented using a custom auditor in ServiceMix
To add a listener to the NMR, you must configure ServiceMix with an auditor. ServiceMix provides two auditors out of the box, which you could use for your message store: JDBCAuditor writes messages to a JDBC database, and FileAuditor stores messages in the file system. If you look back at the wire-tap example, you could also have used FileAuditor to implement the Wire Tap pattern. In this example, you won’t use these auditors; instead, you provide a custom auditor to persist data to an XML database. This approach shows you how easy it is to create custom auditors and integrate various technologies.
To implement a custom auditor, you can extend from the AbstractAuditor, which is a base class that ServiceMix provides. Listing 10.7 shows how to create an auditor that can write to an eXist database.
Listing 10.7. Auditor implementation that stores messages in a database
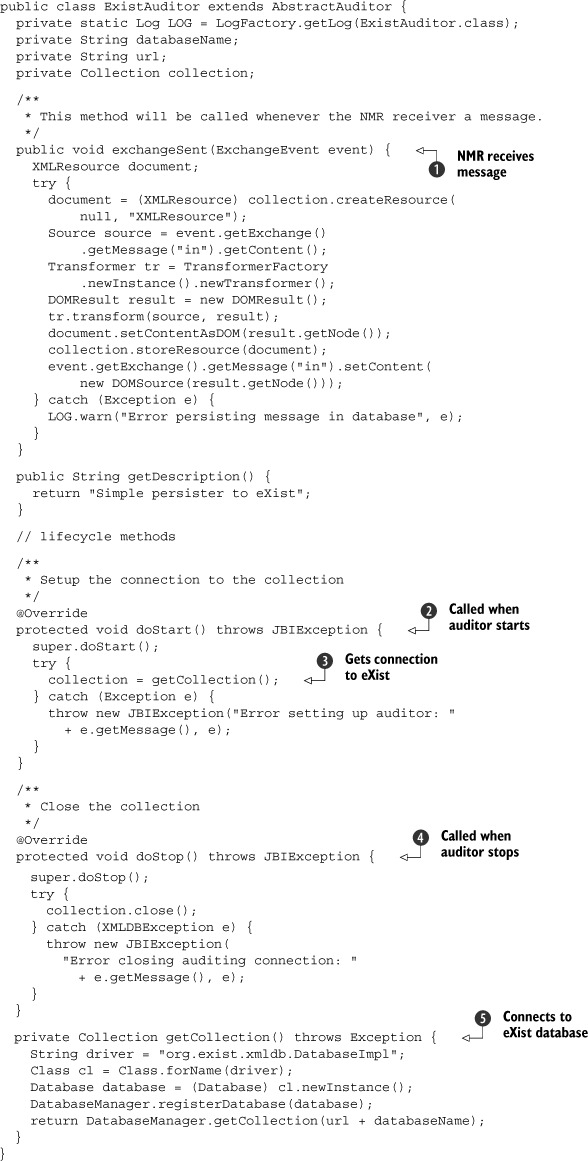
You extend from the abstract class AbstractAuditor, provided by ServiceMix. To create a custom auditor, you have to implement a number of methods. This example only shows the
implementation of the exchangeSent method
![]() . This method is called whenever a message is received by the NMR.
. This method is called whenever a message is received by the NMR.
Before we look at how the message is stored, let’s first examine the lifecycle methods doStart
![]() and doStop
and doStop
![]() . The doStart method is called when the component is loaded, and doStop is called when ServiceMix shuts down. In these methods, you set up a connection to the XML database
. The doStart method is called when the component is loaded, and doStop is called when ServiceMix shuts down. In these methods, you set up a connection to the XML database
![]()
![]() . Without going into too much detail, you get a connection to a specific collection. You can see a collection as a schema
within a relational database.
. Without going into too much detail, you get a connection to a specific collection. You can see a collection as a schema
within a relational database.
In the exchangeSent method
![]() , you receive an ExchangeEvent and transform it in a DOM object that you can easily store in the eXist database. To store an object in eXist, you must first create an XMLResource. You set the DOM object as the content of this XMLResource and use the collection, which you created in the doStartup method, to store this XMLResource in the database.
, you receive an ExchangeEvent and transform it in a DOM object that you can easily store in the eXist database. To store an object in eXist, you must first create an XMLResource. You set the DOM object as the content of this XMLResource and use the collection, which you created in the doStartup method, to store this XMLResource in the database.
The last thing you need to do to get ServiceMix to use your custom auditor is register it. You do this by editing the servicemix.xml file in the ServiceMix conf directory and adding the following Spring bean configuration:
<bean name="existAuditor" class="esb.chapter10.auditor.ExistAuditor"
    init-method="start"
    destroy-method="stop">
  <property name="container" ref="jbi"/>
  <property name="url"
      value="xmldb:exist://localhost:8080/exist/xmlrpc/"/>
  <property name="database" value="db"/>
</bean>
This configuration makes sure your auditor is started when ServiceMix starts and is stopped when ServiceMix shuts down. The configuration options for this auditor are the default settings that are used to connect to a running eXist database.
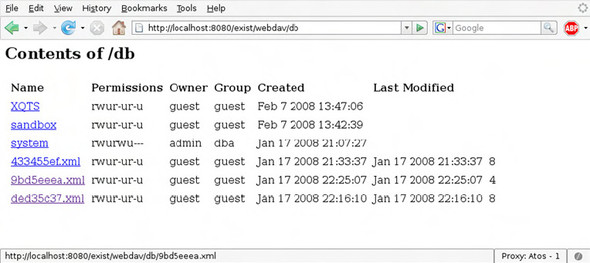
Start up the eXist database from the supplied Ant file and run the Wire Tap example a couple of times to get some messages stored in the database. You can use either the eXist XQuery tool or the webdav view to browse and query the messages. The easiest way to check whether the messages are stored is to open the webdav view, located at http://localhost:8080/exist/webdav/db.
To log in to this application, use admin/admin as the username and password. Figure 10.3 shows the browser view.
Figure 10.3. A screenshot of the webdav view of the eXist database where the messages are stored
You’ve now seen how to implement the Message Store pattern in Mule and in ServiceMix. For Mule, you extended the Wire Tap pattern to store important message properties into a database; with ServiceMix, you created an auditor that stored the content of each message in an XML database for later analysis. But there is a small difference between the two approaches: with Mule, each message is stored only once; and with ServiceMix, you store each message that is sent to the NMR. Depending on the scenario, with ServiceMix you may store some messages multiple times. If you don’t want this, you can easily change your auditor to keep a table of correlationIDs for each stored message. If a new message arrives, you can take the correlationID, check whether you already stored it once, and, if you did, not store it again.
The last pattern we look at is the Detour pattern. With the Detour pattern, you reroute the message to alter some properties or log information. After you’ve changed the message, you re-insert the message in the flow at the same place to continue processing.
10.1.3. The Detour pattern
Finding problems in integration flows is often difficult. Messages flow from one component to another, making the flow hard to debug. You can choose to start Mule and ServiceMix in debug mode and use a Java debugger to check the messages that are sent between components, but you usually can’t do this on production systems. With the Detour pattern, you reroute the message to a different endpoint, where you can examine and (optionally) alter the message. After you’ve made your changes, you put the message in a different channel, where it’s picked up again and processed normally.
You again implement this pattern in Mule and ServiceMix. The functionality you implement is shown in figure 10.4.
Figure 10.4. Detour pattern added to the restaurant reservation example
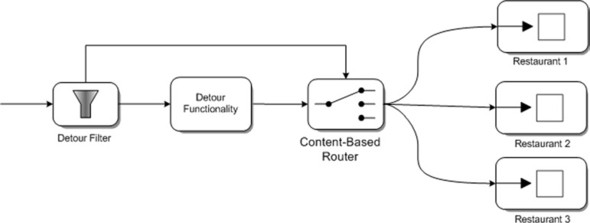
You add a Detour pattern which can be used to intercept all the confirmation messages. The Detour filter from figure 10.4 will determine when to send a message to the detour part of the message flow or send it directly to the Content-based router service. This may look a bit like the wire-tap example, but instead of making a copy of the original message, you intercept the complete processing of the message so you can alter the message before sending it further.
In this example, the intercepted message is sent to a Java bean where you can alter the message or let an administrator alter the message. This way, it will be easy to test different types of messages and determine how the system will react to specific content without having to change the configured components and services or change any of the message properties that are used for routing.
Detour pattern in Mule
To implement the Detour pattern in Mule, you create a content-based router that determines, based on a filter’s settings, whether to send a message to the detour flow or directly to the target component. You first add a new Mule service that will handle the detoured message. Listing 10.8 shows the Mule configuration of a basic detour service that allows you to process the detoured message in a Java class.
Listing 10.8. Mule configuration that implements the Detour pattern
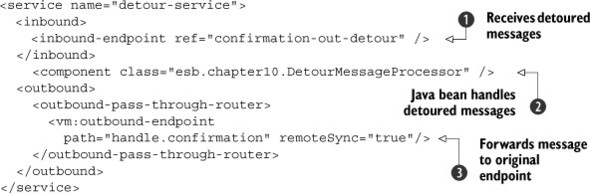
The service from listing 10.8 receives detoured messages on the configured endpoint
![]() and processes the messages in a simple java class
and processes the messages in a simple java class
![]() . This class has only a single method in which you can alter the message or its properties. In this example, you don’t do
anything with the message; you just write it to System out. After you’ve processed the message, it’s passed to the endpoint
defined in
. This class has only a single method in which you can alter the message or its properties. In this example, you don’t do
anything with the message; you just write it to System out. After you’ve processed the message, it’s passed to the endpoint
defined in
![]() , where it’s processed normally by the rest of the integration flow.
, where it’s processed normally by the rest of the integration flow.
Now that you’ve seen how the message is processed, let’s look at how you can determine whether to send the message either to the detour service or to the original service. This configuration is shown in listing 10.9.
Listing 10.9. Mule configuration for the Detour pattern
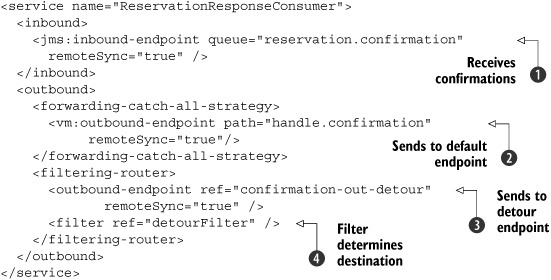
This Mule configuration is a modified version of the reservation example implementation. You only have to make a couple of
changes to add the Detour pattern. This services still receives all the confirmation messages
![]() from a JMS queue. The service then uses a filter
from a JMS queue. The service then uses a filter
![]() to determine where to send this confirmation message. If the filter is enabled, the confirmation message is sent to the detour
service from listing 10.8
to determine where to send this confirmation message. If the filter is enabled, the confirmation message is sent to the detour
service from listing 10.8
![]() ; if it’s disabled, the message is sent to its original destination
; if it’s disabled, the message is sent to its original destination
![]() . With this configuration you can, at runtime, turn on the filter and intercept and change any of the confirmation messages.
. With this configuration you can, at runtime, turn on the filter and intercept and change any of the confirmation messages.
The last question that remains is how to turn the filter on and off at runtime. Let’s start by looking at the detour filter implementation, shown in listing 10.10.
Listing 10.10. DetourFilter that can be enabled and disabled using JMX
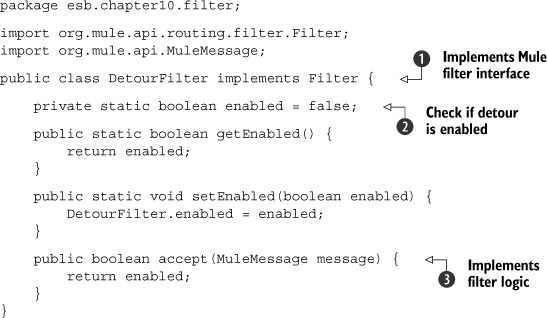
This filter, which implements
![]() the Filter interface from Mule, returns the enabled property
the Filter interface from Mule, returns the enabled property
![]() from the accept method
from the accept method
![]() . If this property is set to true, the confirmation messages are sent to the detour endpoint; if the property is false, these
messages are sent to their original destination. How can you set the property to the intended value, given that in its current
state, it will never detour the messages?
. If this property is set to true, the confirmation messages are sent to the detour endpoint; if the property is false, these
messages are sent to their original destination. How can you set the property to the intended value, given that in its current
state, it will never detour the messages?
You need a way to change the enabled property value. To do this, you use JMX. We mentioned that with JMX, you can manage applications if they expose this management information; you expose the filter settings to JMX. Spring makes this simple, as shown in listing 10.11.
Listing 10.11. Spring configuration exposing the detour filter to JMX
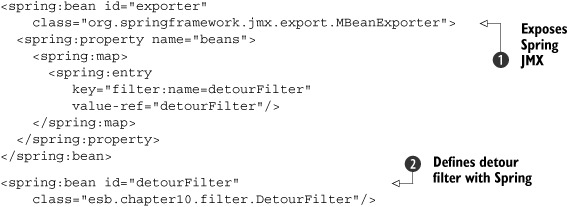
You use the Spring MBeanExporter
![]() to expose all the public methods from your DetourFilter bean
to expose all the public methods from your DetourFilter bean
![]() to JMX. You register the DetourFilter in the JMX registry as filter:name=detourFilter. If you start up a JMX console such as JConsole, which is available in the standard Java distribution, you can connect to
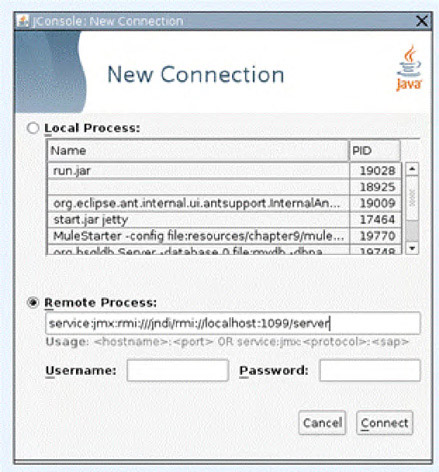
the running Mule instance. Figure 10.5 shows how to connect JConsole to Mule. For more information on how to use JMX with Mule, see section 10.2.
to JMX. You register the DetourFilter in the JMX registry as filter:name=detourFilter. If you start up a JMX console such as JConsole, which is available in the standard Java distribution, you can connect to
the running Mule instance. Figure 10.5 shows how to connect JConsole to Mule. For more information on how to use JMX with Mule, see section 10.2.
Figure 10.5. Connecting JConsole to Mule
After you’ve made a connection to Mule, look for the filter node. You see a screen similar to figure 10.6.
Figure 10.6. JConsole, showing the JMX property for the detour filter. With JConsole, you can enable and disable the detour filter.
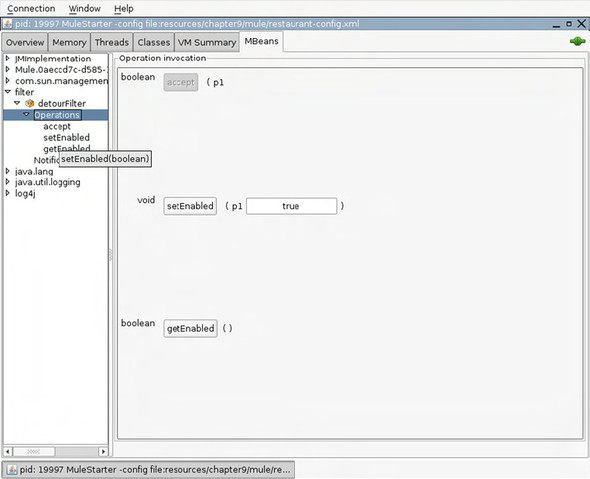
As you can see in figure 10.6, the DetourFilter is registered in the JMX registry. Using JConsole, you can easily change the setting of the enabled property to enable the detour filter and also stop it later.
In the last couple of sections we’ve shown you how to implement the Detour pattern in Mule. The Detour pattern is more difficult to implement than the Wire Tap or Message Store pattern, because you must intercept a message before it’s sent to a target service. With the routers available in Mule, and with the help of JMX, you can implement the Detour pattern in such a way that it’s flexible and can be turned on and off at runtime.
In the next section, we examine how you can use the EIP Service Engine to implement the Detour pattern in ServiceMix.
Detour pattern in ServiceMix
To implement a Detour pattern in ServiceMix, you can use the content-based router available in the servicemix-eip Service Engine. You configure this router to either send messages directly to the target configured service or send them to the service you’ve configured as the detour address. We start with configuring this router; first, you must create a new service Unit, as you had to do for the Wire Tap pattern. The EIP Service Engine configuration for the Detour pattern is shown in listing 10.12.
Listing 10.12. ServiceMix EIP SE configuration that implements the Detour pattern
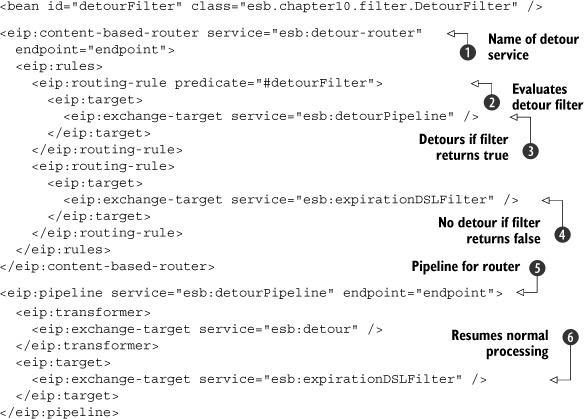
You configure a content-based router
![]() with a single routing rule. Each message received by this content-based router is checked against the specified predicate,
which in this case is the custom DetourFilter
with a single routing rule. Each message received by this content-based router is checked against the specified predicate,
which in this case is the custom DetourFilter
![]() . This detour filter is exposed in the same manner as you saw for the Mule detour filter using the Spring MBeanExporter (not shown in the listing). If the result from this filter is true, the message is forwarded to the specified exchange-target, which is the detour pipeline
. This detour filter is exposed in the same manner as you saw for the Mule detour filter using the Spring MBeanExporter (not shown in the listing). If the result from this filter is true, the message is forwarded to the specified exchange-target, which is the detour pipeline
![]() . If none of the predicates matches (in this example you have only one), the message is sent to the intended target specified
in the default routing rule
. If none of the predicates matches (in this example you have only one), the message is sent to the intended target specified
in the default routing rule
![]() . This listing also includes a pipeline
. This listing also includes a pipeline
![]() . This pipeline is called when the filter matches and calls a service where you can alter the message. We look at the configuration
of this target service in listing 10.15. After this custom service, the exchange-target
. This pipeline is called when the filter matches and calls a service where you can alter the message. We look at the configuration
of this target service in listing 10.15. After this custom service, the exchange-target
![]() is called once again, and normal processing resumes.
is called once again, and normal processing resumes.
Before we look at the changes you need to make to other service unit implementations from chapter 9, let’s quickly examine the detour filter implementation shown in listing 10.13.
Listing 10.13. ServiceMix detour filter implemented as a ServiceMix predicate
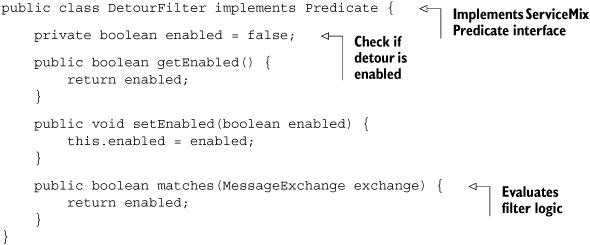
If you’ve read the section on Mule, you can see that this is much the same as the filter you implemented in the Mule detour example and is exposed to JMX in the same manner.
You also need to change the JMS Service Unit, esb:confirmationConsumer, because you want this service to call your detour-enabled service instead of directly calling the esb:expirationDSLFilter. Listing 10.14 shows the changed esb:confirmation-Consumer.
Listing 10.14. Modified JMS consumer that calls the wire-tap service
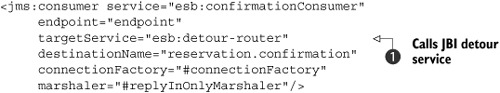
The only thing you change is the targetService attribute
![]() . Instead of directly sending the incoming message to esb:expirationDSLFilter, it’s now sent to esb:detour-router.
. Instead of directly sending the incoming message to esb:expirationDSLFilter, it’s now sent to esb:detour-router.
The last thing to do is create the service to which the detoured message is sent. The configuration of this service is shown in listing 10.15.
Listing 10.15. ServiceMix bean SU configuration to deal with the Detour pattern
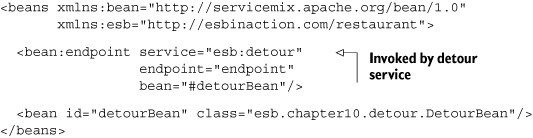
You have to make sure the name of the sender service is the same as you configured in listing 10.12. This service will receive an exchange and can easily change the message or ask an administrator for input.
If you run this example and send a message, depending on the configuration of the DetourFilter, the message is sent either to this detour service or directly to the original destination. Because you exposed the detour filter to JMX, you can once again use JConsole to enable and disable the filter. For more information on how to use JMX, see section 10.2.
So far, we’ve focused on how you can debug and analyze messages that are sent over the ESB, and how you can monitor specific integration scenarios. In the second part of this chapter, we look at how you can monitor the complete ESB. To do this, you use the JMX support provided by both ESBs.
10.2. Monitoring using JMX
JMX was introduced by Sun in 2002 and was added to the standard Java runtime when Java 5 was released. With JMX, you have a standard model you can use to expose your own beans to be managed by external applications, and a standard model that external monitoring applications can connect to and use to control your exposed beans. Figure 10.7 gives an overview of the components and layers used in JMX.
Figure 10.7. All the components and layers in JMX
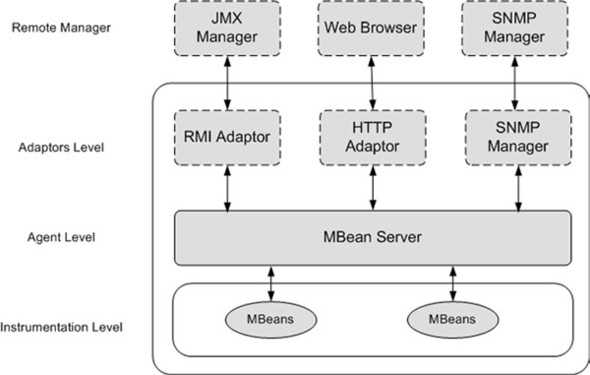
Let’s quickly examine each of the layers. The instrumentation level is where your applications reside. In your application, you define a number of MBeans, as you did with Spring in the previous section; these MBeans are registered in a registry called the MBean server. An MBean defines a number of operations and attributes from your beans that can be invoked by remote management applications.
You also need a way to access those MBeans. For this purpose, JMX uses an adaptor. An adaptor exposes the beans registered in the MBean server to external applications using a specific technology. For example, you can have an RMI adaptor that uses standard Java remoting to access the MBeans. Other adaptors expose MBeans using SOAP, plain HTTP, or the SNMP protocol.
Once the MBeans have been exposed using a specific technology, you can use a remote manager to access them using one of the registered adaptors. Many remote managers are available for this purpose. There are commercial managers, such as IBM Tivoli and HP OpenView, which can connect to JMX, and a number of open source tools are also available. The best known are Sun’s JConsole, MC4J, and MX4J. MX4J provides Java libraries you can use to connect from Java to a JMX MBean server, so we won’t look at that one here. In the following sections, we look more closely at how JConsole and MC4J can be used to monitor Mule and ServiceMix.
10.2.1. Using JMX to administer Mule
Before starting Mule, you need to tell it to expose its management functionality through JMX. To do this, add the following line to the Mule configuration:
<mgmt:jmx-default-config/>
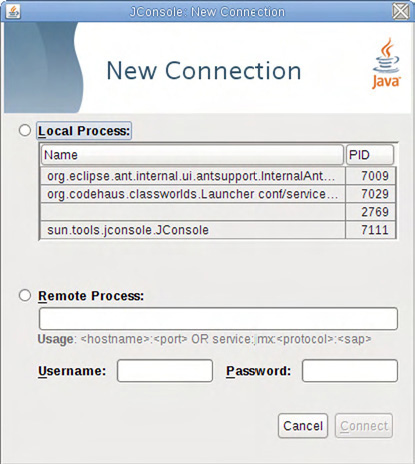
Mule creates its own MBean server, register-management, and statistics MBeans, and adds an RMI connector. Add the previous line to the example from chapter 9, and fire up the ESB. Then, run JConsole by typing jconsole from the command line; doing so starts JConsole and shows you the startup screen, as shown in figure 10.8.
Figure 10.8. JConsole startup screen
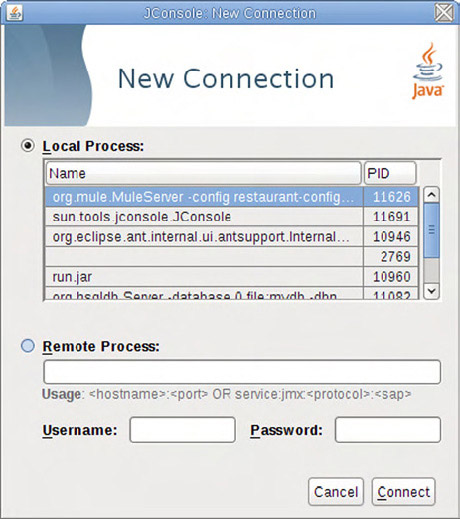
From here, you can use JConsole to connect directly to any of the Java processes running on your machine or to a remote process. When Mule starts with JMX enabled, it starts up its own MBean server instead of registering all the beans in the JVM MBean-Server; so, you need to connect to Mule as if it were a remote process. If you connect to the local process, you get only the basic JVM MBeans instead of the Mule MBeans.
If you examine Mule’s startup output, you see the address you need to use to connect. It looks something like this:
service:jmx:rmi:///jndi/rmi://localhost:1099/server
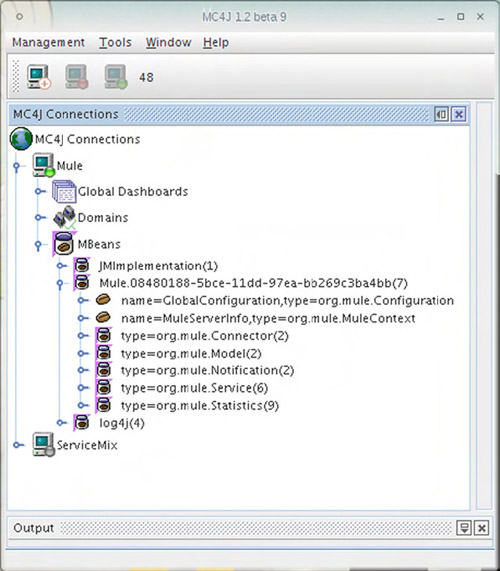
Copy this address into the remote process field, and click the Connect button. Doing so uses the RMI adaptor to connect JConsole to Mule’s MBean server. You now see an overview of all the MBeans available in the MBean server, grouped per type, as shown in Figure 10.9.
Figure 10.9. All the available MBeans for Mule
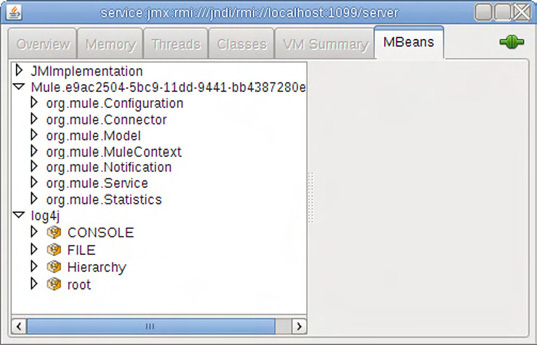
As you can see, Mule provides access to a number of different types of objects. Table 10.1 gives a short summary of what each MBean type means.
Table 10.1. JMX categories that Mule can manage
|
Type |
Description |
|---|---|
| org.mule.Service | Contains all the services you define in Mule. You can see statistics, stop and start services, and more. |
| org.mule.Configuration | Gives you insight into how Mule was started. For instance, shows which configuration file was used to start Mule. |
| org.mule.Connector | Contains information about the defined connectors. Allows you, for example, to stop and start the JMS connectors and JDBC connectors. |
| org.mule.MuleContext | Contains more information about the Mule server and lets you stop and start the server. Note that this won’t completely shut down the VM, but it stops everything. |
| org.mule.model | A collection of services. Lets you stop and start a complete model. |
| org.mule.Notification | Allows external JMX clients to listen to Mule-specific notifications. With JMX, it’s possible to subscribe to received notifications. |
| org.mule.Statistics | Provides insight into how many messages were received, how long it took, and so on. |
| Log4j | Lets you alter the log levels. Not Mule-specific, but comes in handy. |
We look more closely at the org.mule.Service MBean group and the org.mule.Connector group with JConsole, and you use MC4J to get some insight into the org.mule.Statistics group. Let’s start by examining the org.mule.Service group.
We show you the attributes and operations defined on the DuckRestaurantService from the restaurant example in chapter 9. First, figure 10.10 shows the attributes, which are mostly about statistics for the Mule service and the lifecycle status for this component.
Figure 10.10. JConsole showing all the attributes of the DuckRestaurantService Mule service
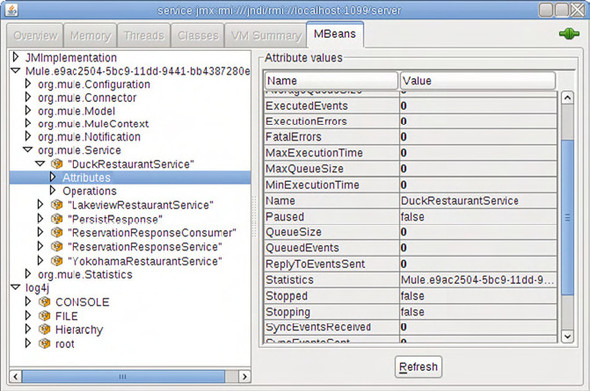
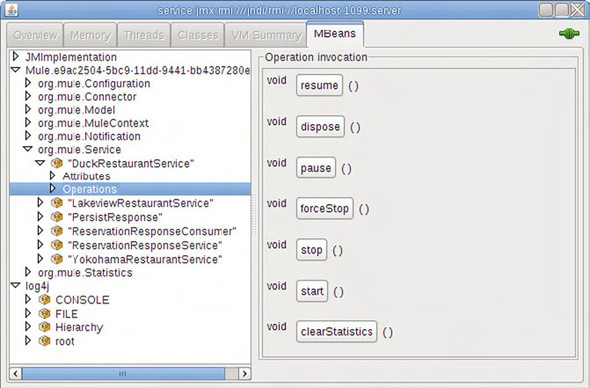
Figure 10.11 shows the operations that can be executed on Mule; they’re more interesting. You can use a number of methods to control this single Mule service. If you want to bring down a service, or temporarily pause it, you can easily do so using JConsole.
Figure 10.11. JConsole showing all the methods of the DuckRestaurantService
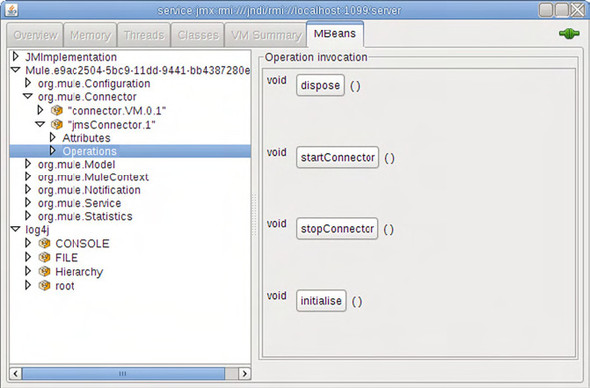
The same functionality is available for the org.mule.Connector group. Figure 10.12 shows its operations, which can stop and start specific technology connectors.
Figure 10.12. JConsole showing all the operations of the JMSConnector
As you’ve seen, you can manage the lifecycle of your services and connectors from a JMX client. In addition to this functionality, the JMX view also shows what is currently running; you can see all the services and all the connectors. Now, let’s look at how MC4J can monitor the Mule ESB using the org.mule.Statistics group.
10.2.2. Monitoring Mule using MC4J
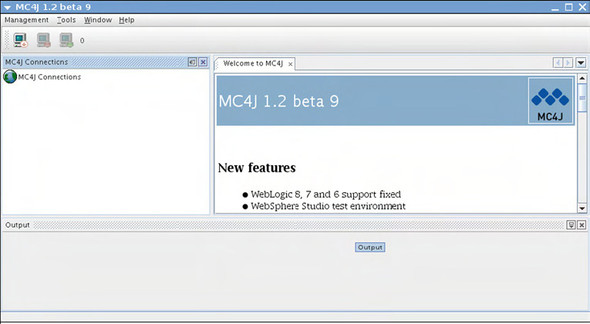
First, you need to download MC4J. Go to http://mc4j.org/confluence/display/mc4j/ Home website, and download the installation package. Run the package, and start up the MC4J application. When you start the application, you’re presented with the screen shown in figure 10.13.
Figure 10.13. MC4J startup screen that you see when you start MC4J for the first time
You now need to connect MC4J to the MBean server. To do this, right-click MC4J Connections, and select the Connect to Server option. Doing so starts the wizard shown in figure 10.14.
Figure 10.14. The MC4J connection wizard
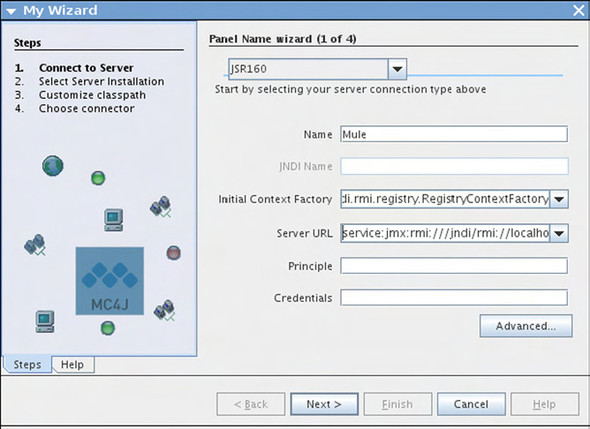
You have to select the connection type. Select JSR160, which is the default way to connect to MBean servers. Give this connection a name and fill in the server URL, which is the same one you used in JConsole: service:jmx:rmi:///jndi/rmi://localhost:1099/server. Click Next, and on the next page click Finish. The Mule connection will be registered; when you expand it, you see the screen shown in figure 10.15.
Figure 10.15. MC4J view of all the MBeans available in the MBean server
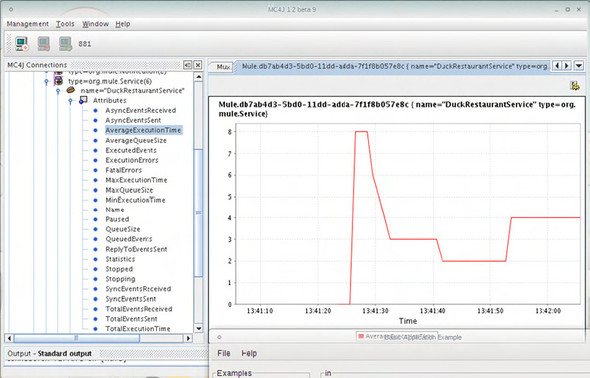
Once you’re connected, navigate to the org.mule.Statistics MBean, and from there select DuckRestaurantService. Open its attributes, and right-click average-ExecutionTime. From the resulting pop-up menu, select the Graph option. When you do this, the right side of the screen shows a graph of that attribute. If you now send a couple of requests over the ESB, you see the graph being updated, as shown in figure 10.16.
Figure 10.16. MC4J showing the average processing time for the DuckRestaurantService Mule service
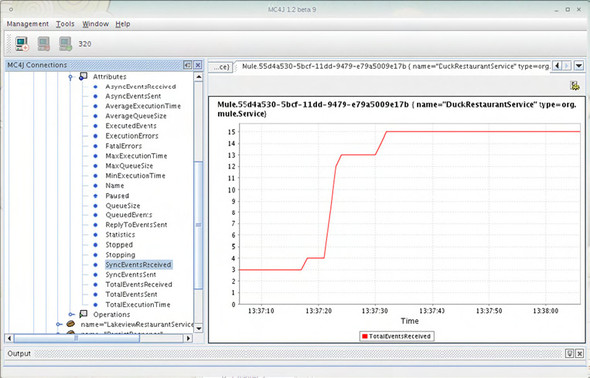
You can do this for all the attributes. For example, figure 10.17 shows the total events received by a certain component.
Figure 10.17. MC4J showing the total number of messages received by the DuckRestaurantService Mule service
As you can see, administrating and monitoring Mule using JMX is easy. You can control connectors and components’ lifecycles, and get all kinds of statistics from the ESB. In addition to the JMX tools shown in this section, Mule provides two tools to manage and monitor the ESB environment: Mule Galaxy and Mule HQ.
10.2.3. Mule Galaxy and Mule HQ
So far, you’ve seen how you can manage and monitor Mule by using open standards and applying common integration patterns. MuleSource, the company behind Mule, also offers two tools that can help you manage your Mule ESB:
- Mule Galaxy— Provides a registry in which you can register your Mule configuration files and the artifacts that your Mule configurations use. Mule Galaxy can then provide lifecycle functionality for your services and artifacts. Mule Galaxy is open source and can easily be integrated with Mule 1.4 and Mule 2.0.
- Mule HQ— An extensive, commercial monitoring environment that you can use to monitor multiple Mule instances at the same time. You can use this tool to stop and start service, deploy new configurations, and check the health of your complete Mule environment.
In this section, we give you a quick overview of what these tools do and how you can use them. For more information about both these tools, visit the Mule website: http://www.mulesource.com.
Mule Galaxy
Mule Galaxy can serve as a service registry for your Mule instances. So, when you use Mule Galaxy, you don’t have to start Mule with a configuration file. Figure 10.18 shows the look and feel of Mule Galaxy.
Figure 10.18. Mule Galaxy, showing the contents of a Mule configuration
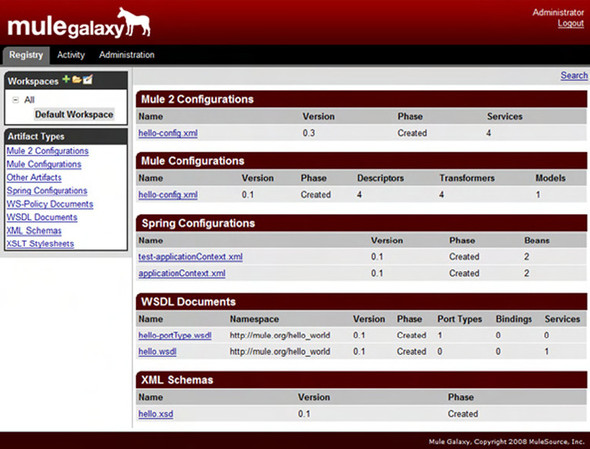
In the figure, you can see all the artifacts managed by this instance of Mule Galaxy. You can also see that Mule Galaxy supports versioning on all these artifacts. This is especially useful when you’re using XML Schemas for validation, or other artifacts that may change during runtime.
Mule Galaxy has only recently been released but already has a lot of functionality. If you want to try it, go to http://www.mulesource.com.
Mule HQ
You can get Mule HQ as part of a subscription package from MuleSource. It provides a single interface where you can monitor all the Mule instances you have running. If you’re running Mule in a mission-critical production environment, using a tool like Mule HQ can be helpful. It can’t monitor the runtime environment, but it can help you proactively detect issues so you solve them before they cause message loss or other serious problems.
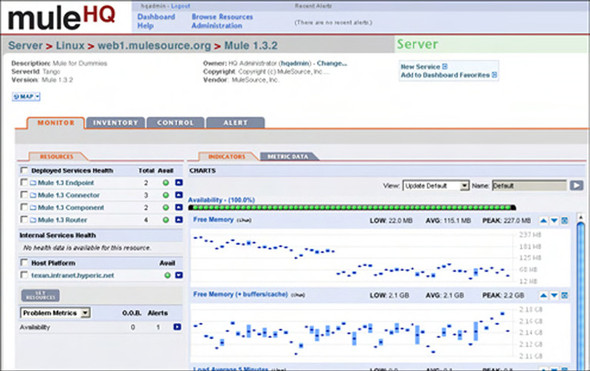
Figure 10.19 shows an example of Mule HQ monitoring a Mule instance. All the Mule services are constantly monitored for health. You can also monitor the health of the platform Mule is running on. In figure 10.19, for instance, the system’s free memory is also monitored.
Figure 10.19. Mule HQ monitors various endpoints and the platform’s available memory.
Now that you’re familiar with Mule’s management and monitoring capabilities, let’s see what ServiceMix exposes through JMX.
10.2.4. Using JMX to administer ServiceMix
When you use JMX with ServiceMix, you don’t need to define any additional configurations. ServiceMix provides a number of MBeans you can use to monitor and administer the ESB. Let’s start by using JConsole to connect to the MBean server and see what ServiceMix makes available to you.
Begin by starting up ServiceMix and JConsole. When JConsole starts, you’re once again presented with the view shown in figure 10.20.
Figure 10.20. Connecting JConsole to ServiceMix
This time, you don’t make a remote connection; you connect directly to the running process, because ServiceMix, in contrast with Mule, uses the default MBean-Server to register its beans. Select the org.codehaus.class.Launcher process and click Connect. Doing so connects you to the MBean server from the ServiceMix process and shows you the screen in figure 10.21.
Figure 10.21. JConsole showing all the management options from ServiceMix
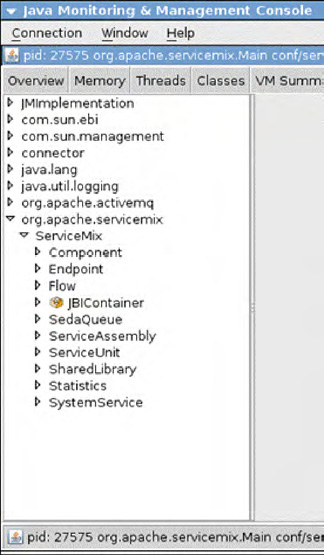
As you can see, ServiceMix exposes a lot of its functionality through JMX. This isn’t just a ServiceMix-specific feature: the JBI specification requires all the management functionality of a JBI container to be exposed through JMX. The primary advantage is that you get the same interface and the same type of options, regardless of the JBI implementation you use.
Let’s quickly look at what the various MBeans let you do. Table 10.2 gives an overview of the categories and MBeans.
Table 10.2. MBean functionality provided by ServiceMix
|
Category |
Description |
|---|---|
| Component | Shows all the deployed components (service engines and binding components) that are installed in the container. Also gives the option to stop and start each component. |
| Endpoint | Lets you view the endpoints that are registered whenever a service unit is deployed. You can also retrieve their WSDL contracts and send messages to those endpoints. |
| Flow | Contains ServiceMix-specific MBeans. For instance, you can stop and start the internally used transports. |
| JBIContainer | Allows you to stop and start the JBIContainer. |
| SedaQueue | Lets you stop and start internally used queues. Note that this category will only be visible when you have components that make use of these queues. |
| ServiceAssembly | Shows all the service assemblies deployed on ServiceMix. From here, you can stop and start a service assembly and get the JBI descriptor file. |
| ServiceUnit | Just as for ServiceAssembly, allows you to stop and start the deployed service units. |
| SharedLibrary | Gives an overview of all the shared libraries deployed in the JBI container. Shared libraries are another artifact you can deploy to a JBI container. |
| Statistics | Lets you access all the statistics of the components and endpoints running on the ESB. |
| SystemService | Gives you complete control over the JBI container. From here, you can deploy new service engines, binding components, and so on. You can also uninstall and remove these artifacts from here. |
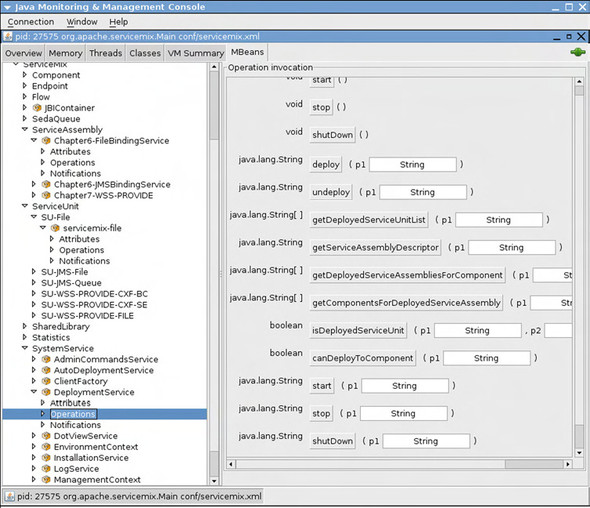
We look more closely at some of the SystemService functionality, because that service provides you with an interface to manage the ServiceMix container. The rest of the JMX MBeans provide stop and start functionality for the various artifacts.
Management functionality exposed by the AdminCommandService
Figure 10.22 shows most of the operations exposed through the AdminCommandService.
Figure 10.22. JConsole showing the operations exposed by the AdminCommandService
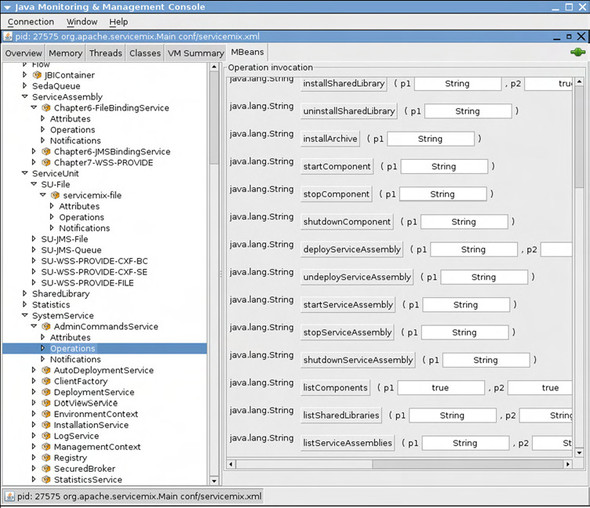
The AdminCommandService lets you control all your JBI artifacts. You can deploy new archives (by specifying an URI to the location of the archive), undeploy artifacts, and get an overview of all the artifacts currently available.
The next part of the SystemService that we examine is the DeploymentService, shown in figure 10.23.
Figure 10.23. JConsole showing the operations exposed for the DeploymentService
The operations shown in figure 10.23 provide extra information about the link between a service assembly and the JBI component on which its service units are deployed. You can also check whether service units are deployed and whether it’s possible to deploy to a certain component.
The last MBean we look at is the LogService, shown in figure 10.24.
Figure 10.24. JConsole showing the exposed methods of the LogService
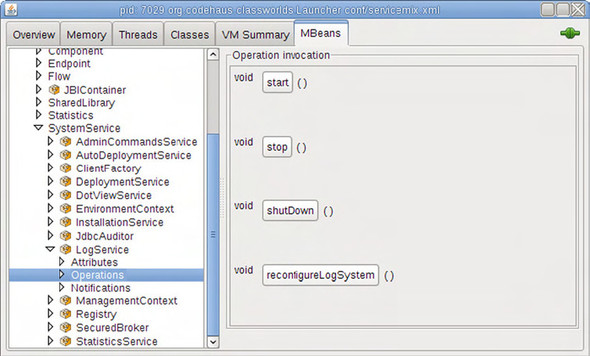
LogService is a simple service with a single interesting method (besides its lifecy-cle methods): reconfigureLogSystem. When this method is called, ServiceMix reloads the Log4j configuration. This allows you to change the log levels while the application is running, which makes debugging live applications much easier.
10.2.5. Monitoring ServiceMix using MC4J
Just as you did with Mule, you use MC4J to monitor some basic statistics from ServiceMix. If you haven’t installed MC4J yet, you can download and install the latest version from http://mc4j.org/confluence/display/mc4j/Home.
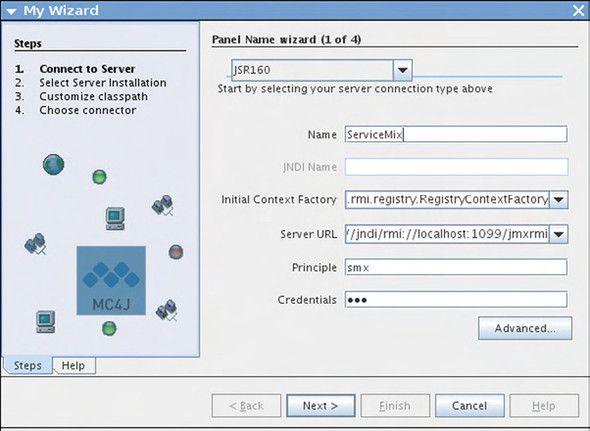
You have to connect to ServiceMix using a server URL. ServiceMix already supplies an RMI-based connector you can use: right-click the connection label in MC4J, and add a new connection. On the first screen of the wizard, shown in figure 10.25, use service:jmx:rmi:///jndi/rmi://localhost:1099/jmxrmi as the server URL. ServiceMix also requires a username and password to access its MBeans. The default username is smx, and the default password is also smx. Fill in these values in the Principle (user) field and in the Credentials (password) field. Then, click Next; on the following screen, click Finish.
Figure 10.25. MC4J connection wizard with values set for ServiceMix
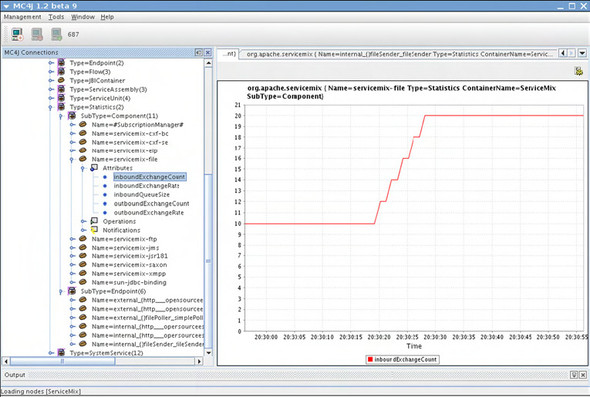
MC4J will connect to the running ServiceMix instance and provide an overview of all the MBeans deployed in the MBean container. For one of these beans, you add a graph with which you monitor the number of incoming messages. To do this, navigate to the Statistics MBean, and select the attribute you want to monitor. The example shown in figure 10.26 is monitoring the number of inbound messages for the file-binding component. If you set up this graph by right-clicking the attribute and choosing Graph from the context menu, you see that when you start sending messages from the file system, this action is reflected in the graph.
Figure 10.26. MC4J monitoring inbound messages for the file-binding component
We’ve shown you some basic uses of JMX. We’ve explained how to use JConsole for easy access to all the management and monitoring functionalities the ESBs offer, and how easy it is to use MC4J to track of attributes and watch trends. If you think back to the example from the previous chapter, you can use this JMX functionality to stop and start the entire flow or to stop sending messages to certain restaurants. With this functionality, it’s also possible to monitor the number of messages sent to a specific endpoint and create statistics.
You can do a lot more with JMX than the functionality discussed in this chapter. For more information about JMX and how to use it, we recommend the Manning book JMX in Action(Benjamin Sullins and Mark Whipple, 2002).
10.3. Summary
In this chapter, we’ve focused on showing how you can manage and monitor two open source ESBs. We first showed how you can use some of the Enterprise Integration patterns to help you get more insight into the messages travelling over the ESB. You learned that with the Wire Tap pattern, it’s easy to see the messages that are sent to certain endpoints. If you have an integration solution in which one of the components is having problems, you can easily add a wire tap that makes a copy of those messages for analysis. With ServiceMix, you can do this dynamically, because you can hot-deploy and restart service units. With Mule, however, you’re forced to alter the configuration and restart Mule.
We also discussed the Message Store pattern, which allows you to store messages for later analysis. This is especially useful when you want to generate statistics or reports for your integration solutions. The last pattern on the list was the Detour pattern, which lets you stop message processing by sending the message to a detour endpoint. After the message is detoured, you can change the message and send it on in its changed form. This is especially useful when you need to debug certain endpoints, and when it isn’t easy to create messages yourself. For the Detour pattern, as for the Wire Tap pattern, you need to restart the ESB in Mule; with ServiceMix, you can redeploy the new configuration.
We also looked at the management options provided by the ESBs. Both ESBs support the JMX standard, which allows you to connect to the ESBs in a generic way. But the ESBs don’t provide the same management options: Mule only allows basic lifecycle management; ServiceMix, on the other hand, lets you control every aspect of the ESB from JMX.
In the section about JMX, you learned how you can manage the ESBs, stop and start components, and even create graphs by monitoring certain attributes. With JMX and the patterns shown in this chapter, you’ve got a fairly complete set of techniques with which you can manage and monitor the ESBs.
We’ve shown how to connect the ESBs to different transports, how transactions and security works, how routing is handled, and how you can work with web services. We have only one subject left to cover. In the next chapter, we examine how Mule and ServiceMix can support service orchestration. We show two different approaches: how to integrate Mule with jBPM, and how the services exposed in ServiceMix can be orchestrated using BPEL.