
16
Velocity Measurements in Impinging Turbulent Jets using Digital Particle Image Velocimetry
M Fairweather, G K Hargrave, and T C Williams
Abstract
Two-dimensional measurements of mean and fluctuating velocities, and shear stresses, within the wall jet region of impinging turbulent air and water jets have been obtained using a Digital Particle Image Velocimetry (DPIV) technique. The data gathered demonstrate that DPIV can be used to derive useful information in this type of flow, of value in improving understanding of what is a practically important flow configuration. The present air jet results, considered in detail, are in good agreement with earlier measurements in similar flows gathered using laser Doppler anemometry, although significant differences do occur with previous hot wire anemometer measurements.
16.1 Introduction
The impingement of a jet on a solid flat surface is a flow configuration of interest in many engineering applications, including cooling, heating, and drying processes, vertical take-off and landing aircraft, and ventilation during mining and tunnelling activities. It is also encountered in evaluations of the consequences of accidental releases of flammable material performed as part of safety and risk assessments on chemical and process plant, and transportation systems.
The orthogonally impinging jet has been the subject of renewed interest lately, not only because of its practical importance, but also because it represents an important test case for the development and validation of mathematical models of turbulent flow. This work has concerned, in particular, the provision of detailed experimental data for the velocity fields encountered in such flows (1), as well as the development of second-moment (2, 3) and non-linear eddy viscosity (4) turbulence closures to more accurately account for the influence of pressure reflections from the solid surface in damping velocity fluctuations normal to the wall. All this work has resulted in a greater understanding of the characteristics of impinging turbulent jets, and in improved methods for predicting reliably their velocity fields.
Data for the velocity and concentration fields in the flow formed by the normal impingement of a methane jet on a flat surface have also been reported, and predictions obtained using a second-moment turbulence closure, modified to include wall reflection effects, demonstrated to be in reasonable agreement with these results (5). However, at large distances from the solid surface, in the outer regions of the radial wall jet, predictions of the latter approach were found to underestimate both mean and fluctuating concentrations. These discrepancies were attributed to differences between experimental and computational boundary conditions and, in particular, the fact that downward firing jet studied experimentally may have given rise to a large recirculation zone which could re-entrain methane from the outer to the initial regions of the wall jet. The existence of such a recirculation zone has important implications for ventilation, tunnelling, and safety applications, since the re-entrainment of jet fluid from the outer to the initial regions of the wall jet could result in the build-up of unwanted flammable material or dust.
The presence of such a recirculation zone has not been observed in many earlier studies, primarily since these studies focussed on the near field and stagnation regions of impinging jets, where wall reflection effects are most significant, and also because most measurements have been made using techniques which are not able to discriminate between vertical and radial velocity components. Profiles of mean radial velocity obtained in the wall jet region of an impinging axisymmetric air jet studied by Bradshaw and Love (6) do, however, indicate that such velocities become negative outside the wall jet region, and the existence of a recirculation zone is clearly visible in the predictions made by Childs and Nixon (7) for the jet studied by the latter authors. Evidence that such zones also occur in plane turbulent impinging jet flows is documented by Looney and Walsh (8).
In addition, the majority of earlier studies of impinging jets gathered data by means of probe techniques, for example, using either pitot tubes (6, 9) or more recently hot wire anemometry (1, 10). The intrusive nature of these devices does, however, mean that they are prone to error. In addition, both probe techniques and laser Doppler anemometry (LDA), as used by Dianat et al. (5), are, by their nature, necessarily restrictive in terms of the extent of the data sets that can be gathered.
The present work was therefore undertaken to resolve the uncertainties concerning the existence of recirculation zones raised by earlier studies, to provide detailed experimental data for use in the formulation and validation of mathematical models of turbulent flows, and to improve understanding of what is a practically important flow configuration. The majority of the work reported herein was carried out using impinging air jets, although data gathered from impinging water jets is also included for comparison purposes.
16.2 Experimental work
The air jet studied experimentally issued from a circular cross-sectioned pipe with an internal diameter, d, of 13.3 mm. The pipe was 50 d in length and air was supplied to the pipe from a compressor, with flow rates metered using mass flow controllers. The average exit velocity from the pipe was 20 m s−1 which gave rise to a fully developed turbulent flow with Re = 18 800. The air jet impinged vertically on to a flat, smooth steel plate 1.3 m × 1.1 m in length situated above the release pipe. For the velocity measurement, the tracer particles employed were μm-sized olive oil droplets, generated using an air-assisted atomizer. These droplets were injected into the release flow pipe 3 m before the exit to ensure uniform seeding. The jet and seeder were also run for 20 minutes before the start of each experiment to build up a high concentration of seed particles in the ambient air to allow the measurements to extend far from the impinged surface, and to minimize velocity bias.
The water jet studied was a fully submerged impinging jet issuing from a circular cross-section pipe with an internal diameter of 13.3 mm. The water jet was contained within a 450 mm cubic tank and impinged vertically down at the centre of the lower surface. The pipe was 50 d in length and was supplied from a pump which re-circulated water from the main tank through a secondary overflow tank, with the water flow rates metered using a turbine flow meter. The mean exit velocity of the release was 1.77 m s−1, giving a release Reynolds number of 23 000. Tracer particles of 7 to 12 μm and a relative density of 1.05 were employed in this study.
For both experiments, the pipe exit was located 26.6 mm from the impingement surface (h/d = 2) and the rigs were mounted on a hydraulic table to allow vertical positioning relative to the measurement locations.
Two-dimensional velocity field measurements were made using Digital Particle Image Velocimetry (DPIV). This technique provides rapid access to two-dimensional velocity fields by imaging the displacement of tracer particles in a flow field using high-resolution digital cameras. For these studies the DPIV system was configured for cross-correlation analysis. With this technique two consecutive images of a particle image field are captured with a predetermined time interval and the images cross-correlated to determine the particle displacements and thereby the particle velocities.
The illumination source for the measurements was a pair of Nd:YAG lasers. These lasers were configured to generate 200 mJ pulses with a pulse width of 10 ns at a rate of 10 Hz. The beams from the two lasers were configured to intersect at the point of interest in the flow and focussed using a 1.5 m focal length spherical lens. The beams were formed into a laser sheet using a 100 mm focal length cylindrical lens. In the measurement region the sheet was uniform over an area of 50 mm square, and was approximately 1 mm thick. Imaging of the particles was accomplished using a Kodak ES1.0 Digital CCD camera. This provides images with 1000 × 1000 pixels and 8 bits depth. This camera was operated in a double exposure mode that allowed the recording of two consecutive images on the single CCD. The camera was interfaced to a PC using a frame grabber that allowed recording of the double images at the 10 Hz repetition rate of the laser. The imaged field was varied from 18 × 18 mm to 6 × 6 mm, providing a maximum resolution in the flow field of 6 μm.
A control system provided synchronization of the image capture. This unit used a 10 Hz clock synchronization pulse to the computer, which triggered the image capture, and two trigger pulses to fire the lasers. The separation between the pulses was varied from 15 μs to 500 μs, depending on the local flow velocity, in order to control the particle displacement on the image. For the cross-correlation analysis the interrogation region was maintained at 64 × 64 pixels and the pulse separation varied to achieve 30 per cent to 50 per cent displacement.
In the air jet, instantaneous velocity profiles were captured at radial displacements of 5, 10, 20, and 30 diameters from the stagnation point. At each measurement location typically 800 image pairs were recorded for each region of the velocity profile. At 20 d in the air jet study, this corresponded to a total of 4800 individual image pairs required to build the complete profile through the wall jet region. From the large number of individual velocity vectors recorded at each measurement location it was then possible to calculate time-averaged mean and fluctuating velocities, as well as local shear stresses. For comparison purposes, similar measurements in the water jet were made through the wall jet boundary layer at a radial distance of five diameters from the stagnation point.
16.3 Results and discussion
Instantaneous laser images of the complete air jet flow, obtained by forming the light from an Nd:YAG laser into a planar sheet and recording flow images using the CCD camera, demonstrated high levels of intermittency in the outer regions of the wall jet region of the flow, and the presence of large-scale structures. These structures in turn caused atmospheric air to penetrate the wall jet and reach the surface of the plate very early on in the wall jet's development. Further experiments, in which the ambient air was seeded, demonstrated that the free portion of the jet flow generated entrainment lines that were at approximately 45 degrees to the vertical which led to the establishment of a large, low velocity recirculation zone of a size the same order as the impinged plate and with a time period of ≈ 8 s. This carried material from the periphery of the wall jet back to its initial regions, causing low levels of jet material to persist to large distances from the surface.
Mean radial velocity profiles through the wall jet region of the impinging air jet at four distances from the stagnation point, r, of 5, 10, 20, and 30 d are given in Fig. 16.1. In this figure, U represents the mean radial velocity, Vb the bulk mean vertical velocity from the pipe, and y the distance from the solid surface. The development of the wall jet region is clearly illustrated in these figures, as is the influence of the recirculation zone on flow velocities outside the wall boundary layer. Mean radial velocity data within the wall jet peak at small distances from the surface, with maximum values (Um) steadily decaying as the boundary layer mixes with ambient fluid. Peak values also increase in distance from the surface as the boundary layer grows in thickness and the influence of the solid wall increases. In addition, the influence of the recirculation zone is clearly seen at the outer limits of the wall jet region where mean radial velocities become negative. These velocities are relatively small compared to those encountered within the wall jet region itself, and show peak values which move progressively away from the surface with increasing radial distance. Maximum negative values are encountered close to the stagnation point where entrainment velocities into the jet are high. Data gathered at larger distances from the surface indicate that, at r/d = 10 for example, the recirculation zone extends to approximately y/d = 8.5. The presence of the recirculation zone also causes jet fluid from the outer regions of the wall jet to be re-entrained into its initial regions. This in turn causes jet fluid to persist to large distances from the surface and may, in some situations such as for releases of flammable material, allow ignition to occur at greater distances from the surface than might otherwise be anticipated.

Fig. 16.1 Mean radial velocity through the wall jet region of the impinging air jet at four radial locations
The large number of individual velocity vectors recorded at each measurement location within the air jet not only allowed mean radial and vertical (V) velocities (relative to the plate) to be determined, but also permitted the derivation of root mean square (r.m.s.) fluctuating horizontal (u′) and vertical (v′) velocities, and the shear stress (![]() ). Typical values, obtained at r/d = 10, are shown in Figs 16.2 and 16.3.
). Typical values, obtained at r/d = 10, are shown in Figs 16.2 and 16.3.
The profile of mean vertical velocity within the air jet (Fig. 16.2) again illustrates the influence of the recirculation zone, with values of this velocity component becoming negative outside the wall jet region which, at this location, extends to approximately y/d = 1.2. Data gathered at larger distances from the surface again indicated that the recirculation zone extended to approximately y/d = 8.5. Data for r.m.s. fluctuating vertical (Fig. 16.2) and horizontal (Fig. 16.3) velocities are in qualitative agreement with earlier findings (1, 5, 10) with both data sets showing peaks within the wall jet region. Shear stress data (Fig. 16.3) is similarly in accord with earlier results, with values close to the surface being slightly negative, but then becoming positive as distance through the wall jet increases. Beyond the limit of the wall jet, at y/d ≈ 1.2, profiles of u′ and v′ asymptote to small, but non-zero, values due to the presence of the recirculation zone, with the ![]() profile also decreasing from its maximum within the wall jet region to effectively zero at y/d ≈ 2.
profile also decreasing from its maximum within the wall jet region to effectively zero at y/d ≈ 2.
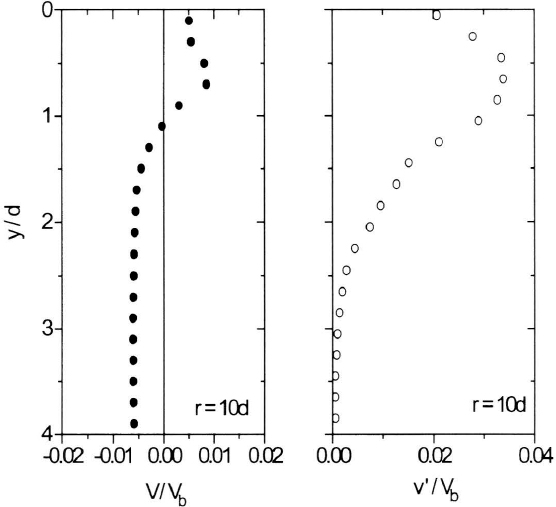
Fig. 16.2 Mean and r.m.s. fluctuating vertical velocities through the wall jet region of the impinging air jet at r/d = 10
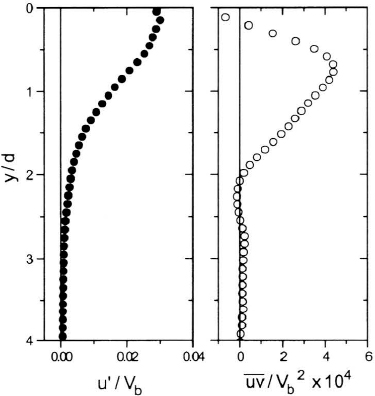
Fig. 16.3 R.m.s. fluctuating radial velocity and shear stress through the wall jet region of the impinging air jet at r/d = 10
Mean and r.m.s. fluctuating radial, and vertical velocities through the wall jet regions of the impinging air and water jets at r/d = 5 are compared in Fig. 16.4, where results have been non-dimensionalized by the peak mean radial velocity, Um. These data show excellent agreement between measurements taken in the two flows, with the location of velocity peaks and the widths of the wall jet regions being in close accord. Some differences do occur, particularly in terms of the r.m.s. fluctuating vertical velocity, although this is to be anticipated since wall jet profiles for fluctuating quantities had not reached self-similarity by this measurement location (discussed further below). Values of the shear stress, not shown in Fig. 16.4, differed significantly at this location in the flow for the same reason. Overall, these results demonstrate that the structure and development of the two jets remains similar, despite the differing nature of the two flows. Importantly, however, data obtained for the water jet do not exhibit any influence of a recirculation zone outside the wall jet region, with mean radial velocities remaining positive at all positions through the wall jet. Preliminary data obtained at other radial locations and flow visualization results confirmed this finding. Given the similarity in the exit Reynolds numbers of the two flows, it is therefore evident that the occurrence of such recirculation zones is independent of Re and a function of local flow velocities, with the higher velocities encountered in the air jet triggering the onset of such zones.
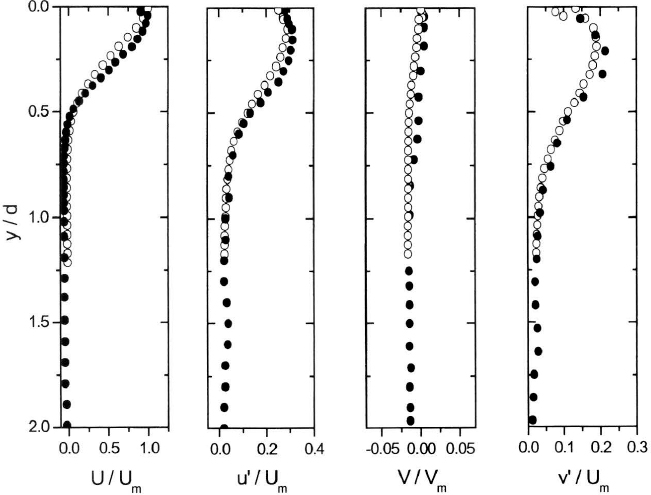
Fig. 16.4 Mean and r.m.s. fluctuating radial and vertical velocities through the wall jet region of the impinging air and water jets at r/d = 5 (open circles – water jet, solid circles – air jet)
The analysis of instantaneous velocity vector images to derive time-averaged mean and fluctuating velocities, and shear stresses, was carried out using purpose written software. In calculating such values, it was obviously important to use a sufficient number of vector images to ensure that statistically meaningful time-averaged data were derived. As an example, the influence of the number of vector images employed in determining r.m.s. fluctuating vertical velocity data through the wall jet region of the impinging air jet at r/d = 10 is illustrated in Fig. 16.5. Results are given for 200, 600, and 1200 image pairs used to calculate time-averaged information at each measurement point. The number of images employed obviously has a critical effect on the derived time-averaged profile, with data determined using 200 images clearly exhibiting a great deal of scatter since the number of images used was insufficient to provide statistically meaningful r.m.s. values. The scatter is particularly large close to the surface and within the wall jet region at y/d < 1.2 where high r.m.s. values are encountered, and the influence of the wall and large mean radial velocities is greatest. The amount of scatter was reduced when 600 images were employed, although it was only with 1200 images and above that derived profiles became independent of the number of images used.

Fig. 16.5 Influence of number of velocity vector images on time-averaged r.m.s fluctuating vertical velocity data through the wall jet region of the impinging air jet at r/d = 10
Comparison of the present data with earlier results, obtained using hot wire (10) and laser Doppler anemometry (5), is shown in Figs 16.6 and 16.7. These figures give, respectively, profiles of normalized mean radial and r.m.s. fluctuating vertical velocities, with the results having been non-dimensionalized by the peak mean radial velocity, Um, and the appropriate velocity half-width, δ. The lines used to represent the results of Dianat et al. (5) and Poreh et al. (10) are fits which include data from a number of measurement stations at similar radial locations (r/d ≥ 9) to those examined in the present work. For the air jet, the present results are shown for all four radial measurement locations in Fig. 16.6, but exclude those from r/d = 5 in Fig. 16.7 since self-similarity of the r.m.s. profile had not been achieved by this measurement station. Measurements at r/d = 5 in the water jet are included in Fig. 16.6 for comparison purposes.
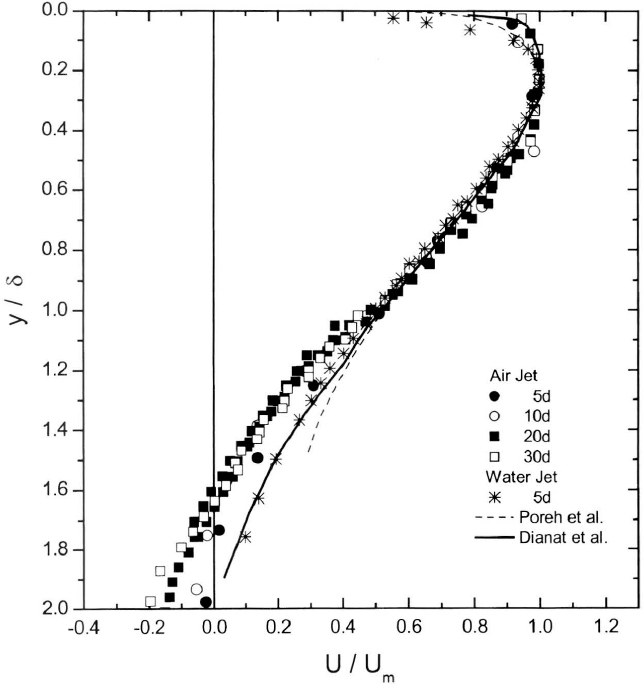
Fig. 16.6 Profiles of normalized mean radial velocity within the wall jet region

Fig. 16.7 Profiles of normalized r.m.s. fluctuating velocity normal to the surface within the wall jet region of the impinging air jet
Agreement between the present air jet data and that of Dianat et al. (5) is in general good for both mean and r.m.s. fluctuating velocities, with the scatter observed in the present results being similar to that found in the earlier (5) LDA data. In particular, agreement for the mean velocity profiles is excellent over most of the range considered by Dianat et al. (5), with the original data of the latter authors again indicating that negative velocities did occur outside the wall jet region (10). The present non-dimensionalized air jet profiles of r.m.s. fluctuating velocity are also in good agreement with earlier results (5), both qualitatively and quantitatively, with peak values in particular being in close accord. There is, however, a slight underestimation by the DPIV measurements of both mean and r.m.s. values obtained using LDA at locations just outside the wall jet region at y/δ> 1.0. Mean velocity data obtained for the water jet, at r/d = 5, is in reasonable agreement with the air jet results in the inner regions of the boundary layer, although some differences do occur very close to the impinged surface. These differences are most likely caused by a lack of self-similarity in the water jet measurements. Differences also occur towards the outer regions of the wall jet where close agreement with the results of Dianat et al. (5) is apparent. This divergence between air and water jet data is inevitable given the absence of any recirculation zone in the latter flow. Agreement with the data of Dianat et al. (5) may also be considered fortuitous given the fact that the original data of the latter authors indicates negative velocities at larger y/δ.
In contrast, agreement with the hot wire data of Poreh et al. (10) is less satisfactory. Mean velocities are again in reasonable agreement over the bulk of the wall jet region, but towards the outer edge of the boundary layer significant deviations begin to occur. The original data of Poreh et al. (10) do in fact indicate that values asymptote to zero in this region rather than becoming negative. This may be due to the absence of any external recirculation zone in the impinging jet configuration examined by these authors, or because hot wire anemometers are unable to discriminate between vertical and radial velocity components. Towards the outer edge of the wall jet region, therefore, and in the presence of a significant V velocity component, hot wires would record values of (U2 + V2)0.5 /Vb, which must asymptote to zero. In addition, the present results overestimate peak values of the r.m.s. fluctuating velocity obtained by Poreh et al. (10), with the peak observed by the latter authors also occurring much closer to the impinged surface. Again, these differences may be due to the intrusive nature of the measurement technique employed by these authors, or the directional ambiguities encountered in using probe techniques in highly turbulent flows.
Overall, therefore, good agreement is observed between data obtained in the present DPIV study and the earlier LDA measurements of Dianat et al. (5) particularly given the widely different conditions for which the data of the latter authors were obtained (i.e. methane jet firing vertically down, d = 10.8 mm, h/d = 12.82, Vb = 152 m s−1). Significant differences do, however, occur between data gathered using both of the latter laser diagnostic techniques and the intrusive probe measurements of Poreh et al. (10), calling into question the accuracy of probe measurement techniques.
16.4 Conclusions
An experimental study of turbulent air and water jets that impinge orthogonally on to a flat surface has been described. This study was undertaken to resolve the uncertainties concerning the existence of recirculation zones raised by earlier work, to provide detailed experimental data for use in the formulation and validation of mathematical models of turbulent flows, and to improve understanding of what is a practically important flow configuration. The major conclusions of this work are:
- Useful data for mean and fluctuating velocities, and shear stresses, can be obtained using the DPIV technique, provided that a sufficient number of instantaneous velocity vector images are employed to ensure that statistically meaningful time-averaged data are derived.
- The present DPIV data are in good agreement with earlier results obtained in impinging jet flows using laser Doppler anemometry. Significant differences do, however, occur between data gathered using both of the latter laser diagnostic techniques and earlier hot wire anemometer measurements, calling into question the accuracy of probe measurement techniques.
- Velocity field data obtained for the impinging air jet clearly demonstrate the existence of a large, low velocity recirculation zone in the impinging jet flow that carries material from the periphery of the wall jet back to its initial regions. In contrast, this feature is absent from measurements obtained in a water jet with similar exit Reynolds number. Given the similarity in the exit Reynolds numbers of the two flows, it would therefore appear that the occurrence of such recirculation zones is a function of local flow velocities.
References
(1) Cooper, D., Jackson, D. C., Launder, B. E., and Liao, G. X., 1993, ‘Impinging Jet Studies for Turbulence Model Assessment – I. Flow-Field Experiments’, Int. J. Heat Mass Transfer, Vol. 36, pp. 2675–2684.
(2) Craft, T. J., Graham, L. J. W., and Launder, B. E., 1993, ‘Impinging Jet Studies for Turbulence Model Assessment – II. An Examination of the Performance of Four Turbulence Models’, Int. J. Heat Mass Transfer, Vol. 36, pp. 2685–2697.
(3) Dianat, M., Fairweather, M., and Jones, W. P., 1996. ‘Reynolds Stress Closure Applied to Axisymmetric, Impinging Turbulent Jets’, Theoret. Comput. Fluid Dynamics. Vol. 8, pp. 435–447.
(4) Craft, T. J., Launder, B. E., and Suga, K., ‘A Non-Linear Eddy Viscosity Model Including Sensitivity to Stress Anisotropy’, Tenth Symposium on Turbulent Shear Flows, Pennsylvania State University, 14–16 August 1995.
(5) Dianat, M., Fairweather, M., and Jones, W. P., ‘Predictions of the Concentration Field of an Impacting Turbulent Jet’, Tenth Symposium on Turbulent Shear Flows, Pennsylvania State University, 14–16 August 1995.
(6) Bradshaw, P. and Love, E. M., ‘The Normal Impingement of a Circular Air Jet on a Flat Surface’, A.R.C. R&M 3205, 1959.
(7) Childs, R. E., and Nixon, D., ‘Simulation of Impinging Turbulent Jets’, AIAA 23rd Aerospace Sciences Meeting, Reno. 14–17 January 1985.
(8) Looney, M. K., and Walsh, J. J., 1984, ‘Mean-Flow, and Turbulent Characteristics of Free, and Impinging Jet Flows’, J. Fluid Mech., Vol. 147, pp. 397–429.
(9) Beltaos, S., and Rajaratnam, N., 1974, ‘Impinging Circular Turbulent Jets’, ASCE J. Hydraulics Div., Vol. 100, pp. 1313–1328.
(10) Poreh, M., Tsuei, Y. G., and Cermak, J. E., 1967, ‘Investigation of a Turbulent Radial Wall Jet’, Trans. ASME J. Appl. Mech., Vol. 34, pp. 457–463.
M Fairweather
University of Leeds, UK
G K Hargrave and T C Williams
Loughborough University, UK