
19
Gas/Liquid Mixing: Simultaneous PIV Measurements of Two Phases Mixing Together; High-pressure Spray Application
Abstract
The aim of this work is to provide an efficient tool to describe the mixing between liquid and gas phases like, for example, high pressure spray atomization in quiet ambient gas. Out of the basic research interest this is of very high importance for car engine or agricultural spray manufactories. We describe a new planar visualization technique which allows simultaneous measurements of droplet and ambient gas velocity. It combines planar Mie scattering diffusion and planar laser induced fluorescence. Digital image treatment and analysis are used to discriminate the two phase flow information necessary to apply PIV. The basic principle is to seed the ambient gas and to tag the liquid with fluorescent. A synchronized system combining two different CCD cameras (one mounted with a filter) and two Yag lasers, respectively used to record images and to generate light sheets, was designed. We show the steps involved in discriminate gas from liquid information. This technique is efficient independently from the droplet shape. Furthermore this technique furnishes some instantaneous results (velocity field and droplet apparent diameter) which is of high importance for gas/liquid mixing. Instantaneous liquid and ambient gas velocity field examples are given in case of 6 MPa pressure spray.
19.1 Introduction
In the past twenty years, some optical techniques were developed for characterizing liquid or gas velocity in two-phase flow studies. Few of them are able to deliver simultaneously gas and liquid characterization (velocity and shape) at the same location. Recently, single point optical measurements were largely used, like laser Doppler velocimetry (LDV) (1, 2) and phase Doppler particle analysis (as PDPA) (3, 4, 5, 6). They demonstrate accuracy for measuring the size and velocity of isolated particles in the case of spray atomization phenomena. Unfortunately, in such case (spray atomization), the presence of non-spherical particles is frequent and these kind of techniques (PDPA) can only characterize spherical droplets (7). Besides, even if seeding particles and droplets are both spherical it might be difficult to extend these methods (which can separate respective seeding by sizing) to discriminate between the different phases because (8) the droplets size distribution generally overlaps with that of the seeding particles, for example. Some partial solutions have been found like tagging liquid with fluoresced dye (9, 10).
On the other hand, there is a large use of PIV (11) or qualitative visualization techniques which contribute to a better knowledge of velocity fields or spatial structure organization (12) of liquid and gaseous phase. The direct visualization of the droplet images is obtained regardless of their size or their position. For the studies of spray with mixing of liquid phase with the ambient gas and characterization of the velocity field of both phases, we need, unambiguously, to discriminate between the droplets issued from the spray atomization and particles seeding the ambient gas (13). Previous works (14, 15) are concerned with the application of visualization techniques to this kind of flow. But to our knowledge, few are able to describe velocity statistics simultaneously for the ambient gas and the liquid phases in the same measurement location. Consequently, we developed a visualization technique to achieve the discrimination of water droplets and particles seeding the gas (16). Associated with PIV, this allows us to simultaneously determine velocity fields of gas and liquid phases in the same location.
Combined techniques are now currently used to simultaneously obtain different scalar quantities or same quantities from different flows mixing together. Recently we have noticed the mass fluxes measurements (17, 18, 19), the segregation coefficient measurements (20), or the velocity field determination of impinging jets (21). The first one is used for quantitative measurements both in air and water and provides simultaneously at the same location the velocity and the concentration fields of turbulent flows. A turbulent flow is seeded simultaneously with fluorescent dye or solid particles for concentration determination and solid particles for PIV analysis. The second one is devoted to the mixing of two turbulent flows and allows simultaneous concentration fluctuation determination, of two different passive scalars, at the same location. Two turbulent flows are seeded with different fluorescent dyes. In spite of spectrum overlapping, separation of fluorescent intensity was obtained. This provides quantitative segregation coefficient for two species. The third one allows qualitative simultaneous determination of the velocity fields of two impinging jets. The first flow is seeded with droplets tagged with fluorescent dye and the other one with non-tagged droplets. This allows droplets seeding both flows to be separated in order to apply PIV. This is a combined approach using LIF and PIV. Unfortunately the principle which uses color PIV (22) doesn't succeed in separating the flows at two succesive instants t and t + δt and would be difficult to apply to spray atomization study. Our approach doesn't contain such problems. The spray is a complex flow whose understanding is crucial, for example, for car engine improvment. This is a liquid jet which is submitted to an atomization providing liquid droplets which have their own dynamic and entrain the ambient gaseous phase in the core of the flow. It is necessary to determine the correlation of the dynamic of both phases, furthermore, simultaneous information leading to phase contact quantification will improve our knowledge of mixing processes for such flow. In the present work velocity fields of both phases are obtained by cross-correlation PIV. It necessitates images from non intrusive particle or droplet which seed separately, both phases. For the liquid phase this was furnished naturally by the images of droplets issued from the atomization. The gaseous phase necessitates another seeding in order to be discriminated. This is obtained with micrometer solid particles. Nevertheless separation would be able only if different wavelength are issued from the respective seeding. Our choice was similar as the one used in (10) or in (17). Fluorescent dye tagging the liquid provides droplet images at a higher wavelength than solid image particles which diffused at the initial wavelength by Mie Scattering Diffusion (MSD). Wavelength filtering is thus necessary to separate information. Digital image processing is used to avoid ambiguities and to provide supplementary information on the droplet shapes. After a description of the set-up apparatus, we detail the image processing analysis used in the technique. The last part presents results for velocity field relative to the application with the high pressure spray. Original results on induced gaseous phase are presented to illustrate the use of this technique.
19.2 Experimental procedure
19.2.1 Experimental facility
The technique is applied to study a high pressure (injection pressure = 6–12 MPa) spray discharging in quiet gas inside a non-closed cylinder (Fig. 19.1). The bottom and top of this cylinder are totally opened to avoid any recirculation. On the cylinder, four windows are disposed at 0°, 90°, 180°, and 270°. Two Nd:Yag lasers are used in order to generate a sheet of light whose thickness was about 200 μm. Two opposite windows are used to homogeneously illuminate both sides of the spray. This allows mainly the total illumination of droplets (without shadows). High energy of enlightment (300 mJ) is delivered by each of the two Nd:Yag. It is necessary for obtaining two successive images for PIV analysis. The two other windows provide an optical access (perpendicularly to the sheet of light) for two opposite and synchronized CCD cameras: LHESA (LH 510, CCD camera) and TSI (PIVCAM, CCD camera) PIV systems. One of the cameras is equipped with a pass-band filter and mounted with a macro-ring + a lens of 135 mm focal length. The second camera receives directly MSD intensity and Fluoresced intensity re-emitted by the incense particles and by water tagged droplets. It is mounted with a bellows + a lens of 85 mm focal length. The two CCD cameras are cross-correlation cameras. The spray issues from an injector nozzle (in-diameter d = 0.2 mm, length 1 = 0.8 mm) at a velocity around 90 m/s.
A digital image containing droplet images laser induced fluorescent (LIF) intensity information and a second digital image containing droplets and incense particles information (MSD intensity information) are recorded simultaneously. Our inter-pixel distance is 18 μm for gas phase images. It is 11.5 μm vertically and 16.7 μm horizontally for the liquid phase images. This corresponds for both phase to a magnification around 2.
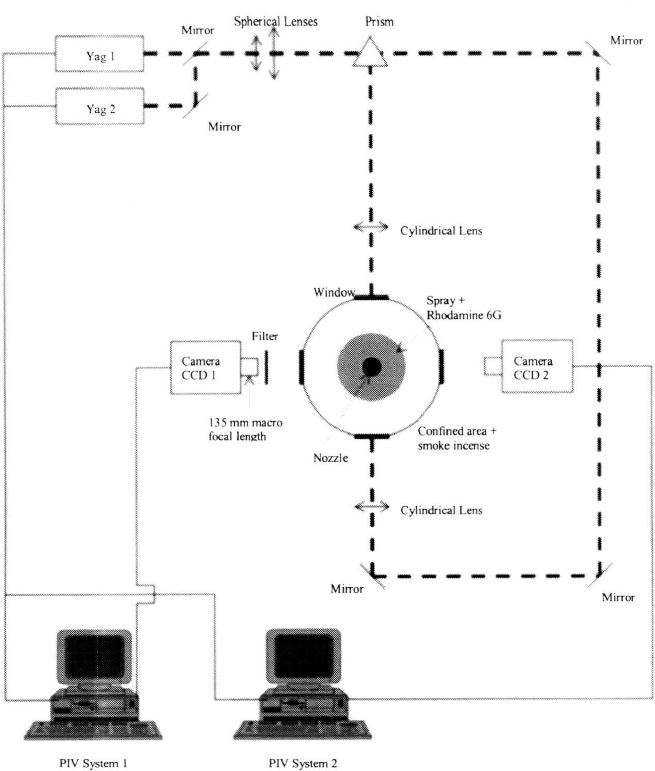
Fig. 19.1 Optical configuration for the spray experiment
19.2.2 Physical principles of phase separation
To separate the phase informations, the liquid phase is tagged with Rhodamin 6G dye (with a concentration of 200 ppm) and the ambient gas is seeded with incense particles of 0.1–3 μm diameter. Tests were carried out to show that their presence doesn't perturb the flow. This principle was previously used to discriminate droplets from solid particles (9, 10, 23) for single point measurements. LIF intensity (at λf = 575 nm) and MSD intensity (at λ0 = 532 nm) are re-emitted by droplets or solid particles after illumination with a laser sheet in the area of interest. Intensities are recorded simultaeously on the two synchronized cross-correlation B/W CCD cameras. The laser sheet is obtained with a double pulsed Nd:Yag lasers (λ0) coupled with a sphero-cylindrical lens system. Each camera is synchronized with the double pulsed laser. This furnishes a pair of images at instant t and at instant t + δt. In the area of interest, the droplets reemit light at the initial wavelength (λ0) and at the fluoresced wavelength (λf). The physical principles are described in (17) or (19) when applied to the determination of mass fluxes for turbulent dispersion of passive scalar in water or in air. Using a pass-band filter on the first CCD camera (CCD1), we obtain images containing only the fluoresced intensity (at λf), i.e. only the droplet images. Images with the other CCD camera (CCD2), without any filter, contain both MSD light (at λ0) and LIF light (at λf), i.e. droplets and solid particles. MSD intensity has a higher level than LIF intensity for a given droplet diameter. This can provide, on CCD2, images from the finest droplets, which are not present on CCD1. This could be the main problem inherent to the principle chosen here. This was also developed and explained in (21). The sensibility of CCD1 is largely greater than the one of CCD2. We perform manual adjustments on apertures of the objective lenses of CCD1 and CCD2 to avoid such problem. And we performed tests to check that such problems are avoided. After some digital image treatment and analysis [Binary operations and Pattern Recognition (PR)], we are able to separate the droplet images from the solid particle images without ambiguities. Consequently, with such separated information, PIV, and digital image analysis, we simultaneously obtain the velocity of liquid and gaseous phases.
A problem, which could exist with the technique, is the creation of MSD information, which is not issued from solid particles but from droplets. This could be due to:
a) Inherent problems to the present available set-up. This mainly concerns with:
– the two different available CCD cameras used here;
– and the choice of two different CCD camera locations (induced by the available laser energy) in place of use of splitter [as in (21)].
b) LIF droplet images, which could be different from MSD droplet images due to reflection on surface droplets. This last problem concerns with large droplets on MSD images, but the digital PR process used here recognized them without ambiguity on LIF images. No part of them can be confused with solid particle images at the end of the process before applying PIV for gas phase.
The only problem is that a) induces ‘noise error’. In the present application, CCD cameras are disposed opposite each other avoiding the use of beam splitter as in (21). Such use allows recording of total re-emitted intensity. This solution is chosen, in spite of supplementary geometrical uncertainties induced by the opposite locations, to avoid cancelling of less intense droplet images (unavoidable if intensity decreases by a factor 2 with the use of a splitter). With our camera this is a crucial constraint to record the finest droplet images (always difficult when a CCD camera has not enough sensibility). In our operating mode (Yag lasers, emission at 532 nm), we can not excite the Rhodamin 6G on the exact maximum absorption peak of the dye. This gives us a weaker fluoresced intensity than expected at 515 nm excitation wavelength. Nevertheless even with optimal apparatus (semi-transparent mirror, higher sensibility, ...) such problems exist due to laws of emission intensity. Then we use different apertures.
19.2.3 Digital image treatment
We now present the digital image processing (binary operations and PR process), which is performed on a SUN workstation before applying PIV analysis.
We consider at this stage of our process two digital images of the same area of interest, which are recorded at the same instant t separately by the two synchronized CCD cameras. We call a pair of images these two images. One contains LIF images of droplets, IiF. The other, IiM, contains the corresponding MSD images of droplets and the MSD images of solid particles seeding the ambient gas (where i = 1, N; N being the number of statistical realizations). In our case 500 realizations were recorded. The next stage is the use of digital image treatment and analysis (the process is described in Fig. 19.2) in order to dissociate droplets contained in the images IiM and IiF [Figs 19.3(a) and 19.3(b)], from solid particle images contained only in IiM [Fig. 19.3(a)]. We choose binary image analysis and pattern recognition (24).

Fig. 19.2 Description of the complete digital process to determine images of solid particles from images containing particle images and droplet images

Fig. 19.3(a) Original Mie intensity image IiM, (b) Original Fluoresced intensity image IiF, (c) Binarized Mie intensity image IiMb, (d) Binarized Fluoresced intensity image IiFb, (e) Final binary image from incense particles IiIb
Firstly, we binarize the images, which are coded with 256 grey-level values. The resulting images are IiMb [Fig. 19.3(c)] and IiFb [Fig. 19.3(d) after geometrical corrections]. Secondly, we have to recognize the objects of the pairs of images, to code them (25, 12), to compare them in order to subtract binary droplets images from IiMb. The binary subtraction, giving Ii2 is an absolute one and is not sufficient because of the noise error. Criteria used are the apparent diameter (AD) and centroïd criteria. They are geometrical parameters quantifying droplets, sufficient to help with recognizing them. The first one was obtained as following:
- Freemann coding (26) of the boundary objects (BO).
- Perimeter measured as follows:
- between adjacent pixel center, if centers are aligned horizontally or vertically
- 0.5 if not.
Counting of pixel inside the BO, including pixels describing BO gives the droplet image area Ai. Then we compare Ii2 with IiMb in order to remove from Ii2 all objects having no equivalent object on IiMb. The equivalence means to have the same AD and centroïd with a tolerance of ±5%.
We use a hypothesis of spherical shape to deduce the instantaneous and individual (for each droplet) AD. The real diameter measurements are very sensible to magnification and sampling problems, thus we deduce the instantaneous (for individual droplets) AD from area measurements Ai, which is a less sensible parameter than the perimeter estimation (24). For the PR process this is a measurement which needs to give the same result when applied to LIF or MSD images (reproducibility). Centroïd is the classical one with pixels detected as part of a droplet.
A priori some differences could exist in apparent shape due to fluorescent wavelength and initial reemission wavelength. Effectively, intensity reemission laws are different and can be written as follows:
![]()
for fluorescence (10, 11), and:
![]()
for Mie diffusion, where A and B are constants. Indeed as consequence of (19.1), (19.2), and difference of sensibility of the CCD cameras, some particle images present in IiM could be not present on IiF. Larger sensibility is needed to recover the complete range of droplet diameter from LIF images. This is our case and adjustment of apertures of the 2 CCD cameras were done to record on both cameras the intensity emitted by the finest droplets.
After thresholding, the binary image IiMb, issued from IiM, is subtracted from the binary image IiFb, issued from IiF, giving an image Ii0 which contains binary information due to incense and information due to droplets. This last information is some noise and we need to remove it. This is achieved in three stages.
- Multiplying Ii0 by IiFb gives I1 which contains only non desirable information due to binary fluoresced particle images.
- Subtraction between Ii1 and Ii0 gives Ii2 which contains information due to incense and due to non desirable Mie diffusion droplet images.
- Ii2 is constituted of individual objects. For these objects we determine their centroïd and their AD, as described previously. A comparison (of AD and centroïd) is performed with objects contained in IiMb. If an object contained in Ii2 has not an equivalent object in IiMb we remove it from Ii2, otherwise we preserve it. At the end of procedure an image IiIb contains only binary images due to incense particles. Multiplication of IiIb, by IiM gives some apparent incense particles (seeding the gas phase) only on a definitive image Ii1. This image contains the original grey-level values describing the particles images used for PIV analysis of the gas phase.
19.3 Results
All the procedures described were conducted to provide valid information usable for simultaneous and instantaneous PIV analysis both for gas and liquid phases mixing together. Figure 19.4 shows simultaneous instantaneous velocity field for gas and droplet velocity for the same area of interest for spray application. It is clear here that such a map contains frequently undetermination of gas velocity when there is numerous droplets.
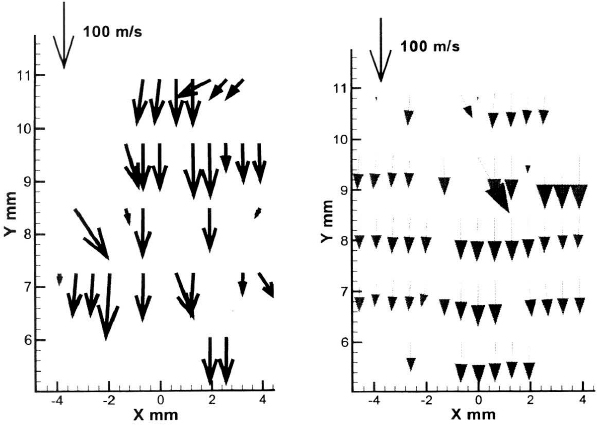
Fig. 19.4 Instantaneous gas velocity field (left), corresponding instantaneous droplet velocity field (right)
The laser was synchronized with both systems. Pairs of images were recorded at t and t + δt where δt was 5 μs. We used 64 × 64 pixels2 for the elementary meshes. Gaussian method is used for sub-pixel accuracy in PIV analysis. The center of the images corresponds to spray axis at 900d from the nozzle exit.
The first results concerning the application of the combined technique are shown in Figs 19.5 and 19.6. The common area corresponds to 50 mm2. The mean axial velocities of liquid and gas are measured. It shows that there is a large difference between liquid velocity field and gas velocity field. This fact indicates that it is important to discriminate phases in order to describe the gas penetration in to the liquid phase in atomization studies. The gas velocity is higher than velocity of the finest droplets and close to the large one. This indicates that the ensemble of large droplets entrains mainly the gaseous phase (solid particles) whereas the smaller droplets do not induce an important entrainment. It has to be noticed that there is no reason for smaller droplets to have the same velocity as the (small) solid particles. Smaller droplets have their own momentum due to atomization whereas solid particles ‘wait’ for entrainment. Smaller particles have not enough energy to entrain in their wake large gas part.
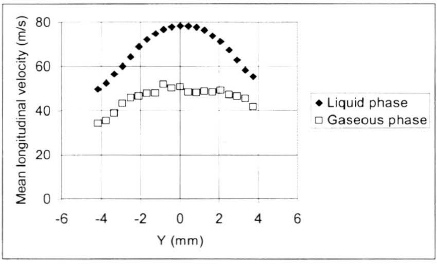
Fig. 19.5 Mean longitudinal velocity for liquid and gas phase at x = 900d

Fig. 19.6 RMS longitudinal velocity fluctuations for liquid and gas phase at x = 900d
19.4 Conclusions
We show here the use of a combined technique allowing, simultaneously, measurements of two phase flow velocity. The main errors for velocity field determination of both phases are those which can be deduced classically from PIV technique applied (this was not the aim to describe them here) on both phases separately. It is clear that the flow studied is complex due to the presence of probable dense liquid part or lack of solid particles seeding the gas phase. The apparatus used here lead to a certain amount of low errors for velocity field measurements which could be obviously removed or decreased with optimal set-up (higher sensitivity of CCD cameras, higher dynamical range, ...). It has to be noted that our application of this visualization technique, due to our set-up, does not discriminate droplet images smaller than 11.5 μm. This is a limitation which doesn't provide a problem for applying the technique to any two phase flow study. In contrast the saturated problem of the largest droplet images could be removed also with optimal apparatus and adequate filters. Here for our first application, this prohibits certainly any gas velocity measurement very close to the largest droplets.
19.5 References
(1) Obokata, T., Hashimoto, T., and Takahashi, H. (1990) LDA analysis of diesel spray and entrainment air flow, Int. Symp. COMODIA 90, pp. 231–236.
(2) Araneo, L., Brunello, G., Coghe, A., and Cossali, G. E. (1998) Entrained gas field produced by a diesel spray impinging on a flat wall, ILASS-Europe Congress, pp. 141–146, Manchester.
(3) Faeth, G. M. (1987) Mixing, transport and combustion in sprays, Prog. Energy Combust. Sci., vol. 13, pp. 293–345.
(4) Zheng, Q. P., and Jasuja, A. K. (1996) Laser sheet imaging of dense gas turbine sprays, C516/044 IMechE.
(5) Boëdec, T., Champoussin, J.-C., and Marie, J.-L. (1998) Experimental study of droplet dispersion from a plain jet atomizer, ILASS-Europe Congress, pp. 334–339, Manchester.
(6) Mohammadi, A., Miwa, K., Ishiyama, T., and Abe, M. (1998) Investigation of droplets and ambient gas interaction in a Diesel spray using a nano-spark photography method, SAE Paper No. 981073.
(7) Kim, J. Y., Chu, J. H., and Lee, S. Y. (1999) Improvement of pattern recognition algorithm for drop size measurement, Atomization and Sprays, Vol. 9, pp. 313–329.
(8) Bachalo, W. D. (1994) Experimental Methods in Multiphase Flows, Int. J. Multiphase Flow, Vol. 20, pp. 261–295.
(9) Georjon, T. (1998) Contribution à l'étude des interactions gouttelettes-gaz dans un écoulement diphasique de type ‘jet diesel’, Thèse de Docteur de l'Ecole Centrale de Lyon, 24 Juin.
(10) Sankar, S. V., Brena De La Rosa, A., Isakovic, A., and Bachalo, W. (1990) A technique for studying mixing in swirl combustors, 5th Int. Symp. on Laser Techniques to Fluid Mechanics, Lisbon.
(11) Kozma, J. M. H. (1996) Air entrainment into a transient diesel spray visualized using particle image velocimetry, Thesis of Master science, University of Wisconsin-Madison.
(12) Yamada, N., Ikeda, Y., and Nakajima, T. (1998) Multi-intensity-layer PIV for spray measurement, 9th Int. Symposium Applications of Laser Techniques to Fluid Mechanics, Lisbon, pp. 12-6-l—12-6-8.
(13) McGregor, S. A. (1991) Air entrainment in spray jets, Int. J. Heat and Fluid Flow, Vol. 12, No. 3, September.
(14) Benatt, F. G. S., and Eisenklam, P. (1969) Gaseous entrainment into axisymmetric liquid sprays, Journal of the Institute of Fuel, pp. 309–315, August.
(15) Briffa, F. E. J. and Dombrowskim, N. (1966) Entrainment of air into a liquid spray, A.I.Ch.E. Journal, Vol. 12, No. 4, pp. 708–717, July.
(16) Boëdec, T. and Simoëns, S. (1999) PIV, PLIF and PMSD combination for description of the velocity fields applied to turbulent mixing of spray and ambient air flows, 3rd Int. Workshop on Particle Image Velocimetry, pp. 139–144, Santa Barbara USA, Sept. 16–18.
(17) Simoëns, S. and Ayrault, M. (1994) Concentration flux measurements of a scalar quantity in turbulent flows, Experiments in fluids, Vol. 16, No. 3–4, pp. 273–281.
(18) Simoëns, S., Ayrault, M., Primon, R., and Verduzzio, G. (1996) Simultaneous velocity and concentration measurements using Mie scattering and particle image velocimetry in a turbulent air jet, Optical Methods and Data Processing in Heat Fluid Flow, in IMechE Conference Transactions, 1996–3 MEP Publications, London, Part. C, pp. 301–308.
(19) Vinçont, J.–Y., Simoë;ns, S., Ayrault, M., and Wallace, J. (2000) Passive scalar dispersion of a line source downstream an obstacle, accepted in Journal of Fluid Mechanics.
(20) Broquet, L., and Simoëns, S. (1995) Mesure du mélange de deux espèces par double fluorescence induite par laser, 6ème Colloque National de Visualisation et de Traitement d'Images en Mécanique des Fluides, Saint-Etienne.
(21) Towers, D. P., Towers, C. E., Buckberry, G. H., and Reeves, M. (1999) A colour PIV system employing fluorescent particles for two phase flow measurements., Meas. Sc. Tec., Vol. 10, pp. 824–830.
(22) Stefanini, J., Cognet, G., Vila, J. C., Merite, B., and Brenier, Y. (1993) A colored method for PIV technique, pp. 247–258, Fluid Mechanics and its applications, Vol. 14, Kluwer Acad. Publish.
(23) Georjon, T., Chalé, H. G., Champoussin, J-C., Marié, J-L., and Lance, M. (1997) On the potentialities of a droplet tagging method to perform LDA discrimination in dense sprays, FEDSM97-3084, ASME Summer Meeting, Vancouver.
(24) Serrat, J. (1982) Image analysis and mathematical morphology, Academic Press.
(25) Simoëns, S. (1992) Applications de l'analyse d'images à des phénomènes de mélange et de dispersion turbulents, Thèse de Doctorat de l'Ecole Centrale de Lyon.
(26) Gonzales, C. and Wintz, P. (1977) Digital Image Processing, Addison-Wesley Publishing company.
T Boëdec and S Simoëns
Laboratoire de Mécanique des Fluides et d'Acoustique, Ecole Centrale de Lyon, Ecully, France
© With Authors 2002