
Section 1 Doppler Anemonmetry
1
Comparison of Injector Sprays for Gasoline Direct-injection Engines
J Allen, J Heath, G Pitcher, G K Hargrave, and G Wigley
Abstract
The spray characteristics of a variety of injectors designed for use in gasoline direct injection engines have been measured using phase Doppler anemometry and high-speed digital imaging techniques in atmospheric and elevated pressure regimes. The interpretation of these results and their application to the design of a direct-injected spark-ignition engine are considered.
1.1 Introduction
Spark ignition gasoline engines equipped with direct injection have already reached the market place, installed in mass produced passenger cars (1). This technology has the potential to deliver fuel economy and emissions benefits. Direct injection fuel systems are evolving along three paths.
- Single fluid – high fuel supply pressure injection.
- Dual fluid – low fuel pressure with air-assisted injection.
- Single fluid – low fuel supply pressure with solenoid assisted injection
As part of Lotus' gasoline direct injection research programme, examples of each of these three types of injectors were assessed using a range of complimentary optical diagnostic techniques. The results from this spray characterization have allowed comparison of the relative merits of these injectors and provided direction for suitable combustion chamber designs and fuelling strategies for each type tested.
1.2 Spray measurement techniques
In conjunction with the Faculty of Engineering at Loughborough University, Lotus has established a series of optical diagnostic rigs to allow the comprehensive measurement and imaging of injector sprays, using gasoline as the test fluid.
High-speed imaging techniques allow visualization of the fuel sprays while phase Doppler anemometry (PDA) techniques have been used to measure droplet velocities and diameters. The facility allows sprays to be imaged and measured in both atmospheric conditions and at elevated pressures.
1.3 Injector spray tests into atmosphere
Four injectors were tested: one air-assisted, two single fluid with high fuel supply pressure, and one single fluid with a low supply pressure and solenoid-assisted injection. These are listed in Table 1.1. The injectors were each tested at four fuel-delivery rates. These fuel loads, and the equivalent operating points for a four-cylinder, 2.2-litre engine, are given in Table 1.2.
Table 1.1 Injector types tested


Images taken of the spray from each injector at fuel load B, using a laser sheet or diffuse xenon flash back lighting for illumination, are shown in Fig. 1.1. These images have been chosen to illustrate the wide range of spray structures found with these injectors. The timing of each image with respect to the start of injection is indicated in the figure.
The type 1 and type 2 single fluid injectors both have a cone shaped spray structure. There is a leading central jet of fuel issued from the type 1 injector before the cone structure has time to form. The high penetration rate of this central part of the spray structure could lead to piston crown or cylinder wall wetting, depending upon the injection timing strategy used. Cylinder wall wetting would be undesirable from both a combustion and lubrication perspective. With the type 2 injector, which is also a single fluid design, there is no central jet of fuel evident.

Fig. 1.1 Spray structure diversity
The air-assist injector has a shaped nozzle extension that has the effect of containing the spray in a plume below the nozzle.
The solenoid in the solenoid injector is used to drive a plunger that pressurizes the fuel. In the nozzle is a sprung poppet valve that is opened by the fuel pressure acting behind it – this ensures that the fuel has reached the required pressure before the valve opens. The amount of fuel injected is determined by the duration of the signal to the solenoid and thus the stroke through which the plunger operates. It can be seen that the fuel appears to leave the injector as thin streams of liquid jets, forming a narrow cone angle.
Imaging of the spray gives useful information on its size, structure, and speed of penetration. To obtain a measurement of the droplet diameters and more detailed velocity data, the phase Doppler anemometry (PDA) measurement technique has been used. As will be seen later, combining these techniques can give a better understanding of the spray than any one of these when used in isolation.
Two fuel loads are presented; load B is 11 mg of fuel per injection event and represents a BMEP value of 2 bar for a 2.2-litre, four-cylinder engine running at 2000 r/min. Load D is 53 mg/injection and represents full-load, peak-torque (with a power enrichment fuelling strategy) in the same engine design. Results from the solenoid injector are not shown for fuel load D since this injector can not deliver the required quantity of fuel in a single injection.
The PDA droplet diameter data recorded for each injector is shown in histogram format in Fig. 1.2. The data presented is both spatially and temporally averaged for the whole spray. It can be seen that the air-assist injector has the largest proportion of small diameter droplets, with a rapid drop in the number of samples measured as the droplet diameter increases. At the opposite end of the range is the type 1 injector which has a far lower number of small droplets. It can also be seen that the increase in fuel load from B to D causes a reduction in the peak of small diameter droplets and a subsequent shift toward the larger sizes.

Fig. 1.2 Droplet size comparison at fuel load B and D
Further analysis of the PDA results yields statistical data. The D10 (arithmetic mean) and the D32 (Sauter mean) droplet diameter, plotted against fuel load for each injector, is shown in Fig. 1.3. The air-assist injector is seen to have the smallest D10 droplet diameter of between 3 and 4.5 μm, depending on the fuel load. The type 2 single fluid injector has a mean droplet size of between 1.5 and 3.5 μm larger than the air-assist, while the solenoid and type 1 injectors produce even larger D10 droplet diameters.

Fig. 1.3 Effect of fuel load on arithmetic mean and Sauter mean droplet diameters
As the fuel load is increased, the air-assist injector shows a rise in D10 droplet diameter of 1.5 μm between 11 mg/injection (load B) and 21 mg/injection (load C). Beyond this, the droplet diameter levels off. The type 2 injector displays a continuing rise in D10 droplet diameter as the fuel load is increased. The type 1 injector also shows a continuing rise in droplet diameter as the fuel load is increased, but to a lesser degree than the type 2 injector. The rise in droplet size from fuel load A (6.5 mg/injection) to load B (11 mg/injection), however, is more pronounced. The solenoid injector shows very little variation in droplet diameter as the fuel load is changed.
The Sauter mean diameter (SMD or D32) is calculated from the ratio of droplet volume to surface area and so represents the ability of the droplets in the spray to vapourize. A high SMD indicates that the fuel spray contains some large droplets and so will not vapourize as readily as a spray with a low SMD value. The SMD is very sensitive to, and increased significantly by, the presence of even a very small percentage of large droplets. For this reason it is essential that the droplet diameter measurement range used with each spray being analysed is consistent.
At low fuel loads the air-assist injector exhibits the lowest SMD seen for all of the test injectors. It can be seen that this rises rapidly as the fuel load is increased from B (11 mg/injection) to C (21 mg/injection), and continues to climb further as the fuel load is increased to D (53 mg/injection). The SMD for the type 2 and type 1 injectors appears to be fairly insensitive to fuel load, while the solenoid injector appears to show a reduction in SMD with increasing fuel load. These results require careful consideration for the reasons given in the following paragraphs.
The change in the PDA D10 droplet diameter as the axial distance from the nozzle is increased is shown for fuel loads B (11 mg/injection) and D (53 mg/injection) in Fig. 1.4. The results given in Figs 1.4 are temporally averaged over the complete injection period and spatially averaged for each of the downstream traverse positions.

Fig. 1.4 Effect of distance from nozzle on D10 droplet diameter (fuel loads B and D)
In Fig. 1.4 the air-assist and type 2 injectors show a consistent mean droplet diameter along the spray axis. The type 1 injector shows an initial rise in D10 droplet diameter up to 20 mm downstream of the nozzle, with a consistent diameter of 8 μm thereafter. The solenoid injector shows a gradual increase in D10 droplet diameter downstream of the nozzle. The simplest mechanisms to explain this are:
- coalescence of droplets;
- complete vapourization of the smallest droplets.
The effects seen can not, however, be due to coalescence. This is because of the drop sparsity found in the sprays. The geometry of the cone structure causes the spray to become even less dense further from the nozzle, making coalescence even less likely.
The vapourization of smaller droplets could cause an increase in the percentage of larger droplets observed, but this would be expected to be apparent in the results measured for the air-assist injector at fuel load B (11 mg/injection). At this condition this injector is extremely effective at atomizing the fuel into droplets of below 2 μm, as shown in Fig. 1.4. Despite the large percentage of droplets of this size, no increase in the measured droplet size was experienced as the distance from the nozzle was increased.
Conversely, it could be argued that the droplet diameter would reduce, not increase, as the spray is measured further from the nozzle, for the following reasons.
- Aerodynamic effects acting on the largest droplets would be expected to break them up into smaller droplets. The Weber number determines the extent to which this happens.
- Droplets further from the nozzle will have had more time for vapourization to occur, therefore would be reduced in size.
The phenomenon of increasing droplet size with increased axial distance is even more pronounced at fuel load D (53 mg/injection). This is seen even with the air-assist and type 2 injectors which didn't exhibit this characteristic at the lower fuel load.
A basic understanding of the PDA measurement method (2), and cross-referencing of the results with images taken of the sprays, is required in order to explain these results. The PDA technique measures the diameters of spherical droplets and their velocities. If the fuel is not in droplet form, the signal processor will reject that data. Images of the type 1 and solenoid injector fuel sprays are shown in Fig. 1.5.

Fig. 1.5 Images of fuel from the type 1 and solenoid injectors showing fuel filaments
Filaments of unatomized fuel are clearly visible in the spray structure. The image of the type 1 spray was taken showing the area between 10 and 20 mm downstream of the nozzle, fuel load D (53 mg/injection), while the image from the solenoid injector shows 0–30 mm downstream at its maximum fuel load of 33 mg/injection. Study of these images in conjunction with the PDA data allows the correct interpretation of these results. As the measurement position is moved axially downstream from the nozzle, more of the fuel that was originally in filament form (and thus not measured by the PDA measurement technique) breaks up into droplets and so can now be measured. This gives the impression of increased droplet diameters further down the spray.
From the work performed in atmospheric conditions, it can be seen that the techniques used for studying the sprays are complimentary. Combining results from high-speed imaging of the sprays and from the PDA measurement technique can give a greater understanding of the spray characteristics than either one of these techniques on its own.
The dual fluid air-assist injector is the most effective at atomizing fuel at the lower fuel loads, but is seen to produce some larger droplets as the fuel load is increased. The type 2 injector is a more effective single fluid atomizer than the type 1, which in turn is more effective than the solenoid injector. As well as their effectiveness at atomizing the fuel, the spray shape and penetration velocity of each of the sprays is important when considering their application in an engine.
1.4 Cylinder pressure effects
The effect of elevated cylinder pressure on spray penetration at fuel load B (11 mg/injection) for the type 1 and air-assist injectors is shown in Fig. 1.6. The tests were performed in a pressurized chamber with fused silica windows for optical access. The chamber was pressurized using nitrogen gas. It can be seen that the general trend is for a more compact spray as the chamber pressure is increased. It is the increased density of the atmosphere in the chamber that causes the fuel droplets to impart their momentum to their surroundings more rapidly.

Fig. 1.6 Effect of pressure: air assist (2.0 ms after SOI) type 1 (1.2 ms after SOI)
With the single fluid type 1 injector the largest effect on the spray envelope was seen as the chamber pressure was increased from 0–6 bar (gauge). Increasing the pressure up to 15 bar appears to have had a lesser effect.
The air-assist injector spray was imaged injecting into chamber pressures of up to 5 bar. At this chamber pressure the pressure drop across the nozzle is reduced to just 1.5 bar. It can be seen that the size of the fuel spray plume at this condition is much reduced. This is due to a combination a lower initial spray velocity and the increased chamber pressure causing the fuel to decelerate more rapidly.
The PDA measurement technique was used in conjunction with the pressure chamber to ascertain the effect on droplet diameter. The results, using the type 1 injector, were taken on the spray centreline, 18 mm downstream of the nozzle and are shown in Fig. 1.7. It can be seen that the spread of droplet diameters widens as the chamber pressure is increased, reducing the concentration of small diameter droplets.
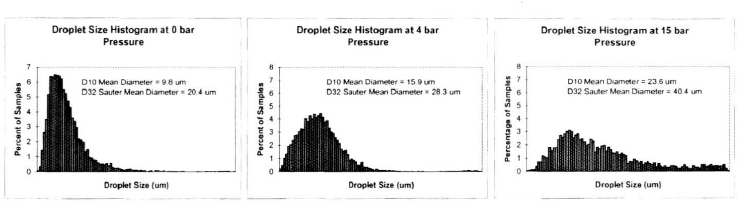
Fig. 1.7 Effect of cylinder pressure on droplet size, type 1 injector, spray centreline, 18 mm downstream
1.5 Application to combustion chamber design
Results from the spray analysis have allowed consideration of the application of each injector type into combustion chamber designs and the fuelling strategies that will need to be employed.
Delivering the fuel to the spark plug at the correct time during the cycle is essential when operating under stratified conditions. In-cylinder air motion, such as tumble or swirl, can be used to do this. Piston crown shape can also be used to influence the air (and thus fuel) motion (3). Alternatively, with a finely atomized fuel spray, the fuel can be aimed directly at the spark plug (without risk of plug fouling) and the injection timing used to ensure a stratified mixture is delivered at the correct time, thus minimizing surface wetting and a possible source of hydrocarbon emissions. This latter system is preferred by Orbital using their dual-fluid injector (4).
The injection timing strategy used with each injector to achieve stratified operation is dependent upon the pressure drop across the nozzle, the spray penetration rate, the spray envelope, and the dropsize distribution. It has been reported that droplet size is the factor limiting how late into the compression stroke injection can continue, while still leaving time for the fuel to vapourize (5). Therefore, a low-pressure air-assist system with good spray atomization, despite the lower pressure drop across the nozzle, may be suited to injection later into the compression stroke than a high-pressure single fluid system with less effective atomization.
When selecting a injector for our own direct-injection research and demonstration engine, our choice was influenced by the air-assist injector's ability to produce a well contained and finely atomized spray. Its requirement for a low pressure fuel and air system could also lead to a faster implementation. On these grounds a packaging study of the air-assist injector into a contemporary 1.8-litre, four-cylinder, sixteen-valve engine has been undertaken.
An issue with stratified operation is the exhaust after-treatment system. Conventional catalytic converters require the engine to run at stoichiometric air–fuel ratios. When running with very lean stratified mixtures, the conversion of the oxides of nitrogen in the exhaust gases can be poor, especially when operating on European specification fuels which have a high sulphur content. Work in the field of exhaust after-treatment of lean burn engines is still ongoing, and for this reason the decision was made to implement a direct-injection scheme using homogeneous charge at stoichiometric air–fuel ratios.
The aim of the conversion to direct injection has been to produce a homogeneously charged engine with minimal changes to the cylinder head and port architecture. This will allow investigation into the effects on volumetric efficiency and transient fuelling and emissions control. Two concepts were studied that would allow these criteria to be met; these were central and side injector positions. A number of central injector schemes were considered to address the issue of packaging both the injector and spark plug. The final design concept chosen was a side injection scheme using injectors with an 80 degree cone angle. The injectors were mounted under the (unmodified) intake ports. The angle of installation of the injector was constrained by the inlet ports, head gasket sealing faces, and clearance to the piston at TDC.
The PDA data from the 80 degree cone angle injectors were processed and put into an animated vector file. These vectors were then superimposed on to a schematic of the combustion chamber to show the sort of interaction that could be expected between the spray with the physical boundaries of the combustion chamber and piston. Frames from this animation, showing an engine running at 2000 r/min with fuelling to produce a brake mean effective pressure (BMEP) of 2 bar, can be seen in Fig. 1.8.


Fig. 1.8 Frames from PDA animation showing droplet velocities and sizes
The injection event is timed to avoid the fuel contacting the piston, while still occurring early enough in the intake stroke to allow thorough mixing for a homogeneous mixture preparation. Fuel is first seen 5 mm below the nozzle at 7.25 ms after top dead centre (ATDC) on the induction stroke; this equates to 87 crank angle degrees. The final timing of injection events will be decided from the results of a series of calibration experiments being undertaken on the test engine. It can be seen that the shape of the nozzle keeps the fuel spray contained, preventing it from wetting the combustion chamber roof and spark plug. Some intake valve wetting will occur (these are not shown on the model), although it is envisaged that the air flow across the valves will keep this to a minimum. At the end of injection (12.35 ms ATDC), the fuel has reached the far side of the combustion chamber and could cause wall wetting and bore washing. Study of the corresponding droplet sizes shows these to be below 2 μm in diameter and so these would be expected to have vapourized before penetrating this far in a running engine.
The engine has been built, installed on a dynamometer and is currently undergoing testing. At the time of writing the test programme has not yet been completed, although initial brake specific fuel consumption and emissions results are encouraging.
1.6 Conclusions
Optical diagnostic techniques have been used to characterize the sprays from a variety of gasoline direct injector designs. The measurement techniques used have been found to be complimentary and have led to a greater understanding of the processes involved than any technique used in isolation.
Imaging techniques have allowed the sprays' envelopes to be defined in atmospheric and elevated pressure conditions.
The spray measurements have shown the air-assist injector to produce the smallest arithmetic mean droplet diameters of all the injectors tested, with diameters of between 3 and 4.5 μm, dependent upon fuel load. The type 2 injector is the most effective single fluid atomizer, producing droplets of between 4.5 and 8 μm mean diameter, 1.5–3 μm smaller than those from the type 1 injector. The solenoid injector appears to produce similar mean droplet diameters to those from the type 1 injector, although closer study of the results indicates that a large proportion of the fuel may be in filament, not droplet, form.
The PDA measurement results will enable the effect of droplet size and velocity to be ascertained on the performance of engines utilizing direct injection of gasoline. Use of the PDA technique in conjunction with Lotus' optically accessed engine will also allow validation of in-cylinder airflow and spray models.
The results from the measurement of the fuel sprays have been used to package direct injectors into the cylinder head of a contemporary 1.8-litre, sixteen-valve, four-cylinder engine.
References
(1) Iwamoto, Y., Noma, K., Nakayama, T., Yamauchi, T., and Ando, H. Development of a Gasoline Direct Injection Engine, SAE International Congress and Exposition, Detroit, 1997. SAE Paper Number 970541
(2) Wigley, G., Hargrave, G., and Heath, J. A High Power, High Resolution LDA/PDA System Applied to Gasoline Direct Injector Sprays, Particle and Particle System Characterisation, vol. 16. Wiley-VCH, 1999.
(3) Lake, T., Stokes, J., Whitaker, P., and Crump, J. Comparison of Direct Injection Gasoline Combustion Systems, SAE International Congress and Exposition, Detroit, 1998. SAE Paper Number 980154.
(4) Houston, R. and Cathcart, G. Combustion and Emission Characteristics of Orbital's Combustion Process Applied to Multicylinder Automotive Direct Injected 4-Stroke Engines, SAE International Congress and Exposition, Detroit, 1998. SAE Paper Number 980153
(5) Dodge, L. G. Fuel Preparation Requirements for Direct-Injected Spark-Ignition Engines, SAE International Congress and Exposition, Detroit, 1996. SAE Paper Number 962015
J Allen, J Heath, and G Pitcher
Lotus Engineering, Hethel, Norwich, UK
G K Hargrave and G Wigley
Loughborough University, UK
© With Authors 2002