
How Does a Business Plan the Supply Chain?
Introduction to Supply Chain Planning
A business can be profitable—with a strong return on investments—yet still might not consistently generate cash. It is cash—not earnings—that reduces debt, and a business without sufficient cash will ultimately go bankrupt. Management’s principal focus should be on growing a business’s profits and cash flow as a primary driver for creating shareholder value, as seen in the chart (Figure 2.1).

Figure 2.1 Shareholder value added
Freed-up cash can be used for the following:
•Increasing growth opportunities
•Expansions into adjacent and other industries
•Mergers and acquisitions (M&A)
•Research and development (R&D)
•Retiring debt
•Shareholder dividends.
Finance’s Role in Supply Chain Design—Accounting for It All
Cash management is imperative for the survival of a company, and that means that aggressively managing the speed and agility of the cash-to-cash cycle* by managing end-to-end cycle time is a key driver for cash performance.
The finance team understands the cash priorities of the business, protects the company from unethical and illegal behavior, uniformly applies accounts to produce a P&L, and protects transparency for accurate reporting, as seen in the below figure.

During the recession of 2000, many companies developed collaborative relationships between finance and the supply chain. This relationship was further extended with increasing globalization by ensuring the business had improved cash management, flexible trade terms, and the ability to secure funds from trusted resources around the world. Finance’s role is to create a cadence for the reporting progress. This is established at the outset, with the objective of reporting on each part of the supply chain by bringing parties to the table. In addition, finance leads the way by ending the games played between department and functions, as well as by clearly laying out the entire supply chain performance.
So where does this all show up? The cost of the supply chain shows up on both the balance sheet and income statement (or P&L).
Inventory Is a Line Item on the Balance Sheet

The ideal business maintains no unnecessary inventory, responds to changes in the marketplace, and supplies the required products in a timely manner. Avoid the inventory conspiracy!
Contrary to popular myth, inventory is located throughout the entire business, not just in a manufacturing facility or a distribution center. By managing cycle time, a business brings together all of its processes—from customer service to delivery—to direct how its cash is consumed (Figure 2.2).

Figure 2.2 The inventory conspiracy

The cost of carrying inventory is what a business incurs over a period of time to hold and store its inventory. There are four main components to inventory-carrying cost: capital cost, storage space cost, inventory service cost, and inventory risk cost. It is described as a percentage of the inventory value, which includes taxes, employee costs, depreciation, and the cost of insurance. Averages for the components are estimated as follows:
Item |
Percentage |
|
Cost of money |
4 |
|
Taxes |
3 |
|
Insurance |
2 |
|
Warehouse |
3 |
|
Materials handling |
3 |
|
Inventory control |
3 |
|
Obsolescence |
4 |
|
Damage and shrinkage |
3 |
|
Total |
25 |
Comparing year-over-year (YOY) profit and loss (P&L) activities provides the basic forensics a business uses to determine the true cost of its operations. From here, a deeper dive can be made to understand the dynamics at play. Regularly keeping the supply chain accountable for the agreed-upon activities drives the right behaviors for meeting a business’s goals. Accounting for the cost of the supply chain needn’t be a chilling proposition.
What Is the Supply Chain?
A supply chain is the flow of information, goods, and cash. It encompasses controlling of all functions related to the flow of materials, from a company’s suppliers to its customers, including purchasing, traffic, production and inventory control, manufacturing, warehousing, and shipping.
Figure 2.3 illustrates the cash-to-cash cycle or the process from when an order is taken until cash is paid for the service or merchandise. Most of the time, supply chains grow around product growth, with little focus on optimizing how they actually work. As a result, they become multifaceted and expensive.

Figure 2.3 The cash-to-cash cycle in the supply chain
Supply chains typically respond to the marketplace. Issues as simple as different countries having different power plugs for electricity or as complex as trade regulations can have an impact on the P&L. Entrepreneurs can have brilliant ideas, but a lack of proper execution costs the vital resources of time, money, and human capital (which many simply can’t afford).
So how does a business go about planning and executing this complicated equation without killing the spirit and flexibility that created its success to begin with? The answer is through our equation of people, process, and tools.
Designing the Right Process for the Business

Optimizing a supply chain design is about positioning resources in ways that enhance profitability, cash, and working capital while producing tangible shareholder value, as illustrated above. Customer, supplier, and manufacturing strategies—as well as world events—all play into how well a company responds to changes in the marketplace, to reach the “sweet spot.”

To achieve success and ensure that it runs fast, smart, and lean, the supply chain must manage six critical elements:
1.People—you must have a team on the field to play the game
2.Planning—the management of demand and supply is essential to meeting a business’s goals:
•Financial objectives
•Customer expectations
•Supplier needs
3.Operations—a continuous flow of goods from order to delivery
4.Finance—ensuring that what’s been agreed upon is properly executed and accounted for
5.Quality—only factory-fresh quality is delivered, on time and defect free
6.Technology—using the right amount to attain the agreed-upon mission.
The primary goal in designing a supply chain is to make sure that it is aligned with the business strategy. At the same time, it should also reduce complexity and decrease cycle time for all products and services.
The important questions to ask when defining requirements are as follows:
•Is there alignment within the business’s strategy as well as its mission?
•What are the capabilities of the organization?
•What customer service levels are required to meet demand?
•Where should production/distribution be done and who should do it?
•What are the appropriate inventory levels and where should they be maintained?
•Cost: budgeted versus actual?
•Are there any socioeconomic issues?
•What risk is the business willing to withstand?
A business can fail either because of a lack of strategic fit or a failure to provide the resources needed to support the strategy. It must be designed to fit both customer and product needs: It cannot be all things to all people and expect to survive.
Choosing the Appropriate Tool
When it comes to supply chain design, the architecture for an operation is often an exercise in mathematics. With today’s complex flows, more analysis is required to keep things simple. The following tools can be applied to operations of any size—small, medium, or large.
Mapping is an excellent method for understanding the physical, communication, and cash flow components of a supply chain. It is a simple linear process combined with volumes and resources required to produce a product. Areas to be studied and understood are as follows:
•Timing of information flows
•Supplier and customer lead times
•Supplier cost structures—cost versus time and inventory
•Manufacturing setup and execution times
•Choice and cost of logistics mode selection.
Determining where a process starts and where it stops is critical to building a proper value stream map. Once identified, improvements for each of these areas can be translated into action plans. A completed value stream map (above) tells the story of a series of activities and identifies waste and opportunities to improve the end-to-end process. From here, the business can determine its best path forward for making improvements.
When a company designs its supply chain, it needs to take into account all elements, including customers, markets, labor, volumes, and governmental incentives. Once these elements are understood, it is possible to create a model that gives the business more insight into the choices that they make. Analysts can run these powerful tools, with most data being able to be retrieved out of a business’s system.
Total Acquisition Cost
An effective method of managing overall cost is by applying a total acquisition cost (TAC)* model. This tool helps in measuring the cost per unit of acquiring material, as well as developing the cost as a percentage of sales. This allows a business to equalize the YOY volume and mix changes.

Insource versus Outsource Decision Matrix
Decisions for insourcing versus outsourcing are determined by a business’s leadership. Since this can often be a contentious conversation, a decision matrix can be employed to drive a fact-based dialogue rather than having an emotional discussion. A business would never want to give away its “secret sauce” by outsourcing it; still, whatever is not a core competency should be continually reviewed to determine if it adds value. Some of the considerations are as follows:
•With limited resources, is this where a business wants to focus its time, money, and manpower?
•What customer service levels are required to meet the needs of the market?
•How much control and flexibility does the business need?
•Does the business have the skills to manage an outsourced partner?
•What is the total cost and return of investment (ROI) needed to meet the financial goals?
The following matrix (Figure 2.4) is used to help a business determine whether it should keep a perceived core competency insourced or whether it should be outsourced. The questions are very simple, but the matrix furthers leadership’s understanding of a very complex situation.

Figure 2.4 Insource versus outsource matrix
Labor Analysis by Region/Country
A basic understanding of the cost of labor is a fundamental building block of supply chain design. For a business with operations spanning regions and borders, grasping the true cost of an employee (wages + benefits) is imperative in meeting the financial goals. Illustrated as follows is a graphic of how to analyze labor cost by country (Figure 2.5).

Figure 2.5 Average regional direct labor
Coupling this together with a TAC model can provide a very impactful tool for decision-making.
Other Factors to Consider in Supply Chain Design
We’ve covered some of the fundamental tools that a business should use for designing the supply chain. By no means is this meant to minimize the other factors that must be taken into consideration. Here are some of the other critical items to be accounted for as a supply chain grows:
•Marketing—build them where you sell them
•Product lifecycle
•Response time
•Local infrastructure
•Hidden factory cost
•Taxes and tariffs
•Exchange rates
•Political and regulatory requirements
•Potential for corruption
•Competition
•Risk.
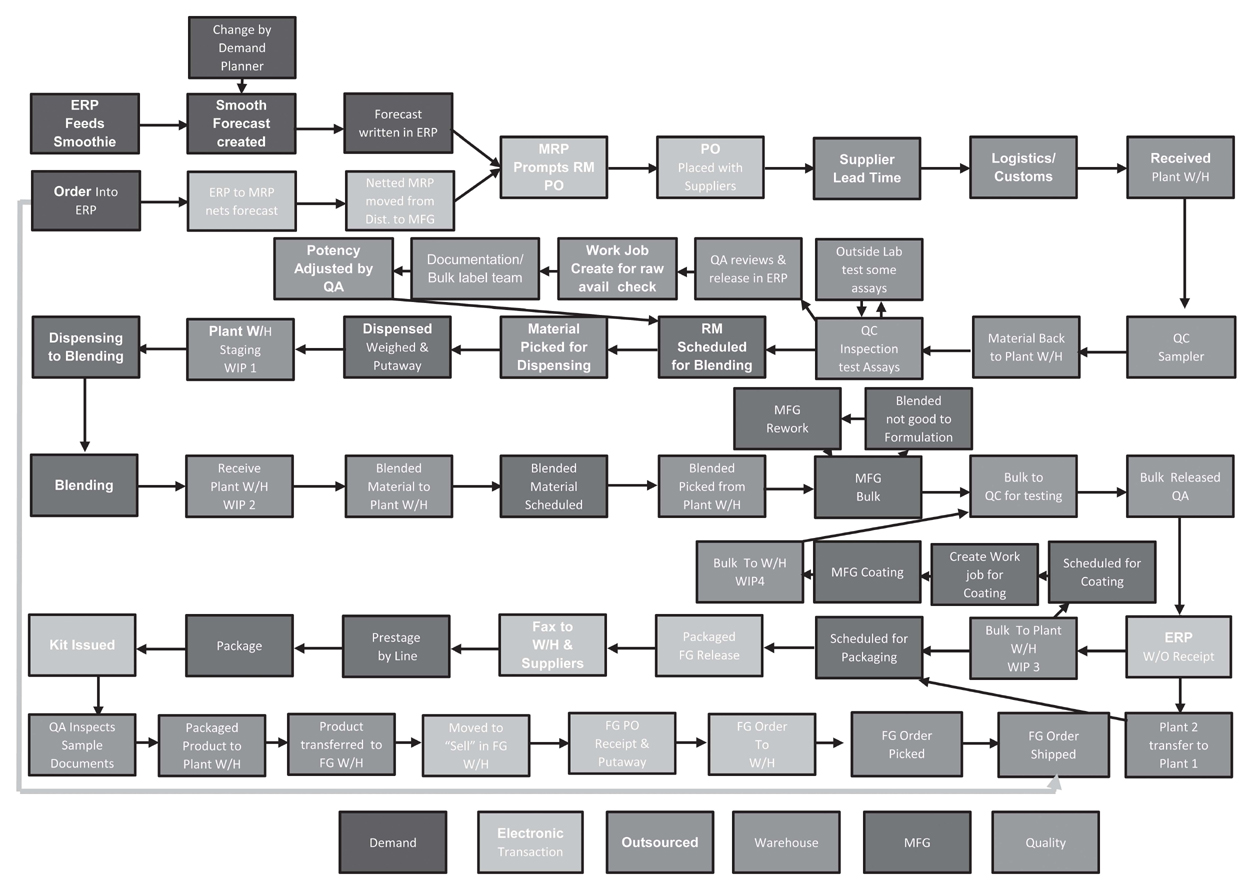
The Supply Chain of a Vitamin
I was asked to help a mid-sized manufacturer of vitamins and supplements to better understand their supply chain. I taught them how to map out the global flow of raw material, work-in-progress (WIP), and finished goods in order to identify where their materials and processes were stagnating. Once we were able to discern the DNA of the company, it was relatively easy for us to improve with an end result of improved cash flow and customer service.
For raw materials we studied the ingredient glucosamine, but we could have studied any item, as they all typically followed a similar path. By methodically walking our way through the different systems, sourcing strategies, and logistics, we were able to simplify the process and develop a plan that eliminated three weeks of waste. The improvements we made also enabled a greater level of scheduling of both QC/QA and manufacturing, which translated into a higher rate of customer satisfaction while reducing working capital by $300,000.
By analyzing the way this business went to market, we were able to make significant changes that reduced working capital by over $1 million while improving delivery, quality, and expiry. This quick hit improved cash flow, which immediately went to the bottom line or was used for other obligations.
Mapping the supply chain can produce immediate and sustained cash benefits. By analyzing the process from order to delivery, you can gain a greater understanding of where value is gained and where it is lost. Real cash savings are within range.


By walking through the whole supply chain, from order to delivery, one can understand the following:
•How customer orders are received, processed, scheduled, and shipped
•Where value is added and where it is taken away
•How lead times, inventory, and transportation impact working capital
•How new product introductions (NPI) impact cash flow
•What opportunities exist for rapid improvement.
Raw Material Flows into Manufacturing

Glucosamine is used in over 250 finished goods, with $9.0 million in inventory for finished goods. A one-week reduction in lead time was worth $497 K. Total lead time varied from 110 days to 162 days with an average of 127 days.
By using the bills-of-materials and sales history, the total demand for glucosamine was determined to have a very stable pattern with low variability. Other facts to note included the following:
•Glucosamine originates from Qingdao, China
•In 2015, 23 purchase orders (PO) were issued totaling 460,000 kg for $5.2 million
•One week of glucosamine raw material was worth $100,000
•A 20-foot marine container from Qingdao carries 18,000 kg
•Materials Resource Planning (MRP) made changes on at least 15 of 23 POs
•With all of the push-out/pull-in done, only one day was gained
•Service levels for finished goods were well below standards
•Loss of glucosamine in the manufacturing was estimated to be >10 percent
•Quality typically performed their testing for glucosamine on Wednesdays.
Observations:
•The supplier controlled the routes and shipping schedules
•Actual supplier lead times ranged from 40 to 92 days, with an average of 65.5 days
•A 16-day vessel sailing from Qingdao to Vancouver was available but seldom used
•By analyzing freight bills, transportation was identified as a profit center for the supplier
•Quality tested glucosamine on Wednesdays; therefore, if a container arrived prior to Wednesday QC could schedule accordingly and eliminate seven days of queue time
•Loss of material in the manufacturing process could be traced back to tier 2 suppliers
•Enhanced scheduling could decrease cycle time by two to three weeks, which could improve service levels and the cash-to-cash performance.
Next Steps:
•Ship one 20-foot container every other week
•Move shipments to the 16-day transit vessel
•Standardize optimal quality-testing day based on container arrival in Vancouver
•Develop root cause for loss of material and take corrective action with supplier
•Right-size glucosamine inventory based on new cycle times (Figure 2.6).

Figure 2.6 Glucosamine cycle time
Finished Goods Flow from Canada to Australia

Order fulfillment for Australian customers ranged between four and six months. All products were forecasted; however, the process was continually second-guessed. In 2015, the inventories in the system of record became out of balance due to personnel changes; thus, extensive expediting was required to fill customer backorders.
Other facts to note included the following:
•One day of working capital was valued at $12,500
•Chief variance between Canadian and Australian products was that Australian health regulations require a redundant quality check of raw material
•Neither active nor passive temperature controls are used in the shipping process; therefore, spoilage and damage occurred during transport
•When product is expedited, air is utilized to correct slow response times
•Ocean lead times = 30 days/Air lead times = 5 days
•New products for this customer were difficult to schedule and produce on time, largely due to a lack of coordination of artwork and product timing.
The recommended future state of Australian supply chain (see Figure 2.7) was:

Figure 2.7 Australian customer-facing supply chain
•Move active Australian stock-keeping units (SKUs) from forecast to master production scheduling (MPS)* process in order to smooth out procurement, factory scheduling, and manufacturing process times
•For NPI, after six months of production, transfer into MPS process
•Ship finished goods direct to Sydney every eight days
•Reduce inventory levels to match 85 day/$1 million working capital for cycle time decreases
•Investigate the effects of in-transit active versus passive temperature controls to determine if there are value-added benefits to customers.
Final Thoughts on Supply Chain Design
Designing the supply chain can be difficult. Complexity drives variability, which directly affects cash flow.
•Drive the process from a business strategy deployment with ownership by the leadership team
•Identify all critical value streams (key products or product families) and perform a baseline analysis of end-to-end cycle time for each of these critical streams
•Integrate cycle time results into the planning process, with gains linked to inventory, delivery, and quality improvements
•Finally, track it all on the P&L to ensure the results hit the bottom line.
Taking the nervousness and uncertainty out of the supply chain empowers people to make further enhancements. Inventory can be reduced by making flows simple, clear, and streamlined with no investment in expensive software packages or adding new people.