
Building a Productivity Machine

Kaizen (or continuous improvement) is multiple baby steps that add up to great big steps. Each day should be about continuous learning and improving. A business’s leadership needs to set the expectation that all employees think about process improvement as part of their daily work routine. A continuous improvement organization should:
•Integrate lean principles
•Anticipate the future
•Reduce cost
•Eliminate waste
•Create a learning experience for all.
Ultimately, Kaizen is about job ownership. It entails giving employee’s full responsibility and accountability for their jobs. By taking charge of turning out products that are desired by customers, employees receive the authority to modify and shape their work in ways that improve quality and enhance productivity.
Building a productivity machine and improving cycle time isn’t difficult, but it does take time, energy, and collaboration from the entire enterprise. Everyone within the organization needs to be fully engaged and in agreement. This starts in the boardroom and flows down through all people, processes, and tools.
Seeing a problem firsthand allows the team to identify situations requiring improvement and to create a statement that describes the Who, What, When, Where, and Why of the problem. From there, a team is gathered to:
•Analyze and brainstorm the potential cause of the problem
•Shape the potential cause by developing a Fishbone diagram
•Select the most likely cause of the problem
•Collect data and use Pareto charts to determine the cause
•Use the 5 Whys to find the root cause of the problem
•Develop corrective action for each root cause.
Additional points to keep in mind are:
•Safety and quality are always preconditions
•Kaizen (or improvement) only comes from necessity
•The ideal condition is always pursued
•Genchi Genbutsu, Gemba, or Go and See for yourself
•Concept follows actions
•Kaizen requires speed rather than perfection
•Do work Kaizen rather than machine Kaizen.
With this grounding, problem-solving becomes easier for a team to accomplish.

Source: Out of the Crisis
W. Edwards Deming (1900–1993) was an American statistician, educator, and consultant whose advocacy of quality-control methods in manufacturing and production aided Japan’s economic recovery after World War II and spurred the subsequent global success of many Japanese firms in the late twentieth century.
Dr. Deming taught that waste needs to be removed from every activity or task by grasping how the core processes function. Other instructions included:
•Remove barriers that make it impossible for workers to do their job
•Leaders must know the process they supervise
•Process, Process, Process
•Supervision on a plant floor is not an entry-level position
•Barriers must be broken down, with fear driven from the business.
Furthermore, using the Deming Wheel (see the figure), or the plan-do-check-act (PDCA) process, doesn’t make problems go away: It provides a better focus on how to solve them.

•Define the scope, which includes the vision and case for change
•Prepare a baseline, including a gap analysis and initial timeline
•Ensure leadership support for the project
•Align metrics, rewards, and recognition.
Do
•Lead a value stream mapping (VSM) exercise for the end-to-end process
•Launch improvement
•Drive standardized work with accountability
•Implement a management review process.
Check
•Assess for results
•Refresh baseline.
Act
•Develop corrective actions to address gaps.
Finally, Deming’s 14 Points on Quality Management1 is a core concept for implementing total quality management and is a set of management practices to help companies increase their productivity. The 14 points are:
1.Create constancy of purpose toward improvement
2.Adopt the new philosophy
3.Cease dependence on inspection
4.Move toward a single supplier for any one item
5.Improve constantly and forever
6.Institute training on the job
7.Institute leadership
8.Drive out fear
9.Break down barriers between departments
10.Eliminate slogans
11.Eliminate management by objectives
12.Remove barriers to pride of workmanship
13.Institute education and self-improvement
14.The transformation is everyone’s job.
Assembling the Team
When building a problem-solving or productivity team, the best performers must be involved and enthusiastic. Ideally, this is not an assignment of dread; rather, it should be viewed as an opportunity to help build the company into a healthier and stronger business.
The CEO is unquestionably the spiritual team leader, and he also has very real obligations to investors, shareholders, customers, and the community that pull on their time. This means that the team needs a strong person granted authority to wander through every part of the company. This is typically the senior finance leader. They have the power and knowledge, as well as the ability to draw on the necessary financials to develop baselines and execute a scorecard for the process.
A cross-functional team of experts should be organized to examine customer care (or order management), sourcing, manufacturing, and logistics. In the health care, nutritional, or pharmaceutical industries, it is also important to include product quality as a key team member.
The team needs to be small and agile and have the ability to move quickly through the business, processes, and geography so that the bureaucracy has difficulty keeping up with their activities and progress. Assignments given to each function need to be completed on time, with any blockage—be it employee, supplier, or constraint—identified and positively resolved. No victims are allowed; instead, celebrating success and having fun should be a constant. It is inspiring to watch the progress and see the results in the monthly financials.
Problem-Solving Tools
A-3

In writing in the A3 format (see figure above), the author should tell a story on paper. The document should guide you down a path and present only statistically based facts. Furthermore, the “Deming Wheel”—plan-do-check-act (or PDCA) should always be followed, thereby eliminating emotions and subjectivity. This is a shorthand way of presenting complex ideas in a concise and objective manner.
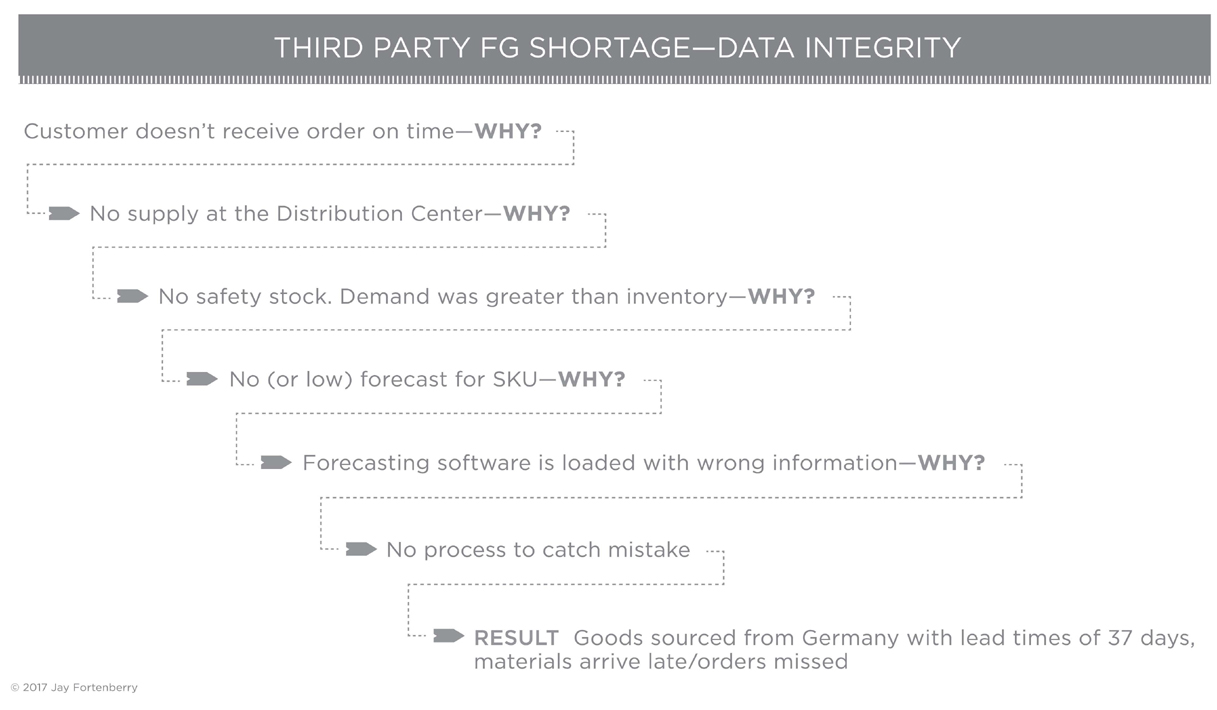
The 5 Whys—Getting to the Root Cause Quickly
The 5 Whys technique is remarkably simple: When a problem occurs, you drill down to its root cause by asking “Why?” five times. Then, when a countermeasure becomes apparent, you follow it through to prevent the issue from recurring. A good example of this technique is illustrated below:
There are seven basic tools used for problem-solving. These are:
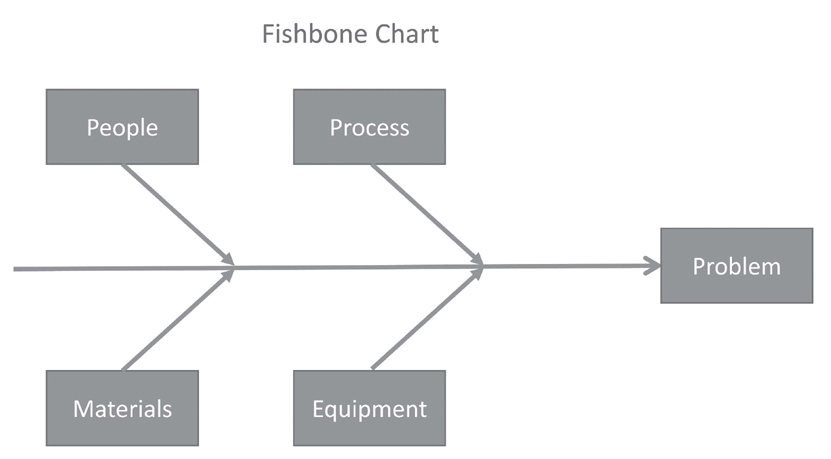
•Cause and effect diagram—Fishbone chart
When utilizing a team approach to problem-solving, there are often many opinions as to the problem’s root cause. One way to capture these different ideas and stimulate brainstorming on root causes is the cause and effect diagram, commonly called a fishbone chart (see figure). The fishbone chart will help to visually display the many potential causes for a specific problem or effect. It is particularly useful in a group setting and for situations in which little quantitative data are available for analysis.
•Flowchart or Process Flow Diagram
Flowcharting or mapping is a method used to understand the physical and communication flows in a process. It is a simple linear process combined with volumes and resources required to produce a product. Areas to be studied and understood are:
oCost versus time and inventory model
oTiming of information flows
oSupplier lead times/supplier cost structures
oManufacturing setup and execution times
oChoice and cost of logistics mode selection.
Determining where a process starts and where it stops is critical to building a proper map. Once identified, improvements for each of these areas can be translated into action plans. A completed map (see figure) tells the story of a series of activities and identifies waste and opportunities to improve the end-to-end process.

•Pareto Charts
A Pareto chart, named after Vilfredo Pareto,2 is a type of chart that contains both bars and a line graph in which individual values are represented in descending order by bars and the cumulative total is represented by the line. The purpose of a Pareto chart is to focus efforts on problems that offer the greatest potential for improvement by illustrating their frequency or size in a descending order.

•Run Charts
A run chart is a line graph of data plotted over time. By collecting and charting data over time you can find trends or patterns in the process. Because they do not use control limits, run charts cannot tell you if a process is stable, as seen below.

•Histograms
A histogram (below) is a graphical representation of the distribution of numerical data. It is an estimate of the probability distribution of a continuous variable (quantitative variable) and was first introduced by Karl Pearson. A histogram is used to summarize data from a process that has been collected over a period of time.

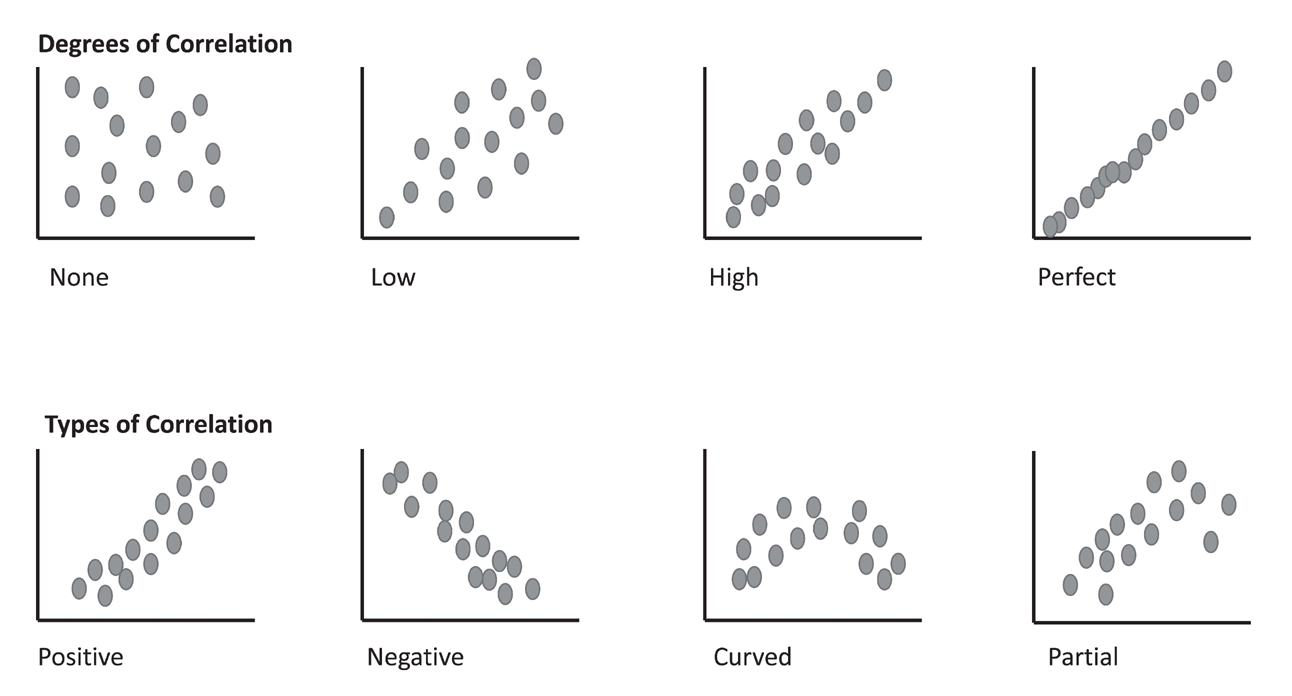
•Scatter Diagrams
The scatter diagram is known by many names, including scatter plot, scatter graph, and correlation chart. This diagram is drawn with two variables; usually the first variable is independent, and the second variable is dependent on the first variable. It is used to study and identify the possible relationships between the changes observed and in two different sets of variables.
•Control Charts
The control chart is a graph used to study how a process changes over time. Data points are plotted in time order. A control chart always has a central line for the average, an upper line for the upper control limit, and a lower line for the lower control limit. A control chart is used to monitor, control, and improve process performance over time by understanding variation and its source.

Other tools include:
oGantt chart
oAffinity diagrams
oCheck sheets
oForce field analysis
oMatrix diagrams
oPrioritization matrices
oRadar charts
oTree diagrams.
Final Thoughts on Problem-Solving
After moving to Toyota, I became fully immersed in the art of problem-solving and productivity. The recipe I created was to:
•Develop a standard approach, but adapt for each line of business
•Understand and analyze all of the components of a problem
•Pursue improvements based on effort and impact
•Link improvements to performance
•Perform continuous improvement.
The final two points, linking improvements to performance and performing continuous improvement, are crucial and are ignored at an organization’s peril.
________________
1“Dr. Deming’s 14 Points for Management.” The Deming Institute. https://deming.org/explore/fourteen-points
2Vilfredo Pareto (born July 15, 1848—died August 19, 1923), an Italian economist and sociologist who is known for his theory on mass and elite interaction as well as for his application of mathematics to economic analysis. See https://www.britannica.com/biography/Vilfredo-Pareto