
Chapter 16
Parallelizing Legacy Code
What's in This Chapter?
Introducing the Dhrystone benchmark
Parallelizing the C version
Parallelizing the C++ version
One of the biggest challenges programmers face is making existing code parallel. The older and bigger the code, the more difficult the task is. Successful parallelism should lead to improved performance and scalability without having to make wholesale changes to the code.
Legacy code represents the huge investment of time and effort that programmers have made. For most programmers, maintaining and modifying legacy code is a significant headache, because it often includes the following characteristics:
- Large, monolithic code base
- Unknown or misunderstood content
- Old-style programming
- Ubiquitous use of global variables
This case study begins by introducing the Dhrystone benchmark, and then explores adding parallelism to the code using OpenMP and Cilk Plus. The hands-on activities give you an opportunity to try out the different approaches. You explore the following ways of addingparallelism to the benchmark:
- Synchronizing shared variable access
- Duplicating global variables
- Wrapping the application in a C++ class
- Using Cilk Plus holders
Taking the original serial version of the Dhrystone benchmark, the first three attempts at parallelization use OpenMP, and the last attempt uses Cilk Plus. In all these attempts, the following questions are addressed:
- Will adding parallelism improve the performance of the code?
- Can the parallelism be added without too much programming effort?
Introducing the Dhrystone Benchmark
The Dhrystone benchmark is a typical example of code written in the 1980s, with versions available in C, Pascal, and Ada. Its intention was to reflect good programming practices of the day, and was designed to be an easy-to-use integer benchmark that could be used to compare the performance of different CPUs and compilers.
When I first attempted to make the benchmark parallel, I spent a lot of time studying the code to understand what it was doing. Thankfully, the intentions of the author are well documented in several white papers. The benchmark itself also includes five pages of notes in the source code. In this respect, the benchmark is not typical of code that you might have to work on.
The benchmark uses old-style K&R programming, with its obsolete calling convention, lack of function prototypes, and missing return types in the function definitions. K&R C is so called after the 1978 edition of The C Programming Language, by Brian Kernighan and Dennis Ritchie. Even though the language has been superseded by ANSI C, many compilers, including the Intel compiler, can still support K&R C code. Part of this case study involves using C++ files rather than C files, which meant much of the quirkiness of the K&R-style coding had to be attended to before the code could be compiled successfully.
The Structure of the Code
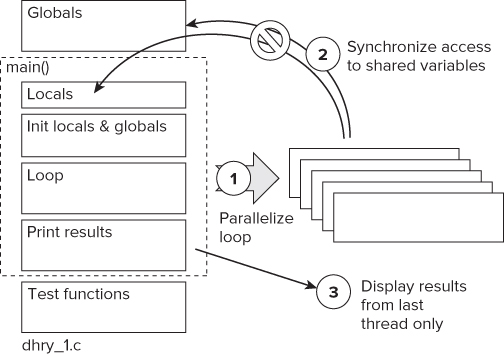
The Dhrystone benchmark code is not huge; it is split among 12 functions over two files (see Figure 16.1). The main file, dhry_1.c, consists of a number of global variables, the main() function, and a collection of test routines. The second file, dhry_2.c, has a number of test functions that are called from within the test loop of main(). Each iteration of the loop is classed as one Dhrystone. Any code executed outside of the loop does not contribute to the benchmark results.
Figure 16.1 The structure of the Dhrystone benchmark
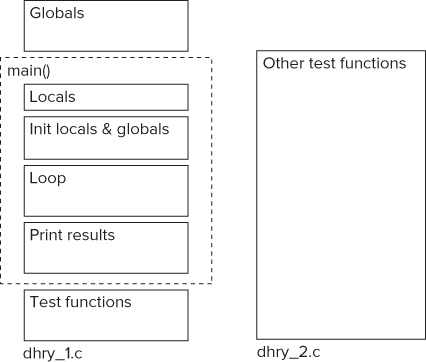
After the benchmark runs, the results are printed to the screen. The main reason for including the print routines is not to verify the results — that is a secondary requirement. The real reason for adding this code is to make sure that the results of the benchmark are used. If the results were not used, there would be a danger that the optimization phase of the compiler would see the benchmark as being “unused” or “dead” code and proceed to optimize it away.
Global and Shared Variables
The benchmark has a mixture of global and local variables. Within the main() function there is a central for loop that will become the target of the parallelization effort. As shown in Figure 16.1, both global and local variables are declared outside this loop. This means that all these variables will be shared between the parallelized loop and possibly lead to data races. These shared variables will become the biggest problem to overcome.
The /Qdiag-enable:thread Intel compiler option produces threading-related diagnostic messages, including information about global variables. The compiler reports that 12 global variables are accessed more than 50 times (see Table 16.1). Access to these variables and the shared local variables will need to be protected so that only one thread can access them at any one time.
Table 16.1 Global Variables Reported by /Qdiag-enable:thread
| Variable | Number of Times Accessed |
| Arr_2_Glob | 2 |
| Begin_Time | 2 |
| Bool_Glob | 3 |
| Ch_1_Glob | 4 |
| Ch_2_Glob | 3 |
| Dhrystones_Per_Second | 2 |
| End_Time | 2 |
| Int_Glob | 5 |
| Microseconds | 2 |
| Next_Ptr_Glob | 7 |
| Ptr_Glob | 17 |
| User_Time | 4 |
The Hands-On Projects
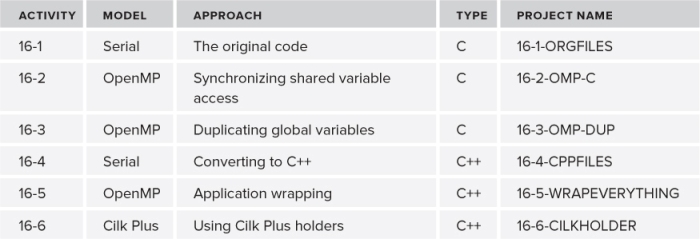
Six projects are associated with this case study (see Table 16.2). You can rebuild each of these projects yourself in Activities 16-1 to 16-6. The first three activities use C, starting with the original C code, and the last three activities use C++. Each of the following sections describes the steps that were taken to implement the different approaches. At the end of each section, a hands-on activity gives instructions on how to build the new version. All the code changes are already included in the project files; all you need to do is navigate to the correct directory and follow the build instructions.
Table 16.2 The Different Approaches
Building the Projects
Within each project folder is a Makefile. You need to edit this file, as follows, so that the correct OS-specific include file is used:
## TODO: EDIT next set of lines according to OS

include ../CONFIG/windows.inc
#include ../CONFIG/linux.inc
To build a project, simply call nmake on Windows, or make on Linux.
Project Targets
The Makefile has a number of different targets that can be built (see Table 16.3).
Table 16.3 The Targets in the Makefile
| Target | Description |
| <no target> | Builds an executable, main.exe.
To change the name, use TARGET flag (for example, make TARGET=test produces a file test.exe). |
| benchmark | Calls the benchmark. |
| hotspot | Calls the command-line version of Amplifier XE to do a hotspot analysis. |
| concurrency | Calls the command-line version of Amplifier XE to do a concurrency analysis. |
| datarace | Calls the command-line version of Inspector XE to look for data races and deadlocks. |
| clean | Deletes objects and the .exe. |
After building any of the hotspot, concurrency, or datarace targets, you can examine the results by using Amplifier XE (for hotspot and concurrency) or Inspector XE (for datarace) to view the results. See the section “Viewing the Results” for more information.
An Example Build
Always call make clean (for Windows, use nmake clean) before doing any build. Here's an example of creating and running the benchmark on a Windows platform:
>cd 16-1-ORGFILES
>nmake clean
>nmake benchmark
<… output from compiler here … (deleted for brevity)>
        main.exe 100000000

Dhrystone Benchmark, Version 2.1 (Language: C)

Program compiled without ‘register’ attribute

Execution starts, 100000000 runs through Dhrystone
Execution ends

Final values of the variables used in the benchmark:

Int_Glob:            5
        should be:   5
Bool_Glob:           1
        should be:   1
Ch_1_Glob:           A
        should be:   A
Ch_2_Glob:           B
        should be:   B
Arr_1_Glob[8]:       7
        should be:   7
Arr_2_Glob[8][7]:    100000010
        should be:   Number_Of_Runs + 10
Ptr_Glob->
  Ptr_Comp:          5991072
        should be:   (implementation-dependent)
  Discr:             0
        should be:   0
  Enum_Comp:         2
        should be:   2
  Int_Comp:          17
        should be:   17
  Str_Comp:          DHRYSTONE PROGRAM, SOME STRING
        should be:   DHRYSTONE PROGRAM, SOME STRING
Next_Ptr_Glob->
  Ptr_Comp:          5991072
        should be:   (implementation-dependent), same as above
  Discr:             0
        should be:   0
  Enum_Comp:         1
        should be:   1
  Int_Comp:          18
        should be:   18
  Str_Comp:          DHRYSTONE PROGRAM, SOME STRING
        should be:   DHRYSTONE PROGRAM, SOME STRING
Int_1_Loc:           5
        should be:   5
Int_2_Loc:           13
        should be:   13
Int_3_Loc:           7
        should be:   7
Enum_Loc:            1
        should be:   1
Str_1_Loc:           DHRYSTONE PROGRAM, 1'ST STRING
        should be:   DHRYSTONE PROGRAM, 1'ST STRING
Str_2_Loc:           DHRYSTONE PROGRAM, 2'ND STRING
        should be:   DHRYSTONE PROGRAM, 2'ND STRING

Microseconds for one run through Dhrystone:  0.040
Dhrystones per Second:                      25000000.0
The call to nmake benchmark did two things: it built the benchmark, and then it ran the benchmark, passing in the value 100000000, which was used to control the number of iterations the benchmark ran.
After the benchmark runs, it checks that the values held in the various variables are correct, printing out messages confirming their value. The last piece of information displayed is how many Dhrystones per second was achieved.
Adding Amplifier XE APIs to Timestamp the Dhrystone Loop
To help measure the duration of the benchmark more accurately, Amplifier XE API calls have been added to the for loop in Activities 16-2 to 16-6. This enables Amplifier XE's data collector to record the time between the two points.
main()
{
// initialize Amplifier XE frame domain
 _itt_domain* pD = _itt_domain_create( "My Domain" );
  pD->flags = 1; // enable domain
.
.
.
  _itt_frame_begin_v3(pD, NULL);  // record start
  for(…)
  {
    // body of loop
  }
  _itt_frame_begin_v3(pD, NULL); // record end
}
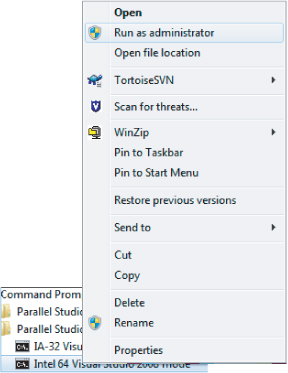
If you are using Windows, you will get more accurate timing results from Amplifier XE's collector if you run the application in administrator mode. To do this, open a compiler command prompt (via Start ⇒ All Programs ⇒ Intel Parallel Studio XE ⇒ Command Prompt) in administrator mode, as shown in Figure 16.2.
Figure 16.2 Opening a command prompt as Administrator in Windows
Viewing the Results
To view the results of a hotspot or concurrency target, open the results file with the GUI versions of Amplifier XE. To view the results of a datarace target, use Inspector XE. You can also use the command-line version to give you a report. For example, to build the WRAPEVERYTHING projects and run a concurrency analysis:
>cd 16-5-WRAPEVERYTHING
>nmake concurrency
<… output from compiler here … (deleted for brevity)>
<>
Microsoft (R) Program Maintenance Utility Version 9.00.30729.01
Copyright (C) Microsoft Corporation.  All rights reserved.

        amplxe-cl -collect concurrency -knob collect-signals=true -follow-child
 -mrte-mode=auto -target-duration-type=short -no-allow-multiple-runs -no-analyze
-system  -data-limit=100 -slow-frames-threshold=40 -fast-frames-threshold=100 --
  ./main.exe 100000000 SILENT
0.9300 Elapsed Secs
Using result path ‘C:dvCH1616-5-WRAPEVERYTHING
000cc’
Executing actions 75 % Generating a report
Summary
-------

Average Concurrency:  12.710
Elapsed Time:         1.308
CPU Time:             15.551
Wait Time:            6.228
Executing actions 100 % done
Notice that the command-line collector reports which directory the results are stored in:
Using result path ‘C:dvCH1616-5-WRAPEVERYTHING
000cc’
You can view the results by calling the GUI version of Amplifier XE from the command line:
amplxe-gui ./r000cc
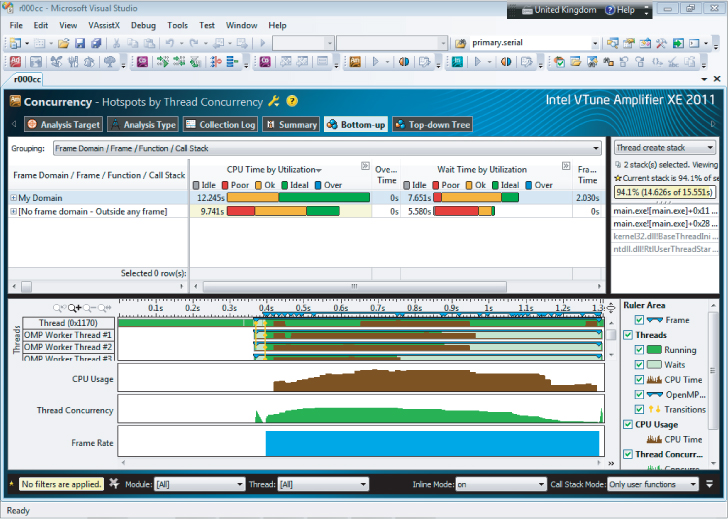
In the bottom-up view of the results, you can read the Frame Time if you group the results by Frame Domain, Frame Type, Function, or Call Stack (which is available from the Grouping pull-down menu), as shown in Figure 16.3.
Figure 16.3 View the timestamp for the benchmark by looking at the Frame Time
Building the Project
cd 16-1-ORGFILES
Windows
include ../CONFIG/windows.inc
Linux
include ../CONFIG/linux.inc
Windows
nmake clean
nmake
Linux
make clean
make
Measuring Performance
Windows
nmake benchmark
Linux
make benchmark
Parallelizing the C Version
In this section, the original C code of the benchmark is parallelized using OpenMP. You can build the completed versions in Activity 16-2 and 16-3. Two attempts are made at parallelizing:
- The first attempt looks at synchronizing all the access to shared variables.
- The second attempt duplicates the global variables so that each running thread has its own thread-specific copy.
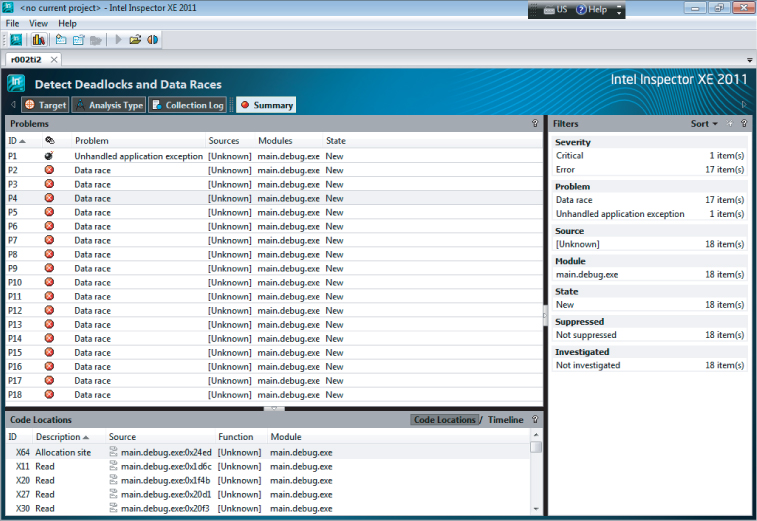
Before diving into each attempt, it's a good idea to find out how many data races need to be fixed. You can do this by making the for loop of the benchmark parallel using the #pragma omp parallel for construct, and then running Inspector XE to find out how many data races exist.
Figure 16.4 shows a list of data races that are produced using this naïve parallelization step. The program has 18 data races and also an unhandled exception. It looks as though there is quite of lot of work to be done for such a small program!
Figure 16.4 Inspector XE shows the data races to fix
Attempt One: Synchronizing Shared Variable Access
In the first attempt, the benchmark was made parallel in three steps, as shown in Figure 16.5. You can examine the results of these code changes in Activity 16-1.
Figure 16.5 The steps to parallelizing with OpenMP
The following code snippet shows the OpenMP constructs used to parallelize the loop. Each variable marked as lastprivate has its final value copied back to the original shared variables.
#pragma omp parallel for lastprivate(Int_1_Loc,Int_2_Loc,Int_3_Loc,
  Enum_Loc,Str_1_Loc,Str_2_Loc) private(Ch_Index,tmp_Glob)
for (Run_Index = 1; Run_Index <= Number_Of_Runs; ++Run_Index)
{
  .
  .
}
Any access to shared variables that could not be made private were declared to be a critical section. This allows only one thread to operate on the variable at any time:
#pragma omp critical
Int_Glob = Run_Index;
It was difficult and at times tedious to add these critical sections. At one stage a deadlock was accidentally introduced because of the function nesting in the benchmark. Luckily, Inspector XE detected this.
The Results
The new parallel program runs very slow, with each Dhrystone taking more than 300 microseconds to complete:
Microseconds for one run through Dhrystone:  300.0
Dhrystones per Second:                      3333.3
The Amplifier XE data collector generates so much data that it issues the following warning:
Warning: The result contains a lot of raw data. Finalization may take a long
time to complete.
Changing the loop count from 1,000,000 to 1,000 reduces the amount of data generated to a manageable size.
Figure 16.6 shows the Dhrystones per second that are achieved for different numbers of threads. The number of threads is changed using the OMP_NUM_THREADS environment variable.
Figure 16.6 The performance of the OpenMP version
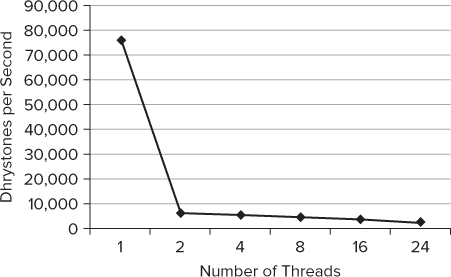
Notice that the moment more than one thread is used, the Dhrystones figures dives to well under 10,000.
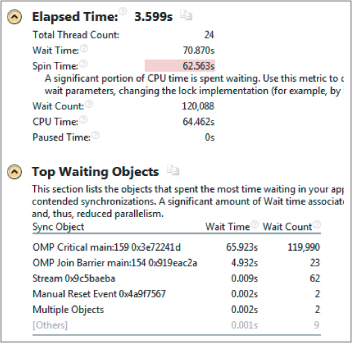
The summary page of the Locks and Waits analysis shows what the problem is. (The summary page opens when you first do an analysis; you can also reach it by clicking on the Summary button.) As shown in Figure 16.7, the Spin Time is excessive. Looking at the list of top waiting objects, you can see that the OMP Critical sync object is the cause if the poor performance.
Figure 16.7 Spin Time is the biggest problem
An expanded view of the time line shows that only one thread runs at once, and it spends more time waiting than running (see Figure 16.8). The dark areas on the horizontal bars are when the thread is running; the lighter areas are where the threads are waiting.
Figure 16.8 The expanded timeline view
Despite having 24 threads available, this part of the code is only ever running on one thread at a time, with all the other threads in a wait condition.
Is It Successful?
In a word, no! Synchronizing the many shared variables does not seem to be a good solution. The code ends up running significantly slower than the serial version.
From an editing perspective, nearly every function of the benchmark had to be modified. It would be a painful task to replicate this effort on a larger project.
This approach does not seem too helpful. The next attempt at parallelization tries to remove the need for synchronization by duplicating the shared variables.
cd 16-2-OMP-C
Attempt Two: Duplicating Global Variables
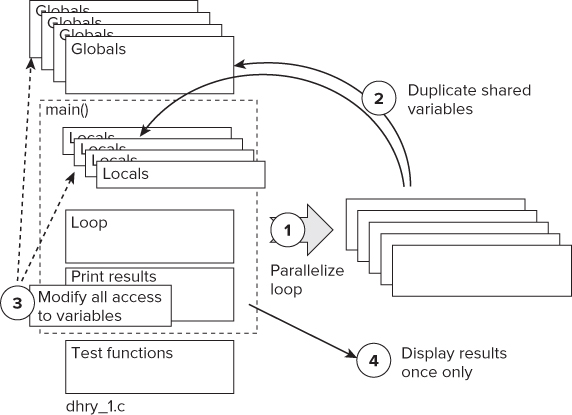
The first attempt to parallelize the code was unsuccessful, with the parallel program running much slower than the nonthreaded version. This second attempt duplicates all the global variables, so there is no need to protect access to them with a critical section. The steps are as follows (see Figure 16.9):
Figure 16.9 Duplicating the shared variables
The following code shows how the global variables are changed into a structure and placed in dhry.h. The highlighted part is an identical copy of the original global variables, copied from dhry_1.c.
// Structure to duplicate globals (declared in dhry.h)
typedef struct _globals
{
  Rec_Pointer     Ptr_Glob, Next_Ptr_Glob;
  int             Int_Glob;
  Boolean         Bool_Glob;
  char            Ch_1_Glob, Ch_2_Glob;
  int             Arr_1_Glob [50];
  int             Arr_2_Glob [50] [50];
} GLOB_STRUCT;
A new pointer, Ptr_Glob_Arr, is used to point to an array of the struct _globals. Memory is dynamically allocated using the OpenMP API calls omp_get_max_threads() and omp_set_num_thread() to make sure that the right amount of space is allocated:
// Allocating enough space for each thread
num_threads = omp_get_max_threads();
omp_set_num_threads(num_threads);
Ptr_Glob_Arr = malloc(sizeof(GLOB_STRUCT) * num_threads);
Initializing and Accessing the Global Variables
Each copy of the global variables must be initialized in every OpenMP thread (see the following highlighted code). Wherever the global variables are referenced in the source code, a new level of indirection is added so that each thread can access its own copy of the variables. The omp_get_thread_num() function is used to get the index of the current thread.
#pragma omp parallel private (id)
{
  // set pointer to current globals
  id = omp_get_thread_num();

  Ptr_Glob_Arr[id].Next_Ptr_Glob = (Rec_Pointer) malloc (sizeof (Rec_Type));
  Ptr_Glob_Arr[id].Ptr_Glob = (Rec_Pointer) malloc (sizeof (Rec_Type));

  #pragma omp barrier

  #pragma omp for  private(Run_Index) firstprivate(Str_1_Loc,Number_Of_Runs)
    lastprivate (Int_1_Loc,Int_2_Loc,Int_3_Loc,Ch_Index,Enum_Loc,Str_1_Loc,Str_2_Loc)
  for (Run_Index = 1; Run_Index <= Number_Of_Runs; ++Run_Index)
  {
    // other code here
  }
  .
  .
} // end parallel region
The Results
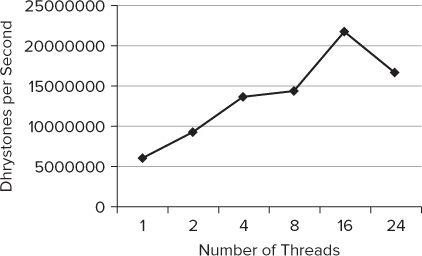
The newly built application runs much better than the application from the first attempt, and has good scalability. The big disadvantage of this approach is the time taken to modify the files. Figure 16.10 shows the results of running the tests on a workstation that supports 24 cores.
Figure 16.10 The performance of the duplicated variables version
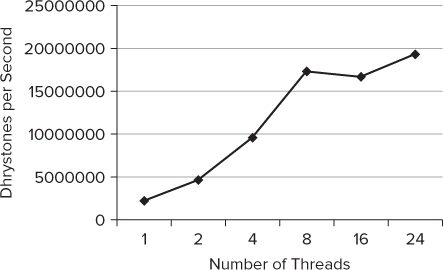
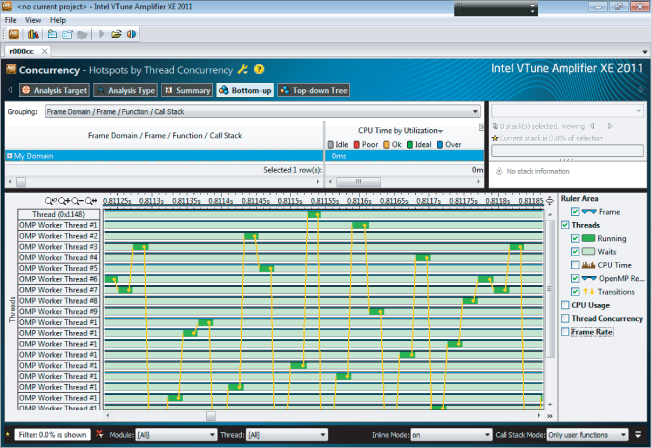
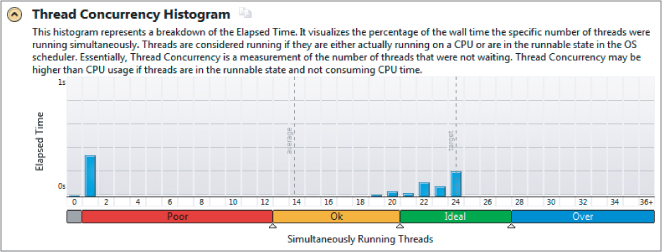
Figure 16.11 shows the summary page from Amplifier XE. The number of simultaneously running threads is ideal, with between 20 and 24 threads running together most of the time, for an average concurrency of just under 18.
Figure 16.11 The concurrency of the duplicated variables version
Is It Successful?
Yes and no! Duplicating the shared variables works well and gives vast improvement when compared to attempt 1. However, from an editing perspective, not only nearly every function of the benchmark had to be modified, but also nearly every line. (A slight exaggeration, but it felt that way.) The editing task felt significantly more onerous that in attempt 1.
This approach seems more helpful than the first attempt, but the editing effort is considerable. In the next attempt at parallelization, the benchmark is converted to C++ and then encapsulated into a C++ class.
cd 16-3-OMP-DUP
Parallelizing the C++ Version
The original benchmark is written using C files; renaming the files to have a C++ extension will make it easier to experiment with other threading models as well as take advantage of some C++-specific features such as classes and automatic variables.
It would be nice when changing legacy code if you only had to change the file extension to .cpp. With some legacy code, this is possible; unfortunately, the Dhrystone benchmark is not so straightforward. The benchmark uses old-style K&R programming, with its obsolete calling convention, lack of function prototypes, and missing return types in the function definitions. All of these problems have to be fixed before the code can be successfully compiled.
In the next two parallelization attempts, the C++ version of the benchmark is used, first using OpenMP and then using Cilk Plus.
cd 16-4-CPPFILES
Attempt Three: Wrapping the Application in a C++ Class
Moving to C++ means that it becomes relatively easy to wrap the whole Dhrystone application in a single class and then instantiate multiple instances of the class in its own thread. By doing this, fewer code changes should be needed. The steps are as follows (see Figure 16.12):
Figure 16.12 The steps to wrap the application
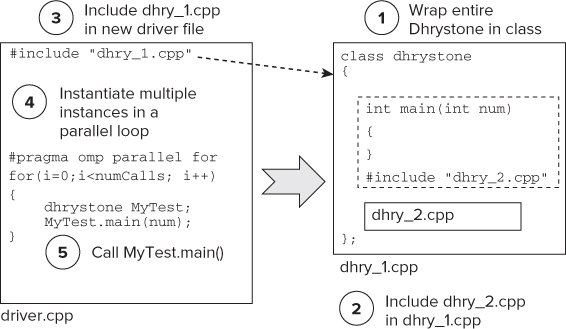
Using the #include statement to pull in the different source files is quite a nice trick, but it has one negative side effect for the benchmark. If you remember, the Dhrystone benchmark is intentionally split across two files so that inter-module access can be tested. The build instructions that come with Dhrystone say that the compiler must not do any cross-file inlining. By using the #include statements, all such inter-module access is removed, thus breaking one of the design goals of the benchmark.
Scheduling the Parallel Runs
In good parallel programming, you should not be asking how many threads you have; good parallel programs should be agnostic about the number of threads available. The following code iterates through each loop, with each loop running on a separate thread. The number of iterations can be overridden by a command-line parameter, read from argv[3]. The schedule(static,1) clause instructs the OpenMP run time to schedule each loop to a separate thread.
int main(int argc, char * argv[])
{
  int NumCalls = omp_get_max_threads();
  int NumDhrystoneLoops = 1000001;
  bool bSilent = false;
  .
  .
  .
  if(argc == 4)
    NumCalls = atoi(argv[3]);
  double start = wtime();
  #pragma omp parallel for schedule(static,1)
  for(int i = 1; i <= NumCalls; i++)
  {
    int num = NumDhrystoneLoops/NumCalls;
    if (i ==NumCalls)
      num += NumDhrystoneLoops % NumCalls ;
    dhrystone MyTest;
    printf("running with %d
",num);
    MyTest.main(num,bSilent);
  }
  double stop = wtime();
  printf("%4.4f Elapsed Secs
",stop - start);
}
The number of Dhrystone loops each parallel test does is calculated by dividing the number of Dhrystone tests stored in NumDhystoneLoops by the number of iterations that will be performed.
Silencing the Output
One of the consequences of wrapping the whole of the original main() function in a new class is that the code to print out the results is also run multiple times. To minimize the clutter on the output, an extra Boolean flag is added to the code to control whether the results are printed to the screen:
class
{
  void main (int num,_itt_event & Event,bool bSilent)
  {
  .
  .
  // compiler will not optimize this away, because it cannot know at compiler time
  // what the value of bSilent will be.
  if(!bSilent)
  {
    printf ("etc
");
  }
  .
  .
}
If you remember, one of the reasons for having the output printed to the screen is to stop any optimizing compiler from removing what it considers to be unused code. Without the printfs, the compiler will see that some of the results of the benchmark are not used and optimize away most of the code. By using a Boolean variable that is initialized at run time using a scanf, the compiler will not strip away most of the code, because it cannot know at compile time whether or not the printfs are being used.
The Results
Figure 16.13 shows the results running with different threads on a 24-core machine. There is still a measure of scalability, but the performance is poorer than the previous attempt. The spike at 16 threads is probably an anomaly. Running the tests several times gave results that varied by more than 20 percent.
Figure 16.13 The results of the wrapped application
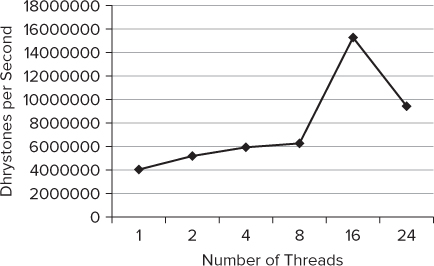
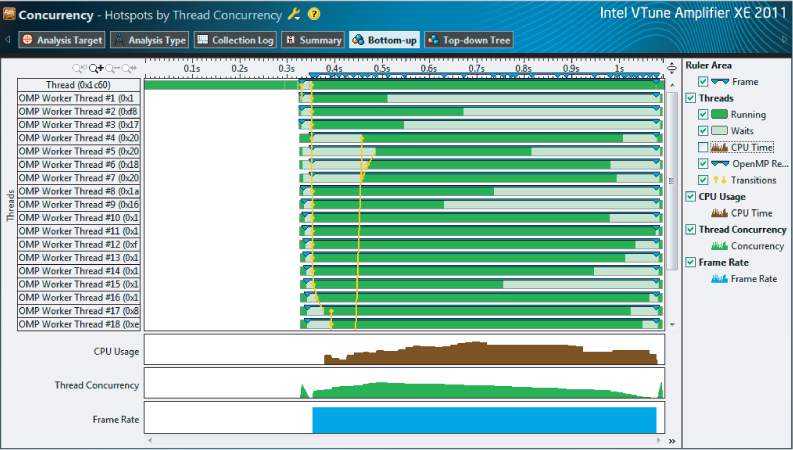
Figure 16.14 is a timeline view of the application. If you look at the thread concurrency bar (the one next to the bottom bar), you will notice that concurrency is not uniform. In the first and last quarters of the time period, concurrency is low. It looks like many of the threads do not start straight-away or finish together.
Figure 16.14 The time-line view of the wrapped application
Is It Successful?
Well, sort of. The application displayed scalability, but the rate of change is much poorer than the previous attempt. And the editing effort required was moderate and required less effort than the previous two attempts.
Some more work needs to be done on this project. If the threading can be tuned so that it has a much punchier start and finish, the performance would improve.
cd 16-5-WRAPEVERYTHING
Attempt Four: Using Cilk Plus Holders
One of the main concerns when adding a new feature to a piece of code is the amount of time it takes and the extent of the code changes. The less code has to be changed, the less likely the risk of introducing errors.
The Cilk Plus parallelization of the Dhrystone benchmark is a good example of where the simplicity of Cilk Plus can be combined with the powerfulness of the C++ language (such as templates and overloading) to add parallelism to legacy code with very few changes required in the original code.
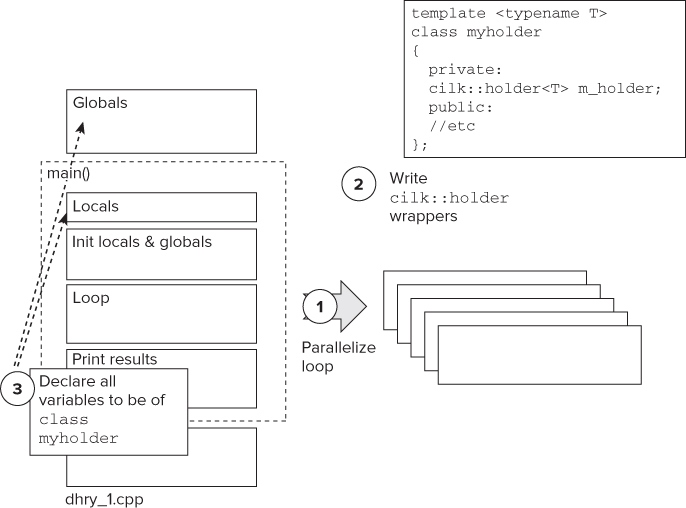
The steps to introduce Cilk Plus holders into the benchmark are as follows (see Figure 16.15):
Figure 16.15 The steps to introduce Cilk Plus holders into the application
Developing the Wrappers
In the three previous examples of parallelizing the benchmark, the shared variables were either reduced in scope, their access locked, or the variables duplicated. For the purpose of the benchmark, duplicating the variables is a legitimate approach and has proved to be the best performing solution.
Cilk Plus Hyperobjects
Cilk Plus's hyperobjects are designed to help fix data race problems associated with shared variables. In the case of the Dhrystone benchmark, the cilk::holder objects can be used to provide local variables for each worker (that is, each thread). Holders are discussed in Chapter 6, “Where to Parallelize.”
Listing 16.1 shows how a wrapper can be placed around a cilk::holder object to provide almost transparent local storage. It is transparent in the sense that very little of the legacy code needs to be changed to use the wrapper class.
Without these wrappers, every access to the global variables would have to be modified to call the function operator. As you can see, however, the use of the function operator is hidden in the overloaded operators of the class myholder. For example, operator-> calls the m_holder() function operator in the implementation code.
 Listing 16.1: Wrapper code for the Cilk Plus holder
#include <cilk/holder.h>
#include "dhry.h"
template <typename T>
class myholder
{
  private:
    cilk::holder<T> m_holder;
  public:
    T & operator->(){return m_holder();}
    myholder<T> & operator=(const T &rhs ){m_holder()=rhs;return *this;}
    myholder<T> & operator +=(const T &rhs ){m_holder()+=rhs;return *this;}
    T * operator &(){return &(m_holder());}
    operator T (){return m_holder();}
    void operator ++(){m_holder()++;}
};
code snippet Chapter1616-1.cpp
In the benchmark code, the only changes that have to be made are to change the declaration of the shared variables. For example, in the following code snippet, the original global variables are replaced with holder wrappers of the same name:
#if 0                     // original globals
Rec_Pointer               Ptr_Glob, Next_Ptr_Glob;
int                       Int_Glob;
Boolean                   Bool_Glob;
char                      Ch_1_Glob, Ch_2_Glob;
#else                     // new code
myholder<Rec_Pointer>     Ptr_Glob,Next_Ptr_Glob;
myholder<int>             Int_Glob;
myholder<Boolean>         Bool_Glob;
myholder<char>            Ch_1_Glob, Ch_2_Glob;
#endif
Arrays require slightly more complicated treatment, because you cannot return an array in C/C++. Some of the derived classes in the cilk::holder class expect to return objects, so arrays need to be encapsulated.
Listing 16.2 shows how single-dimensional arrays are handled. A similar holder will also need to be constructed for two-dimensional arrays (see holder.h in the example project).
Listing 16.2: An array holder
template <typename T, int SZ>
struct CArrayOneDimension
{
  T Data[SZ];
};

template <typename T, int SZ>
class array_holder
{
  private:
    cilk::holder<CArrayOneDimension<T,SZ>> m_holder;
  public:
      operator T* (){return m_holder().Data;}
};
code snippet Chapter1616-2.cpp
Listing 16.3 shows the declaration of the original global variable Arr_1_Glob with the new holder version underneath:
Listing 16.3: A two-dimensional array holder
// int             Arr_1_Glob [50];
array_holder<int,50> Arr_1_Glob;
Listing 16.4

template <typename T, int SZ1, int SZ2>
struct CArrayTwoDimension
{
  T Data[SZ1][SZ2];
};

template <typename T, int SZ1,int SZ2>
class array_2_holder
{
  private:
    cilk::holder<CArrayTwoDimension<T,SZ1,SZ2>> m_holder;
  public:
    operator Arr_2_Dim &(){return m_holder().Data;}
    T* operator[](const T x){return m_holder().Data[x];}
};
code snippet Chapter1616-3.cpp
Initializing the Global Variables
The original initialization code for the global variables sits outside the main for loop. To make the initialization be on a per-thread basis, the code is moved to sit inside the new parallel loop (see the following code snippet). One new holder variable, myholder<bool> bInitialized, is introduced outside the loop. On instantiation all the different worker views of the variable will be automatically initialized to false. As each new Cilk Plus worker enters the loop for the first time, it will see that bInitialized is false, and therefore execute the initialization code. On subsequent iterations of the loop by the same worker, the initialization code will not be run because its view of bInitialized will have been set to true.
In the same code snippet, you can see that the local variables are moved from the top of the main() function to be within the cilk_for loop. This has the desired effect of making the variables thread-specific.
myholder<bool> bInitialized;
cilk_for(int Run_Index = 1; Run_Index < Number_Of_Runs+1; ++Run_Index)
{
  // locals moved from beginning of main
  One_Fifty       Int_1_Loc;
  REG   One_Fifty Int_2_Loc;
  //… etc
  // move initialization into loop
  if(!bInitialized)
  {
    Next_Ptr_Glob = (Rec_Pointer) malloc (sizeof (Rec_Type));
    Ptr_Glob = (Rec_Pointer) malloc (sizeof (Rec_Type));
    // … etc
    bInitialized = true;
  }
  // … rest of for loop
}
The Results
Figure 16.16 shows the results of the Cilk Plus version. The performance dips, because the number of threads is the same as the number of cores available on the workstation that was used.
Figure 16.16 The performance using Cilk Plus
Is It Successful?
In one word, yes (well, almost yes). The performance is still less than the serial version, but the programming is scalable, with a decent rate of change; the editing effort on the original source files is minor; and the fact that the shared variable references stay exactly as they are (you only change the declarations of the variables) makes this solution extremely attractive.
cd 16-6-CILKHOLDER
Overview of the Results
The main interest in the results of the different parallelization efforts is performance and editing effort. Ideally, there should be a performance improvement without having to completely rewrite the original source code.
Performance
You can use two metrics — speedup and scalability — to measure an application's performance. The speedup metric is expressed by the number of Dhrystones executed in one second. Scalability can be observed by plotting a graph of the improved speed as the number of threads is increased.
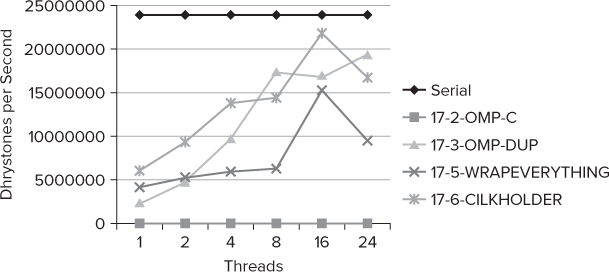
Figure 16.17 shows how many Dhrystones per second were executed in the main for loop of the benchmark program; the bigger the figure, the better the performance. You can see the following:
- The serial version (the top line on the graph) runs better than any of the parallel versions. The root cause of this is the lack of sufficient work being executed in the Dhrystone tests, combined with the excessive use of shared variables.
- The best performing parallel version is the one using Cilk Plus holders.
- The two most scalable solutions are the Cilk Plus holders and the OpenMP duplicated variables.
- The OpenMP version using synchronization does not scale and has terrible performance.
Figure 16.17 The Dhrystone results of the parallelized benchmark
Editing Effort
One of the goals of this exercise was to keep any code changes to a minimum. The benchmark is quite small, so the total coding effort is quite small. Table 16.4 shows the number of words that were changed in adding the parallelism. Because the main measure should be how much the original code has been changed, the new files that have been added have not been included in Changes column.
Table 16.4 Editing Effort
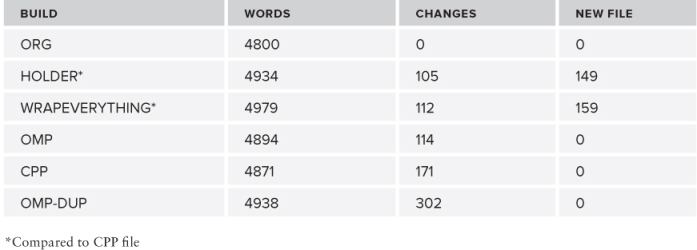
You can see the following:
- The solution that required the fewest changes to the original legacy code (if you ignore the effort of making the benchmark a C++ file) is the HOLDER project.
- The OMP-DUP has the highest number of changes.
- If you consider the cost of changing a project to C++, the projects needing the fewest changes are WRAPEVERYTHING and OMP.
Summary
Adding parallelism to legacy code is not easy; indeed, the examples you saw in this case study show how hard it can be. Given a sufficient workload, it should be possible to incrementally parallelize your old code, using tools such as Amplifier XE and Inspector XE to help verify that the parallelism is correct and optimal. Cilk Plus holders stand out as an interesting way of dealing with global variables without demanding many changes to the original source code.
The case study in the next chapter shows you how to parallelize a program for finding duplicate code blocks using Intel Parallel Advisor XE.