
Chapter 5
Writing Secure Code
What's in This Chapter?
Running a Static Security analysis
Tracking the status of security problems throughout the life of a project
Understanding the programming practices that can leave your code vulnerable to attack
Many security threats take advantage of weaknesses introduced in programs written in C or C++. The weak type checking and the ability to write programs that directly access memory and hardware make it easy to write insecure programs. Most attacks fall into one of two categories:
- Threats that crash or overwhelm an application
- Threats that hijack the code path by inserting foreign code
The Intel compiler's Static Security analysis detects many of these code weaknesses, displaying the results in Intel Inspector XE. More than 250 different errors are detected in the following categories:
- Buffer overflows and boundary violations
- Uninitialized variables and objects
- Memory leaks
- Incorrect usage of pointers and dynamically allocated memory
- Dangerous use of unchecked input
- Arithmetic overflow and divide by zero
- Dead or redundant code
- Misuse of string, memory, and formatting library routines
- Inconsistent object declarations in different program units
- Incorrect use of OpenMP and Intel Cilk Plus
- Error-prone C++ and Fortran language usage
This chapter discusses how to use Intel Parallel Studio XE to perform Static Security analysis on your code. The primary goal of Static Security analysis is to harden applications against security attacks, but it is also useful for detecting some programming errors.
A Simple Security Flaw Example
Listing 5.1 has security errors that could be used in an attack. An attacker could use the unchecked user input to create a buffer overflow.
 Listing 5.1: A program with several security errors
#include <stdio.h>
#include <stdlib.h>
#include <string.h>
// user functions
int NotePad(){printf("    USER: here we launch notepad

"); return 0;}
int Exit(){ exit(0);}

// system functions
int Dir(){printf("    SYSTEM: here we launch dir

"); return 0;}
int Delete(){printf("    SYSTEM:  here we launch Del

"); return 0;}
int ReturnToMain(){return -1;}

int SystemMenu();
int MainMenu();

int (*user_table[])(void) = {NotePad, SystemMenu,Exit};
int (*system_table[])(void) = {Dir, Delete, ReturnToMain};

int SystemMenu()
{
  char password[20];
  int id;
  int ret = 0;
  printf("System Menu
");
  printf("Enter the Password before continuing!…
");
  scanf("%s",password);
  if (strcmp(password, "PASSWORD") == 0)
  {
    while (ret != -1)
    {
      printf("Enter a number:
");
      printf("1: dir
");
      printf("2: delete everything
");
      printf("3: back to main menu
");
      scanf("%d",&id);
      ret = system_table[id-1]();
    }
  }
  else
  {
    printf("Invalid Password!
");
    return 0;
  }
  return 0;
}

int MainMenu()
{
  int id;
  printf("What would you like to do?
");
  printf("Enter a number:
");
  printf("1: run Notepad
");
  printf("2: go to system menu
");
  printf("3: quit
");
  scanf("%d",&id);
  return user_table[id-1]();
}

int main ()
{
  int ret = 0;
  while( ret != -1)
    ret = MainMenu();
  return ret;
}
code snippet Chapter55-1.c
The program consists of two menus: a user menu and a system menu. When the program first starts, the MainMenu() function gives the user three choices:
What would you like to do?
Enter a number:
1: run Notepad
2: go to system menu
3: quit
The user input is captured using scanf(), which stores the result in id. The value in id (minus 1) is used as an index into the array user_table, which is an array of function pointers.
Choosing 1 calls the NotePad function; choosing 2 causes the SystemMenu() function to display the system menu; choosing 3 exits the program via the Exit() function.
The SystemMenu() function works in a similar way to MainMenu(), using the array system_table to jump to the Dir(), Delete(), and ReturnToMain() functions. Before the system menu is launched, the user is prompted for a password (PASSWORD). If the password is wrong, a message is displayed and control is returned to the MainMenu() calling function, which, in turn, returns zero to the while loop in main().
Choosing 2 from the user menu displays the password-controlled system menu. The following shows the menu after the correct password has been entered:
System Menu
Enter the password before continuing!…
PASSWORD
Enter a number:
1: dir
2: delete everything
3: back to main menu
Understanding Static Security Analysis
It is difficult to anticipate how an attacker will attack a program. Attackers are cunning and devious, taking advantage of any weakness in your code. Writing a series of runtime tests or debugging an application will not help find many weaknesses. At best, using such methods, you can test only what is actually executed, with some kinds of threats being impossible to test for.
Static Security analysis differs from standard debugging in that it analyzes the code without executing it. Every possible code path is examined, even those that are never executed by any of your tests.
Running a Static Security analysis on Listing 5.1 reports the following error messages. The problems could be used as a vehicle for a security attack.
- main.c(28): error #12329 — specify field width in format specifier to avoid buffer overflow on argument 2 in call to scanf.
- main.c(38): error #12305 — unvalidated value is received from call to an external function at (file:main.c line:37), which can be used in index expression of system_table.
- main.c(59): error #12305 — unvalidated value is received from call to an external function at (file:main.c line:58), which can be used in index expression of user_table.
Someone could attack the code as follows:
- By using invalid user input to bypass the system menu password — If you enter a number higher than 3 in the user menu, the functions from the system menu are executed. A password is not even requested!
What would you like to do?
Enter a number:
1: run Notepad
2: go to system menu
3: quit
5
    SYSTEM:  here we would launch Del
What would you like to do?
Enter a number:
1: run Notepad
2: go to system menu
3: quit
2
System Menu
Enter the Password before continuing!…
A_VERY_VERY_LONG_PASSWORD
Invalid Password!
 . . .               (program crashes after this)
False Positives
Not all the threats that Static Security analysis reports will be real problems — these are called false positives.
In the following code, the Static Security analyzer is not smart enough to know that the false part of the first if statement and the true part of the second if statement will never be executed together:
int y;
if ((x & 1) == 0) {
  y = 0;
}
if (x == ((x >> 1) << 1)) {
  z = y; // is y always zero here, or can it be uninitialized?
}
The first if statement checks if bit 0 in variable x is set to 1. If it is not, y gets initialized to zero.
The second if statement compares the variable x to the value of y, which has been shifted right by one and then shifted left by one. This shifting has the effect of clearing the lowest bit.
So, if x holds the value 0, the first test will evaluate to true and y will get initialized to 0; the second test will also evaluate to true, and the line z = y will be executed.
If x holds the value 1, both the first and second tests will evaluate to false, so the code y=0 and z=0 will not be executed.
Despite this, the analysis will report a “possible uninitialized variable,” which is a false positive.
Static Security Analysis Workflow
The central activity when working with the results of Static Security analysis is to investigate the potential security problems that were reported and decide whether they need to be fixed. You record the results of your investigation as state information attached to the diagnostic. Typically, you would mark genuine errors as “Confirmed” and false positives as “Not a problem.” You should log confirmed issues in whatever bug-tracking system you normally use for later correction.
Static Security analysis works on the whole program. This means that every file in the program is analyzed together. Because of the time it takes to run a whole program analysis, running the analysis each time you fix a problem is not a practical way forward, unless the program is small. Rather, it is better to run the Static Security analysis periodically.
Conducting a Static Security Analysis
The Intel compiler runs in a special mode to perform a Static Security analysis. In this mode, the compiler skips generating any instructions (see Figure 5.1). The compiler first processes the source files, generating a collection of pseudo-object files that contain analysis information. At link time these pseudo-object modules are combined and analysis is done. During this final analysis step, errors that span function and file boundaries are detected. The results are stored in XML format, which can be viewed and manipulated by Inspector XE. When the results are viewed in Inspector XE, its engine (represented by inspxe in the diagram) updates the states of the new results.
Figure 5.1 How Static Security analysis works
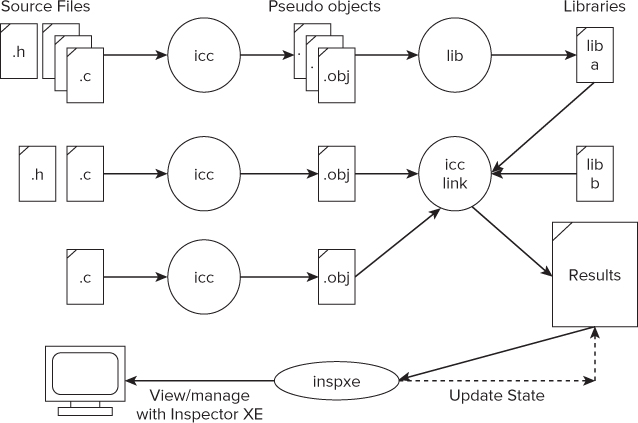
If you want the sources of a library to be part of the analysis, you must first perform the analysis on the library sources and build the library from the resulting pseudo-object modules. For example, in Figure 5.1, the contents of lib-a will participate fully in the error analysis, but lib-b, which might be a third-party library or some other library whose sources have not been analyzed, will not participate.
You can use either the GUI or the command-line version of Inspector XE to view or manage the results.
As you investigate the results using Inspector XE, record your conclusions by assigning state information to diagnostics. You can mark a problem as Confirmed, meaning it is a real issue that needs to be fixed, or as Not a problem, meaning the issue described in the diagnostic does not require fixing. This state information is carried forward from the previous result automatically when a new result is first loaded into Inspector XE.
When new results are loaded, Inspector XE constructs a problem-by-problem correspondence between the old and the new results. The correspondence engine is quite intelligent and is able to match problems between the old and new results, even if the sources have been moved around. Thanks to the correspondence engine, you should not have to reinvestigate old problems as your code grows and changes.
The steps for conducting a Static Security analysis are as follows:
- If you are building inside Visual Studio
The first time you do this, a new build configuration, Intel_SSA, is created. The analysis session then commences by building this configuration.
- If you are not using Visual Studio
- Build the Intel_SSA configuration of the project. This causes the analysis to run.
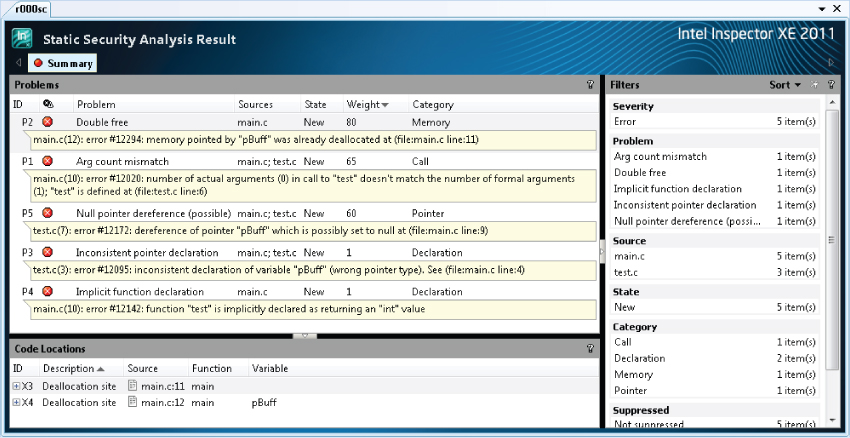
You can view the results with the GUI version of Inspector XE with the command inspxe-gui <directory where result is>. If the analysis is run from Visual Studio, Inspector XE launches automatically. Figure 5.2 shows the summary screen.Each problem is given a weight, a state, and a category, with the problems initially sorted in weight order. The errors with the highest weight are considered to be the most dangerous.
Table 5.1 Options to Enable Static Security Analysis
| Option | Description |
| /Qdiag-enable:sc{[1|2|3]}
(linux -diag-enable:sc …) |
Enables Static Security analysis. The number specifies the severity level of diagnostics reported, as follows:
1 — Only critical errors 2 — All errors 3 — All errors and warnings |
| /Qdiag-enable:sc-include
(linux -diag-enable:sc-include) |
Analyzes include files as well as source files. By default, apparent errors in include files are not reported. |
Figure 5.2 The summary screen
Investigating the Results of the Analysis
Once you have the list of problems, the next step is to investigate each issue and assign a state:
Figure 5.3 Changing the state of a problem
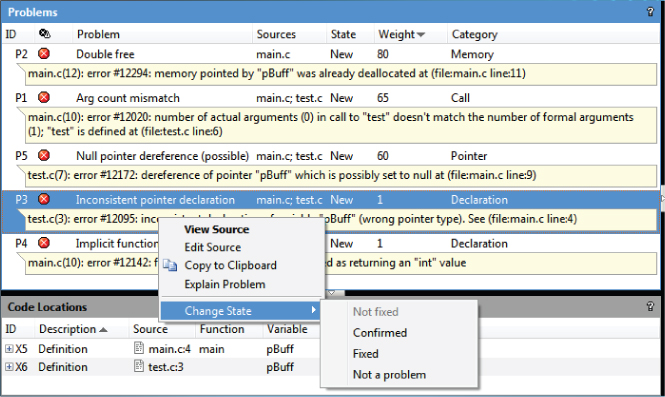
Figure 5.4 The one-click filters
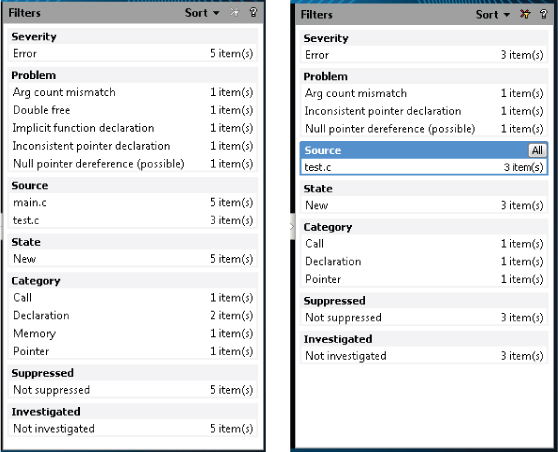
Figure 5.5 Choosing Explain Problem from the context menu
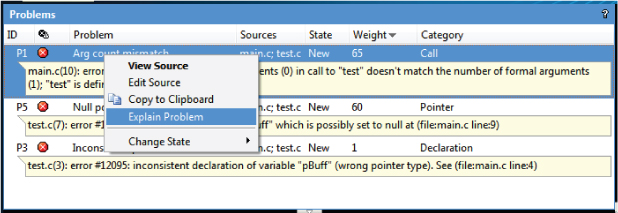
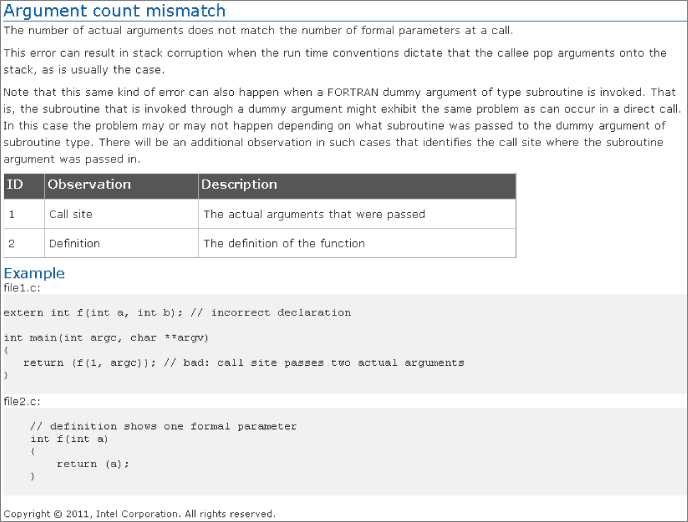
Figure 5.6 An example explanation
You can try these steps for yourself in Activity 5-1.
Working with Problem States
Problems will be in one of six states (see Figure 5.7).
Figure 5.7 Tracking the investigation status
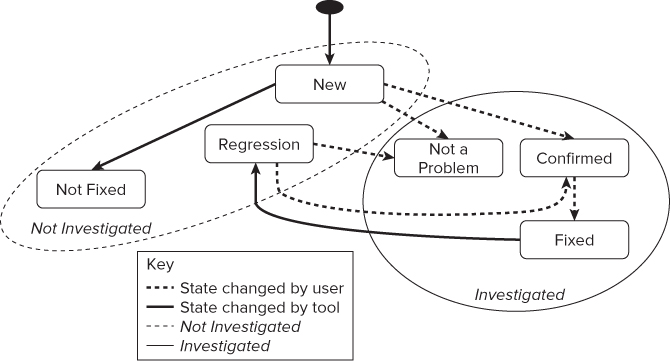
A typical workflow would be as follows:
- The tool sets initial state = New
- You decide: does it need fixing?
- No: set state = Not a problem
- Yes: set state = Confirmed
- When you fix a Confirmed issue, set state = Fixed
- If the tool sees a New issue again, state = Not fixed
This means it's still uninvestigated, just not new.
- If the tool sees a Fixed issue again, state = Regression
This means your fix didn't work.
- Each problem is either Investigated or Not investigated.
- You will never come to a point where no problems exist. For example, there will always be false positives that you mark as Not a problem.
- The goal is to have all problems Investigated.
- When viewing the results in Inspector XE, it is good practice to filter the results so that only the Not investigated problems are displayed.
- If the tool sees a New issue again, state = Not fixed
Table 5.2 describes each state.
- For Visual Studio IDE, start at step 1.
- For the command prompt, start at step 9.
Creating a Project (Visual Studio)
Creating a Dedicated Build and Running the Analysis (Visual Studio)
Creating a Project (Command Prompt)
- On Windows, open an Intel compiler command prompt. The path to the command prompt will be similar to the following. (The exact names and menu items will vary, depending on which version of Parallel Studio and Visual Studio you have installed.)
Start ⇒ All Programs ⇒ Intel Parallel Studio XE 2011 ⇒ Command Prompt ⇒ Intel64 Visual Studio Mode
- On Linux, make sure the compiler variables have been sourced:
$ source /opt/intel/bin/compilervars.sh intel64
Creating a Dedicated Build and Running the Analysis (Command Prompt)
- Linux
make clean
make CFLAGS="-diag-enable sc3" LFLAGS="-diag-enable sc3"
- Windows
nmake clean
nmake CFLAGS= /Qdiag-enable:sc3 LFLAGS=/Qdiag-enable:sc3
inspxe-gui r000sc
Fixing the Errors
inspxe-gui r000sc
Activity 5-1 Summary
Note for Visual Studio Users
Table 5.2 Problem States
| State | Description | Classification |
| New | A new problem. This state is set by the analysis tool and not the user. | Not investigated |
| Not fixed | A problem from a previous analysis, either New or Not fixed. This state is set by the analysis tool, not the user. | Not investigated |
| Not a problem | A problem is not really a problem (for example, it might be a false positive). This state is set by the user. | Investigated |
| Fixed | The problem has been fixed. This state is set by the user. | Investigated |
| Confirmed | A problem is confirmed to be a problem. This state is set by the user. | Investigated |
| Regression | A problem previously marked as being Fixed still exists. This state is set by the analysis tool, not the user. | Not investigated |
The Build Specification
The recommended first step in doing Static Security analysis is to create a new build configuration that is dedicated just to the analysis. If you do not build under Visual Studio and your build environment makes it difficult to create a new build configuration, you can create a build specification file.
A build specification file holds all the commands necessary for performing a Static Security analysis build, and can be launched from a command-line utility.
You can create a build specification file in two ways: by injection and by wrapping. Both methods are supported by utilities that come with the Intel compiler.
When using injection, the utility inspxe-inject launches your normal build and captures a history of the compilation, librarian, or linker steps. This information is stored in a build specification file.
Wrapping involves manually inserting a call to the utility inpsxe-wrap around every compilation, librarian, or linker step in your build scripts. When you run the instrumented build script, the wrap utility executes the wrapped commands and then adds them to the build specification file.
Creating a Build Specification File by Injection
The inspxe-inject utility automatically recognizes the Intel C++ compiler, Intel Fortran compiler, Microsoft C compiler, and the GNU GCC compiler. Figure 5.8 shows how the injection works.
Figure 5.8 Command injection
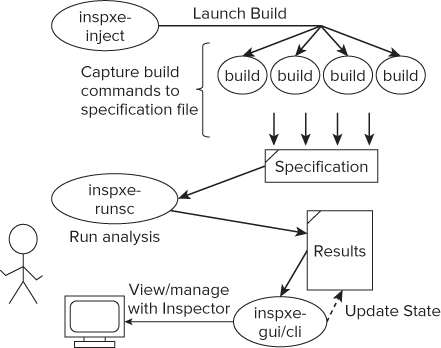
The inspxe-inject utility launches a build. Each invocation of the compiler, linker, or librarian is recorded in a build specification file.
After creating the build specification file, you can use it to run an analysis. Start the analysis by calling the utility inpxe-runsc. This replays every action in the build specification file, but uses the Intel compiler and adds the options to enable Static Security analysis. This has the benefit that your main build could use another compiler, for example GCC, but the Intel compiler would still be used to perform the Static Security analysis. The results are placed in the folder specified on the command line (test1 in this example).
You can either view the results from the GUI version of Inspector XE or query them from the command-line version of Inspector XE. When the results are first loaded into Inspector XE, each problem found is given a state.
Following is an example call to the inspxe-inject utility All the options after the -- are the build commands. In this example, make is called to perform a build:
inspxe-inject -save-spec myfile.spec -- make
After creating the specification file, use inpxe-runsc to launch an analysis:
inspxe-runsc -spec-file myfile.spec -r test1
Utility Options
Table 5.3 shows the command-line options available with the inspxe-inject utility.
Table 5.3 Injection and Wrapping Tool Options
| Option | Description |
| -?, -h, -help | Displays brief tool description and usage |
| -V, -version | Displays version information |
| -option-file=<string> | Specifies the file that contains a list of tool options |
| -tmp-dir=<string> | Uses the specified directory to store temporary files |
| -log-dir=<string> | Uses the specified directory to store log files |
| -v, -verbose | Prints additional information |
| -q, -quiet | Suppresses nonessential messages |
| -save-spec=<string> | Specifies the file for storing the build specification |
The Directory Structure of the Results
Figure 5.9 shows how the results are stored. Each time you run an analysis session, the compiler generates a folder named r xxx sc for the results, incrementing the xxx part of the name on each analysis.
Figure 5.9 The directory structure of the results
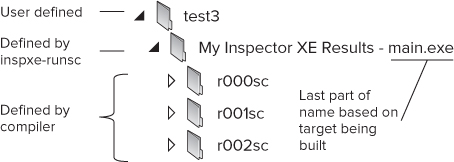
The folder structure is the same whether you are running on Windows or Linux so that results generated on a Linux machine can be read on a Windows platform and vice versa.
As you load a new set of results into Inspector XE, Inspector looks at the previous set of results and assigns a state to all the problems found in the current set. The highest-level directory (test3) is user defined; the My Inspector XE Results folder is defined by the inspxe-runsc utility, which adds the name of the executable (main.exe) to the folder name.
Building the Program
- Linux
make clean
make
- Windows
nmake clean
nmake
[sblairch@localhost ssa]$ ./main
Start of application
*** glibc detected *** ./main: double free or corruption (top):
    0x0000000007078010 ***
Creating a Build Specification Using Injection
- Linux
make clean
inspxe-inject -save-spec myspec01.spec -v -- make
- Windows
nmake clean
inspxe-inject -save-spec myspec01.spec -v -- nmake
inspxe-runsc -spec-file myspec01.spec -r test1
inspxe-gui "<path to the results folder from step 7>"
Other Activities
Activity 5-2 Summary
Using Static Security Analysis in a QA Environment
Some developers and managers use Static Security analysis for regression testing and metrics tracking, often in an automatic or a scripted environment.
Regression Testing
The main goal of regression testing is to track the status of a project to ensure that no new problems are introduced when adding code changes to an application. The steps might be as follows:
Steps 1 and 2 are carried out by the developer as part of his or her usual schedule; steps 3 and 4 are for regression testing using the command-line version of Inspector XE, and could be carried out by the developer or a quality assurance engineer. The output from step 3 (reanalyze, etc.) will look similar to this when new errors have been found:
inspxe-cl –user-data-dir "QA1/My Inspector XE Results - main" -report problems
–filter-include state=New
The sample output:
Problem P1: New Error: Double free
main.cpp(14): error #12294: memory pointed by "pGlobal" was already deallocated at
  (file:main.cpp line:13)
X1: Deallocation site: main.cpp(13): Function main
X2: Deallocation site: main.cpp(14): Function main: Variable Name pGlobal
The command assumes that a set of results is already available from a previous analysis. The location of the results will change with each analysis, and take the form rxxxsc, where xxx is a number that is incremented each time the analysis is run. The –user-data-dir switch selects as input the highest-numbered (latest) result.
You can detect new problems by filtering the report so that only problems in a “new” state are reported. The results can then easily be mailed to the author of the most recent change.
Metrics Tracking
Project managers can use metrics to track a team's progress in investigating the results of analysis. For example, you can track the percentage of problems that have been investigated or fixed over a period of time.
You can find the status of each problem with the following command:
inspxe-cl –r "DEV1/My Inspector XE Results - main/r001sc" -report status
The results might look like this:
196 problem(s) found
2 Investigated
194 Not investigated
Breakdown by state:
1 Confirmed
1 Fixed
194 New
You can parse the results using either a Perl script or a shell script.
Activity 5-3 gives an example of how to use Static Security analysis in regression testing and metric tracking.
Building the Program and Running an Analysis
- Linux
inspxe-cl -r "test1/My Inspector/ XE/ Results/ - main/r000sc"
–report problems –filter-include state=New
- Windows
inspxe-cl -r "test1My Inspector XE Results - main
000sc"
-report problems –filter-include state=New
Changing the State Implicitly
inspxe-runsc -spec-file myspec03.spec -r test3
- Linux
inspxe-cl -r "test1/My Inspector/ XE/ Results/ - main/r001sc"
-report problems –filter-include state=New
- Windows
inspxe-cl -r "test1My Inspector XE Results - main
001sc"
-report problems –filter-include state=New
Adding a New Error
void test(int num)
{
  int i;
  pBuff[0] = num/i;
}
make clean
inspxe-runsc -spec-file myspec03.spec -r test3
inspxe-cl -r "test1/My Inspector XE Results - main/r002sc"
-report problems –filter-include state=New
Activity 5-3 Summary
Source Code
Two files, main.c and test.c, are used in the hands-on activities. Each of the source files has some silly and obvious mistakes. The Makefile in Listing 5.4 is used for Activity 5-2 and Activity 5-3.
Listing 5.2: main.c
#include <stdio.h>
#include <stdlib.h>
extern test();
char *pBuff;
int main()
{
    int not_used;
    printf("Start of application
");
    pBuff = malloc(100);
    test();
    free (pBuff);
    free (pBuff);
    return (int)pBuff;
}
code snippet Chapter5main.c
Listing 5.3: test.c
#include <stdlib.h>
void test(int num);
extern int *pBuff;

void test(int num)
{
    pBuff[0] = num;
}
code snippet Chapter5 est.c
Listing 5.4: Makefile
## TODO: EDIT next set of lines according to OS

## WINDOWS OS specific vars.
CC=icl
DEL=del
OBJ=obj

# LINUX SPECIFIC, uncomment these for LINUX
# CC=icc
# DEL=rm -Rf
# OBJ=o

## -------------- DO NOT EDIT BELOW THIS LINE -------------
CFLAGS =
LFLAGS =

OBJS = main.$(OBJ) test.$(OBJ)
TARGET = main
.c.$(OBJ):
      $(CC) -c $(CFLAGS) $<

$(TARGET).exe:$(OBJS)  Makefile
      $(LD) $(LFLAGS) $(OBJS) $(LIBS) -o $@

clean:
      $(DEL) $(OBJS)
      $(DEL) $(TARGET).exe
code snippet Chapter5Makefile
Summary
Writing code that is secure and not vulnerable to attack is important. By performing a Static Security analysis on your source code, you can identify and fix many of the potential problems. Many of the vulnerabilities are caused by common programming errors or misuse of standard libraries. Using the Intel compiler and Inspector XE together is an effective method of identifying these vulnerabilities.
Chapter 6, “Where to Parallelize,” introduces the first of a four-step process for making code parallel. The chapter shows how to spot regions of your code that are suitable for making parallel.