
Chapter 4
The Site Survey
4.1 Introduction
This laboratory is designed to cover all of the important aspects of the site survey. It involves a thorough, detailed review of the site selected for installation of a photovoltaic system. There are five key pieces to the site survey:
- Measure and document the roof sections (or ground areas) proposed for installation of PV modules and assess their physical condition.
- Inspect attic spaces, documenting rafter/truss dimensions and spacing and any evidence of water damage.
- Evaluate the best pathways for DC and AC electrical runs from the PV array to the string combiner or inverter and then to the service panel. Determine the placement of the inverter(s), monitor, and other balance of system components.
- Perform a shading analysis, which calculates the shading of the sun from objects such as trees, buildings, and chimneys at the proposed location for the PV modules.1
- Gather detailed information about the electrical service including rating of main disconnect/overcurrent protection, rail ampacity, system phasing, grounding electrode and grounding electrode conductor, and suitability for back-feeding the power output of the PV system.
4.2 Student Learning Objectives
At the end of this laboratory, the student will be able to
- Determine whether a proposed PV system can be fully installed at the proposed site consistent with stipulated equipment and applicable codes
- Gather sufficient information to support a full engineering design and mechanical/electrical integration plan in support of a permit package and the installation crews.
4.3 Organization of This Lab
This laboratory is divided into the following five sections:
- Roof measurements, roof pitch and orientation, location of obstructions and shading objects, inspection of existing roofing materials, penetrations, and caulking
- Determination of rafters/truss dimensions and spacings, rafter/truss spans, and attic inspection
- Photographs of roof sections, attic spaces, four building elevations, building from the street and service panel
- Shading analysis
- Inspection and documentation of service panel and associated grounding
All of these measurements and observations must be recorded in your laboratory notebook. Prior to the start of each site survey, write down your name, the date, the system size (PV module type, number of PV modules, and PV inverters), the client name and physical address, and confirm the electrical utility.
4.4 Prior Activities
4.4.1 Preliminary Technical Sales Proposal
In most PV projects, the site survey is preceded by the preparation and presentation of a preliminary technical sales proposal, which includes a high-level description of the PV system and preliminary pricing that has been positively received by the customer and that the responsible salesperson believes has a high probability of turning into a negotiated sales contract. The PV system configuration has already been simulated for annual energy production and compared to 12 consecutive months of energy bills. Any anticipated changes in the square footage of the home, new appliances, additions to the family, or lifestyle changes have been duly noted and used to adjust the predicted 12 month energy usage going forward.
In some circumstances, a sales contract has already been signed. In this case there should be language built into the contract stipulating that the contract is conditional on confirmation that the roof (or ground area) is of sufficient size, the roof (or ground area) is in good condition, the existing electrical service is code compliant, and there are no other existing deficiencies that would prevent the installation of a code-compliant PV system. In this latter regard, there could be problems with a leaking roof; damaged shingles, tiles, or roof membrane, or problems with the electrical wiring.
4.4.2 Sample Module Rows
Sample module rows are examples of frequently encountered PV layouts. They are based on the specified PV module(s) and orientations and take into account mid- and end-clamp dimensions. These examples can be created using a CAD tool or drawn on quad ruled paper. In any event they are fully dimensioned.
Using your field notebook, construct a series of single-row module “samples” as described before: comprising two, three, four, and five modules in portrait orientation, using the actual dimensions of the Renogy RNG-240D PV module and ProSolar mid- and end-clamps. Use a scale of two squares (1/2 in.) per foot.
4.4.3 Determination of All Authorities Having Jurisdiction (AHJs)
A successful site surveyor will need to understand which authorities have jurisdiction over a PV installation and will properly apply the requirements of each jurisdiction to the proposed installation. These AHJs include the following:
- Municipal or county building and safety department
- Municipal, county, or state fire marshal
- Municipal zoning committees
- Homeowners’ associations (HOAs) and other architectural committees
- Electrical utility
For example, the applicable building and safety department will have requirements regarding roof loading (live, dead, wind, and perhaps seismic). The electrical utility may require an AC disconnect or a production meter. The fire marshal will usually require “setbacks,” which are portions of the roof that must be kept free of PV equipment so that fire fighters can have free and unrestricted access to the rood in case of fire.
Municipal zoning committees2 and architectural review committees present challenges to a site surveyor because they can vary quite widely in terms of their restrictions. Zoning (a/k/a land use) committees may apply restrictions to building construction or building modifications apart from safety-related codes. They may apply restrictions reflective of an area exclusive to single-family residences. Architectural review committees enforce “restrictive covenants” related to aesthetic considerations on behalf of homeowner associations (a/k/a community associations). These restrictions may include setback and height restrictions, a requirement that utilities be screened, and conformance to an architectural style.3 It is the responsibility of the salesperson to determine which AHJs cover the property in question and to communicate this information to the site surveyor. It is the responsibility of the site surveyor to understand the specifics of each jurisdiction and to take them into account while performing the site survey.
4.4.4 The Virtual Site Survey
A virtual site survey is one that is accomplished without physically visiting the site. It is usually performed by a salesperson using aerial imagery obtained by satellites or low-flying aircraft and referring to a county assessor’s parcel map.
Google Earth is a good example of satellite imagery. Zillow, MS Live Earth, and Google Maps are good examples of imagery from low-flying aircraft. In addition, Google maps include street views.
Satellite images yield true dimensions in the plane of the earth but flatten the vertical dimension and are relatively low resolution (~1 ft.). Aircraft images have a significant angle of incidence (e.g., 30°) and do not allow direct or accurate measurement of overall roof dimensions, but they do have the advantage of high resolution. This higher resolution can actually permit the resolution of chimneys, skylights, most vents, and other obstructions. In addition to higher resolution, airplane images can be obtained from four perspectives (east, south, west, and north), allowing the inference of roof pitch and other information relating to the vertical dimension.
A recent commercial application, Eagleview,4 uses aerial imaging to determine a full three-dimensional representation of the building. Since the Eagleview application requires a fee, it may not be appropriate for use in this laboratory unless an educational use fee waiver can be arranged.
Since the preliminary site survey is often used in conjunction with a preliminary technical sales proposal for the customer’s consideration, it should include enough information to confirm that the required number of PV modules fit the appropriate roof sections (or ground areas).
The site surveyor should have a copy of the preliminary site survey, if available, in hand when performing his or her own site survey.
4.5 Resources
The site survey requires a number of relatively sophisticated instruments and an attention to detail that is surpassed only by the actual PV installation. The following is a comprehensive list of equipment needed for a successful site survey:
- 8 ft. step ladder or 10–12 ft. extension ladder
- 24 ft. extension ladder5
- 35 ft. tape measure
- 100 ft. measurement wheel
- Digital camera
- Quad-ruled field notebook (Ampad model #22-158, or equivalent; www.ampad.com)
- Pencil, eraser, and 6 in. ruler
- Protractor (a/k/a “tilt meter”)
- Construction level and a 2 × 4 piece of lumber, minimum 2 ft. long
- Flashlight with fresh batteries
- Screwdriver with both flat and Phillips blades
- Noncontacting AC voltage detector
- Shading analysis tool: SolarPathfinder™ or Solmetric Sun-eye™
- Calculator
- Small backpack in which to keep all of the items except the ladders
4.6 Example of a Site Survey
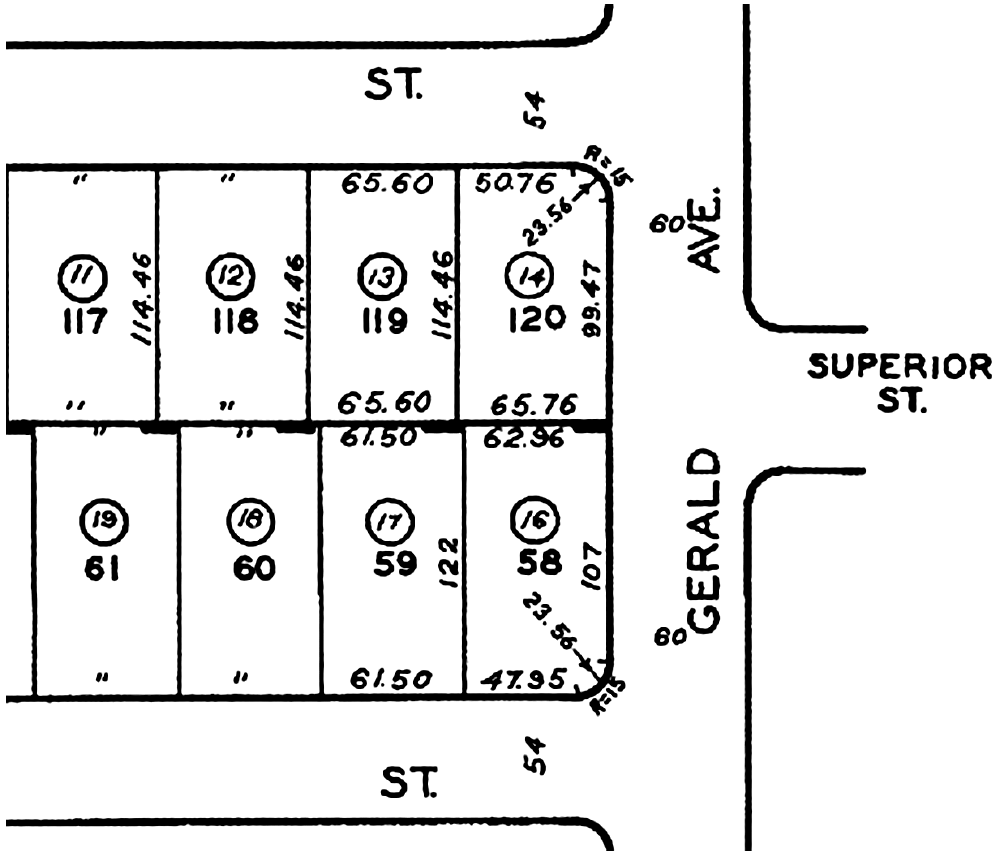
4.6.1 County Assessor’s Map
Prior to going to the site, you, as the site surveyor, should have a printout of the county assessor’s map of the lot, giving you the overall lot boundaries. Figure 4.1 depicts a portion of the assessor’s plot plan.
4.6.2 Sketch of the Property Including House
□ Using the assessor’s map as reference, create a hand sketch of the property. Include the house, garage, driveway, curb, and any other structures. Indicate true north on the sketch.
□ Indicate the azimuth and pitch of all roof sections. A measurement wheel can be used to quickly measure setbacks from lot boundaries of all structures to a precision of half a foot. This sketch should show the location of the service drop and the service panel.
□ Create a second, more detailed sketch for each of the roof sections that will have PV modules. This sketch should include the location of all of the modules contained in the preliminary technical proposal. This sketch should include dimensions of the roof, of the PV arrays, and of all relevant obstructions
□ On this second sketch, indicate the location where all of the shading measurements were taken.
4.6.3 Documentation of Roof Sections
Figure 4.2 shows the final drawing of the roof section of a residential building. There are a total of 20 shading measurements, and the location of the roof where each shading measurement was taken is documented. It contains a series of letters from A through M, which indicate the location of obstructions and shading objects. It shows the location of the service panel and utility drop. This figure is missing data on the pitch of the various roof sections.Figure 4.3 contains additional information regarding the layout, specifically, the location of all obstructions and shading objects.


4.6.4 Site Survey Document
The site survey detail summarizes the results of the site survey. In our example it contains the following sections:
- Access to the property
- Service panel details
- Utility meter and service drop
- Roof condition
- A legend with the details of the obstructions and shading objects.
4.7 Student Exercises
4.7.1 Student Site Survey
4.7.1.1 Document the Roof
□ Document the type of roof using one of the industry standard descriptions: asphalt/composite shingle, torch-down, tar and gravel, one-piece S-tile, flat concrete tile, standing metal seam, two-piece/C-tile, wood shake, or slate.
□ In the case of tile roofs, ask the client if there are any extra tiles and if you could borrow a sample, to be returned.
□ Record the length and width of all roof sections. Pay particular attention to the roof sections that will be used for PV module installation—take measurements to the closest half inch.
□ Make measurements from opposite corners of each roof section (i.e., triangulate), especially if the roof is not rectangular. Make one sketch per roof section in your notebook, to scale. Use a scale of two squares per foot in the Ampad quad-ruled notebook.
□ For each roof section, locate any obstructions and shading objects—soil vents, heater vents, exhaust fan vents, skylights, chimneys, roof hatches, A/C compressors—and any other components that might interfere with the placement of the PV modules or shade them.
□ Use a common reference point (origin) on the roof (e.g., the southeast corner) to locate the x- and y-dimensions of these objects. Use a lettering or numbering system on the roof sketch and provide a separate legend to provide the sizes (i.e., length, width, height) of the obstructions and shading objects. (See Figure 4.3.)
□ Measure the true bearing of the roof using a compass. Most smart phones have a compass application that can be downloaded and used for this purpose. When GPS technology is used, these compasses yield true bearings. If a magnetic compass is used, make sure that there are not steel objects nearby (e.g., flashing), which would distort the reading, and take into account the local magnetic declination. Record the true bearing: ______ ° (true).
□ Measure and record the overhang of the eaves for each roof section: ______ ft.
□ Measure the pitch of the roof by laying a long (minimum 2 ft.) level or length of 2 × 4 lumber on the roof and placing the protractor on top. Or use the protractor on a rafter tail: ______ .
Almost all pitched roofs are constructed using standard rise-to-run ratio. A rise of 4 ft. for every 12 ft. of horizontal run is referred to as “4:12.” This results in a roof pitch of 19°. Common pitches in southern California are 3:12, 4:12, and 5:12. Low-slope roofs (e.g., torch-down) commonly used in commercial buildings can have pitches of 1:12, or even less.
□ Ask the client the age of the roof and document this information.
□ Ask the client if the roof leaks and record the answer in your notebook.
□ Determine if there is any undulation or sagging of the roof.
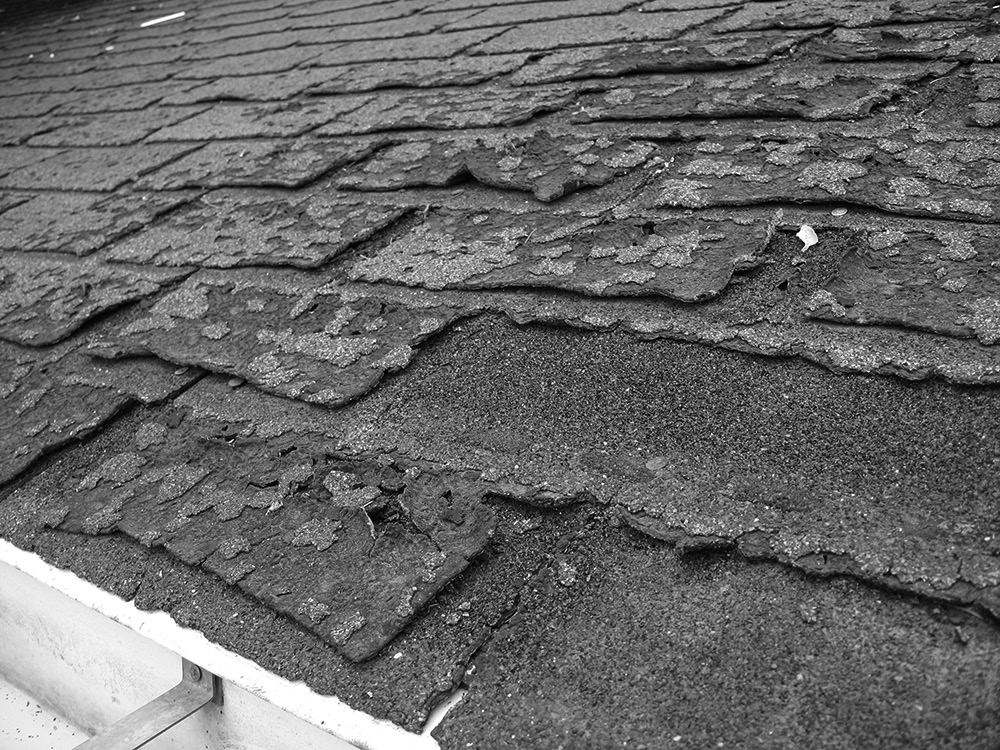
□ Observe the condition of the roofing material and note any loose, cracked, or missing shingles/tiles. For asphalt shingle roofs, examine for missing granular coating or wear, especially the ridge caps. For flat roofs, examine for evidence of low-spots with “stains” or even dirt/debris caused by puddling. Take a photograph of anything problematic.
See Figure 4.4 for an example of a heavily weathered asphalt shingle roof. This roof would need replacement before the installation of the PV modules could commence.
□ Observe the flashing and caulking for all pipes, vents, skylights, chimneys, and attachments (e.g., satellite dish attachments). Record any substandard work or problems.
□ Photograph any cracked or missing shingles/tiles and any questionable flashing or deteriorating caulking. In this event, communicate this information to the salesperson so that he or she may inform the customer, and take this information into account in the final sales contract.
□ Take several photos of every section of the roof, from every relevant angle.
□ In the case of a ground mount, measure the slope of the ground, ground surface, and subsurface details.
□ Based on proposed tilt angle and the number of rows and columns in the array, sketch the array in the notebook, making sure to indicate the position of the array with respect to any buildings.
□ Note the location and dimensions of any obstructions (e.g., walls) and shading objects (e.g., trees, buildings).
4.7.2 Rafter/Truss and Attic Details
Measure and record the dimensions (e.g., 2 × 8) and center-to-center spacing (e.g., 16 in.) of the rafters/trusses. The rafter/truss dimensions and spacing can be obtained by measuring exposed rafter tails at the eaves or by an inspection of the attic.
4.7.2.1 Attic Inspection
Check with the owner as to the locations of the access points to the attic. If the DC or AC wiring runs are planned to be placed in the attic, an attic inspection is mandatory. Attic access usually involves removing an access panel, and sometimes there are retractable stairs. Use an 8 ft. step ladder or a 12 ft. extension ladder to reach the attic space(s).
□ Measure or confirm rafter/truss dimensions and center-to-center spacing.
□ Note the distance that the rafter/truss system spans between load-bearing walls.
□ Determine the optimum route from roof penetration to the point where the wiring exits the building, in the vicinity of the inverter.
□ Take an adequate number of photographs of the entire attic space.
4.7.3 Main Service Panel
□ Note the location of the service panel on the marked-up plot plan and photograph the panel with the panel door closed.
□ Open the door to the service panel and take a picture including the manufacturer’s label and the breakers.
□ Remove the cover plate to the service panel and photograph the exposed busses and circuit breakers.
□ Note the manufacturer and model number of the panel, the voltage, and the current capacity of the busses and main breaker. They are usually the same, but not always; the main breaker can be smaller.
□ Based on the quantity and size of the breaker(s) needed for the solar system (e.g., one 2-pole 20 A breaker), determine whether or not there is room in the service panel for the solar breaker. If not, determine if single pole, full-width breakers can be replaced by half-width “twin” breakers or whether two 2-pole breakers can be replaced by “quad” breakers to make room.
4.7.4 Use of a Subpanel
□ If the preceding strategy of circuit breaker management is not successful, document the use of a subpanel moving several branch circuits to create a code-compliant solution.
□ If two or more inverters are involved, document the deployment of a subpanel to combine the AC outputs of the inverters prior to landing on the service panel.
4.7.5 Locations for Other Major Components
□ Document the recommended location for the inverter(s), subpanel (if needed), AC disconnect, and production meter.
□ If the preliminary technical proposal calls out a battery backup system, determine the optimum locations for the battery bank and the critical load subpanel.
□ Measure the distance from the battery bank to the inverter: ______ ft.
□ Depending on the monitor type, document suitable locations for all of the components that comprise the monitoring system, including data logger, current transformers, voltage measurement units, wireless/wired remotes, and communications gateways.
□ Determine if the client has the required wireless router or wireless access point to the home network.
4.7.6 Grounding of Electrical Service
□ Document the grounding electrode (GE), the system grounding electrode conductor (GEC), and the ground buss bar in the service panel.
□ Photograph the GE and the GEC.
□ If need be, remove the inspection plate of a Ufer ground in order to document and photograph it.
4.7.7 Trenching
There will be a need for trenching if the PV modules are to be located on a building detached from the building where the service panel is located, or if this is a ground mount.
□ Indicate and dimension the recommended route for the trenching.
4.8 Shading Analysis
A proper shading analysis is a key component of the site survey. A “skyline” refers to a single image of the shading objects superimposed on a sun path diagram. In principle, multiple skylines are taken on each roof structure that will receive PV modules. A good strategy is to make shading measurements at the four corners and in the middle of the roof. A “session” refers to a group of skylines from one roof.
This process is then repeated for each roof section that will receive PV modules.
With the advent of the Solmetric SunEye, each capturing of a single individual skyline takes a minute or so and the postprocessing of all of a session and the final shading report might take another 15 minutes.
Having said that, the rapidity and ease with which a shading report can be undertaken using a SunEye can lead to a situation where the student fails to appreciate the underlying fundamentals. For this reason, we will begin our shading analysis exercise using the SolarPathfinder™ tool, complete with sun path graph paper, crayons, and optional digital imaging. This will dovetail very nicely with the lecture portion of the course, where a considerable amount of time is spent on the sun’s path through the sky and the solar resource in general.
4.8.1 Performing a Manual Shading Analysis Using the SolarPathfinder
Refer to the user’s guide to set up the SolarPathfinder, consisting of the tripod, base section, instrument section, and semitransparent dome section. See Figure 4.5 for a diagram of the SolarPathfinder.

The SolarPathfinder employs sun path graph paper, which includes a set of mutually perpendicular axes. One set of axes—the “arcs”—traces the sun’s path through the sky during one day and is marked with the month in question (e.g., December). In principle, there could even be a finer set of axes, but one trace representative of all days in that month gives satisfactory results. The other set of axes—the “rays”—traces out a constant hour for any time of year and is marked with that time of day (e.g., 10 a.m.). The intersection of a sun path and a time-of-day ray pinpoints the location of the sun on a day in that month and at that time of day.
□ Level the base section first using the adjustable length tripod legs. Then adjust the instrument section as it sits in the base section so that the bubble is in the center of the black circle.
□ Set the declination of the job site using the magnetic declination tab, a small brass tab next to the compass. The declination of the Los Angeles area is approximately 12° east. Negative numbers are to the left of the “zero” and positive numbers are to the right of it.
□ Rotate the instrument section so that the red arm of the compass points north (if the site is in the Northern Hemisphere; if not, the red arm should point south).
□ Double-check the bubble to make sure that it remains in the center of the black circle.
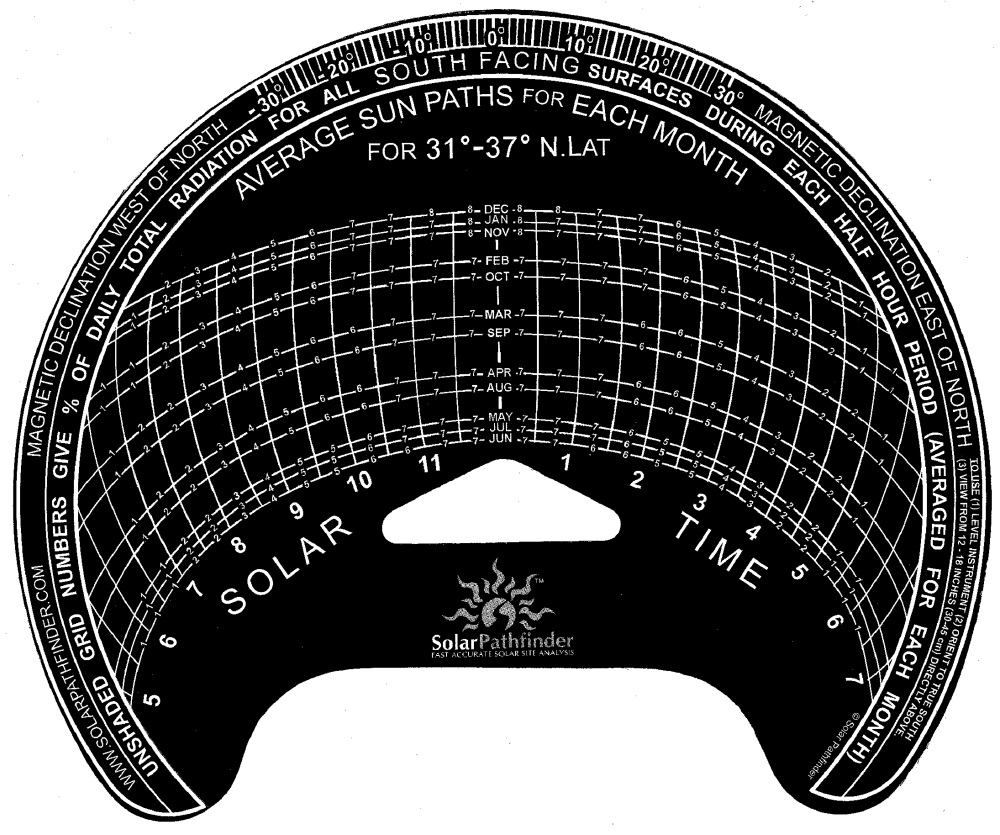
□ Place a piece of sun path graph paper (see Figure 4.6) onto the instrument section. Make sure that the range of latitudes printed on the graph paper includes the latitude of the site.
□ Place the semitransparent dome onto the instrument section. Notice how the skyline is reflected in the dome.
□ While viewing the dome from 12 to 18 in. directly above it, place a white crayon under the dome and trace out the skyline using the crayon.
□ Remove the dome and the graph paper and inspect the white trace, filling in any weak traces.
The results of a typical tracing are shown in Figure 4.7.
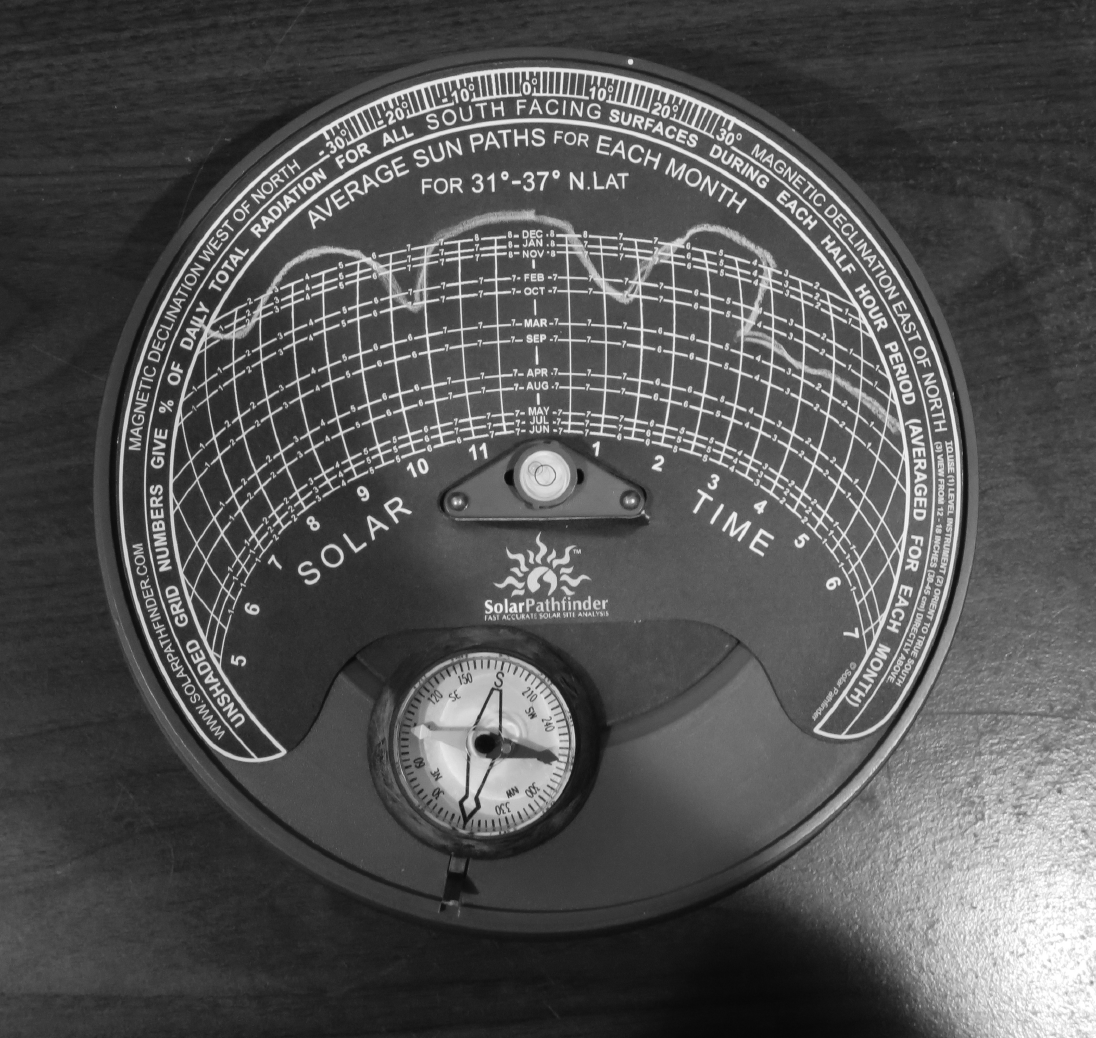
Note that there is a series of numbers embedded in each of the sun path traces—one number for each half hour in the day. In each case the numbers add up to 100%. These numbers represent the fractional solar resource for that half hour time period.
In the spirit of a “hands-on” laboratory, we will now go through a fairly laborious procedure to determine the shading percentage “by hand.” This will serve to explain how tracing the skyline with a white crayon on the sun path graph paper captures the shading data and could be used to calculate a shading percentage without any other equipment or software (except for a PVWatts calculation to get unshaded insolation data).
□ Inspect the arc for the month of December. Does the white crayon trace intersect this arc? If so, the portion of the arc between the beginning of the intersection and the end of the intersection represents the time period for which the sun is blocked by the skyline. Outside this time period the site receives the full solar resource.
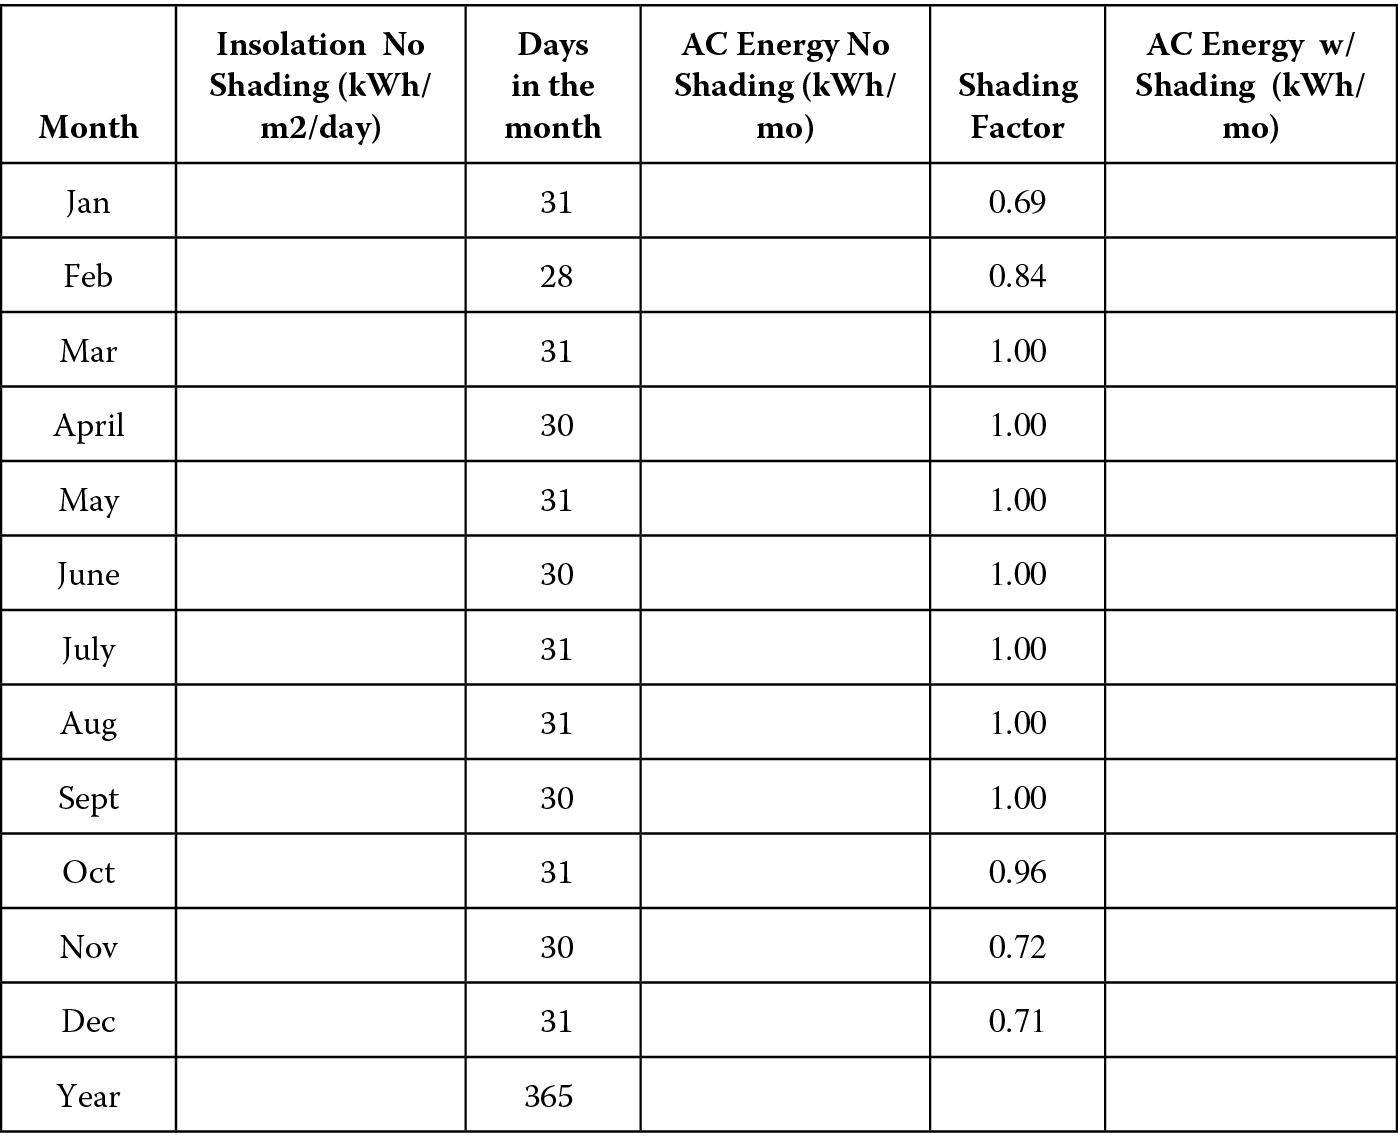
□ Sum the unshaded embedded numbers for the month of December and record this number as a decimal fraction in the table in Figure 4.8 under the column “Shading Factor” (e.g., 0.81).
□ Repeat this process for the other 11 months.
To complete this exercise, we need to know the available unshaded insolation for the site given the orientation of the roof (azimuth and pitch). This can be done by using PVWatts®.
□ Go to the PVWatts website: http://pvwatts.nrel.gov/
□ Enter the site address or zip code and then click on “Go.”
□ Then click on the large arrow “System Info” on the right-hand side of the page.
□ Enter the system size of 4.2 kW. The DC rating is the sum of the STC ratings of the PV modules.
□ Choose standard for module type.
□ Choose “fixed (roof mount).”
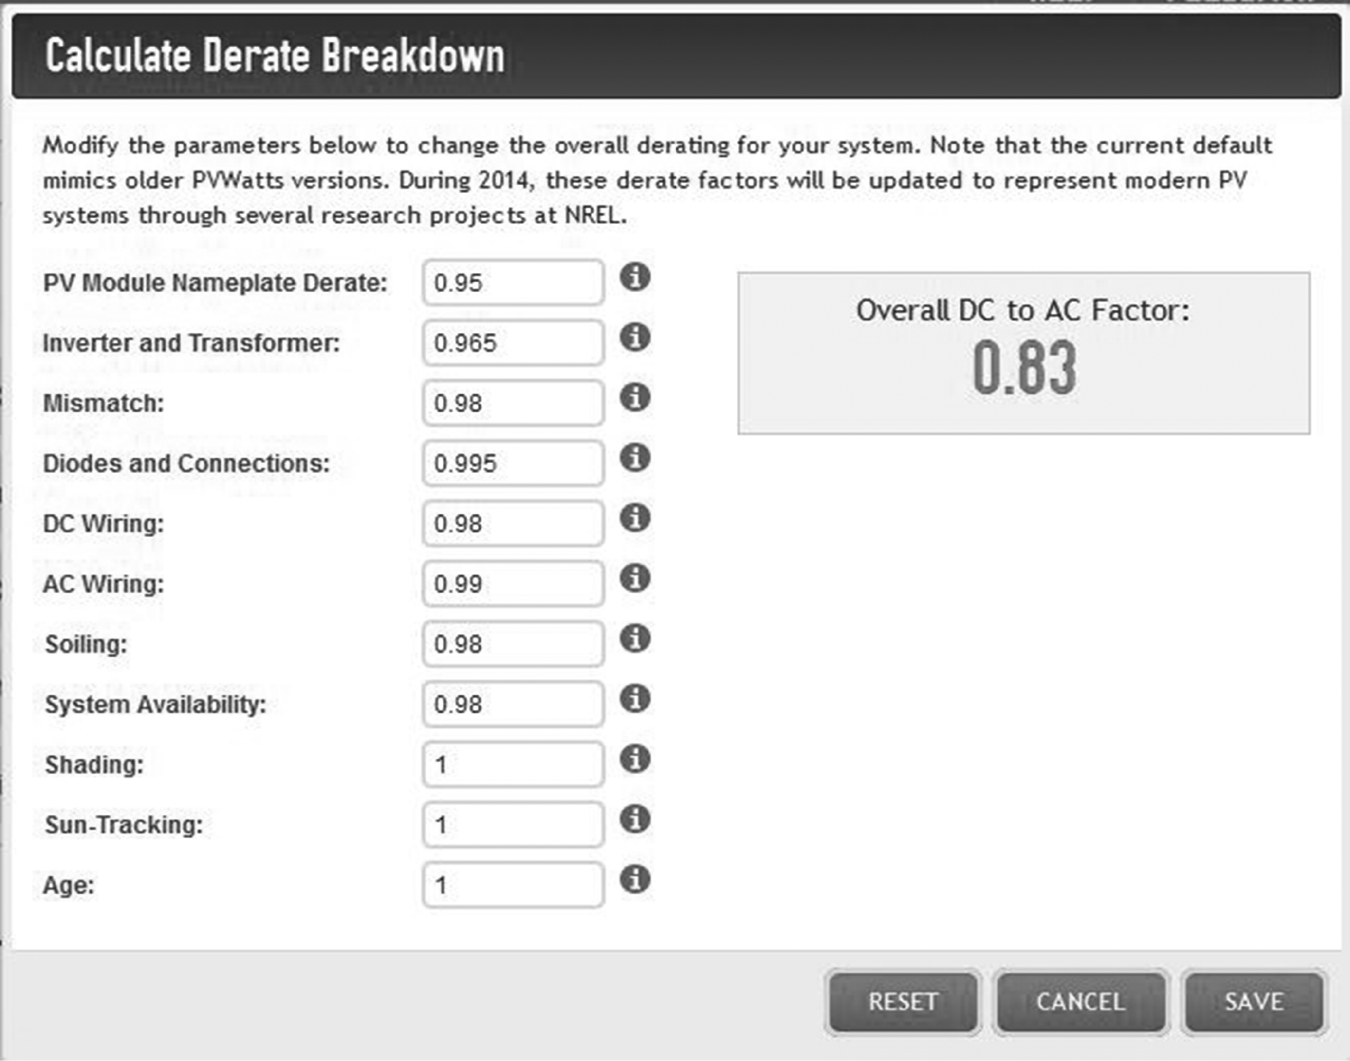
□ In order to determine the system losses, click on the “Derate Calc” button.
□ Enter 0.965 into the “Inverter/transformer” fill-in box, for the inverter efficiency (e.g., SB3000TL-US-22 (240 V), a 3 kW transformerless inverter).
□ Enter 2 into the “Soiling (%)” fill-in box. Enter “0” into the Shading (%) box.
□ Leave all other fill-in boxes with their default values.
□ Click on “Save.”
This should result in a DC–AC derate factor of 0.83, as shown in Figure 4.9.
□ Click on “Save” and the number 11.42 will be transferred to the System Losses (%) box.
□ Enter a tilt of 18° (4:12 roof pitch) and an azimuth of 180° (south).
□ Click on Advanced Parameters.
□ Enter “96.5” into Inverter Efficiency (%) box.
□ Choose “Residential” for system type.
□ Enter “0.16” in the fill-in box for average cost of electricity, but do not enter other information.
The main page should look like Figure 4.10.

□ Click on the right arrow, “Go to PVWatts results.”
□ The resulting page should look like Figure 4.11.
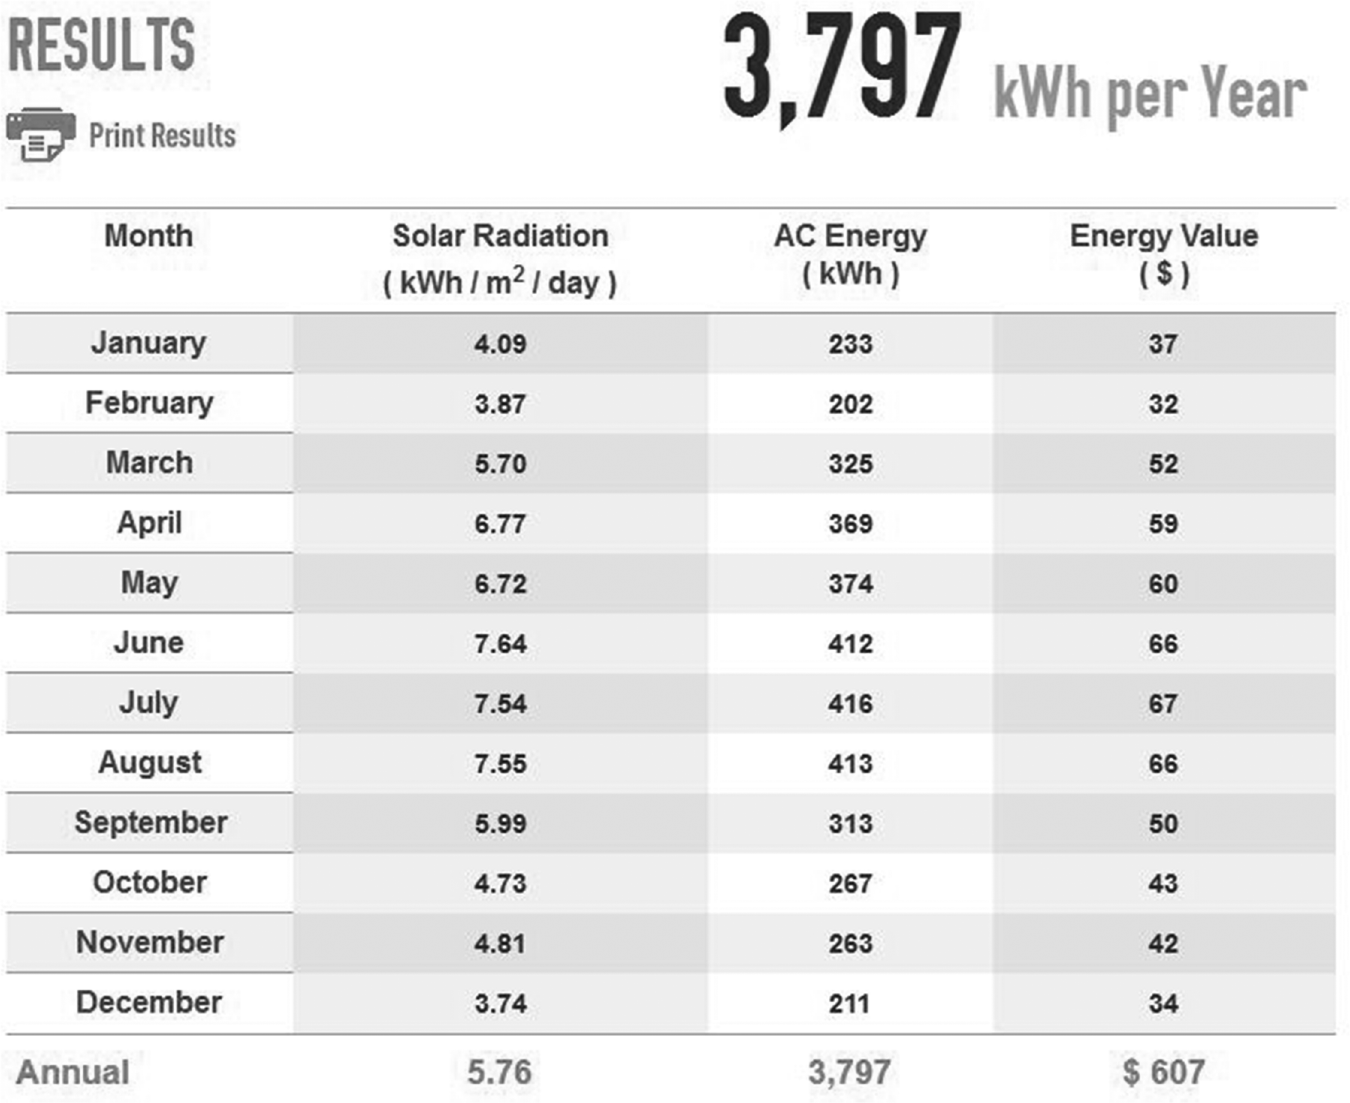
The first column in Figure 4.11 is the insolation for the array averaged over each month. This is a function of the site location, tilt, and azimuth. This information is akin to the data contained in the solar redbook and other sources. It is not a function of the PV modules or inverter. The second column is the AC energy production for the system for each month of the year. This now takes into account the PV equipment and insolation data. The third column dollarizes the energy production using the cost of electricity (in this case $0.16/kWh).
At this point, none of these data take into account the effects of shading. In order to do this, the monthly AC energy needs to be entered into the table in Figure 4.8. We enter the daily insolation data as well for completeness, even though it is not used in the calculation.
The entries in the final column, “AC Energy w/Shading,” are the product of the “AC Energy No Shading” entries and the “Shading Factor” entries.
□ Calculate the “AC Energy w/Shading” for each month and sum the data over all the months to get a total for the year. The result should look like Figure 4.12.
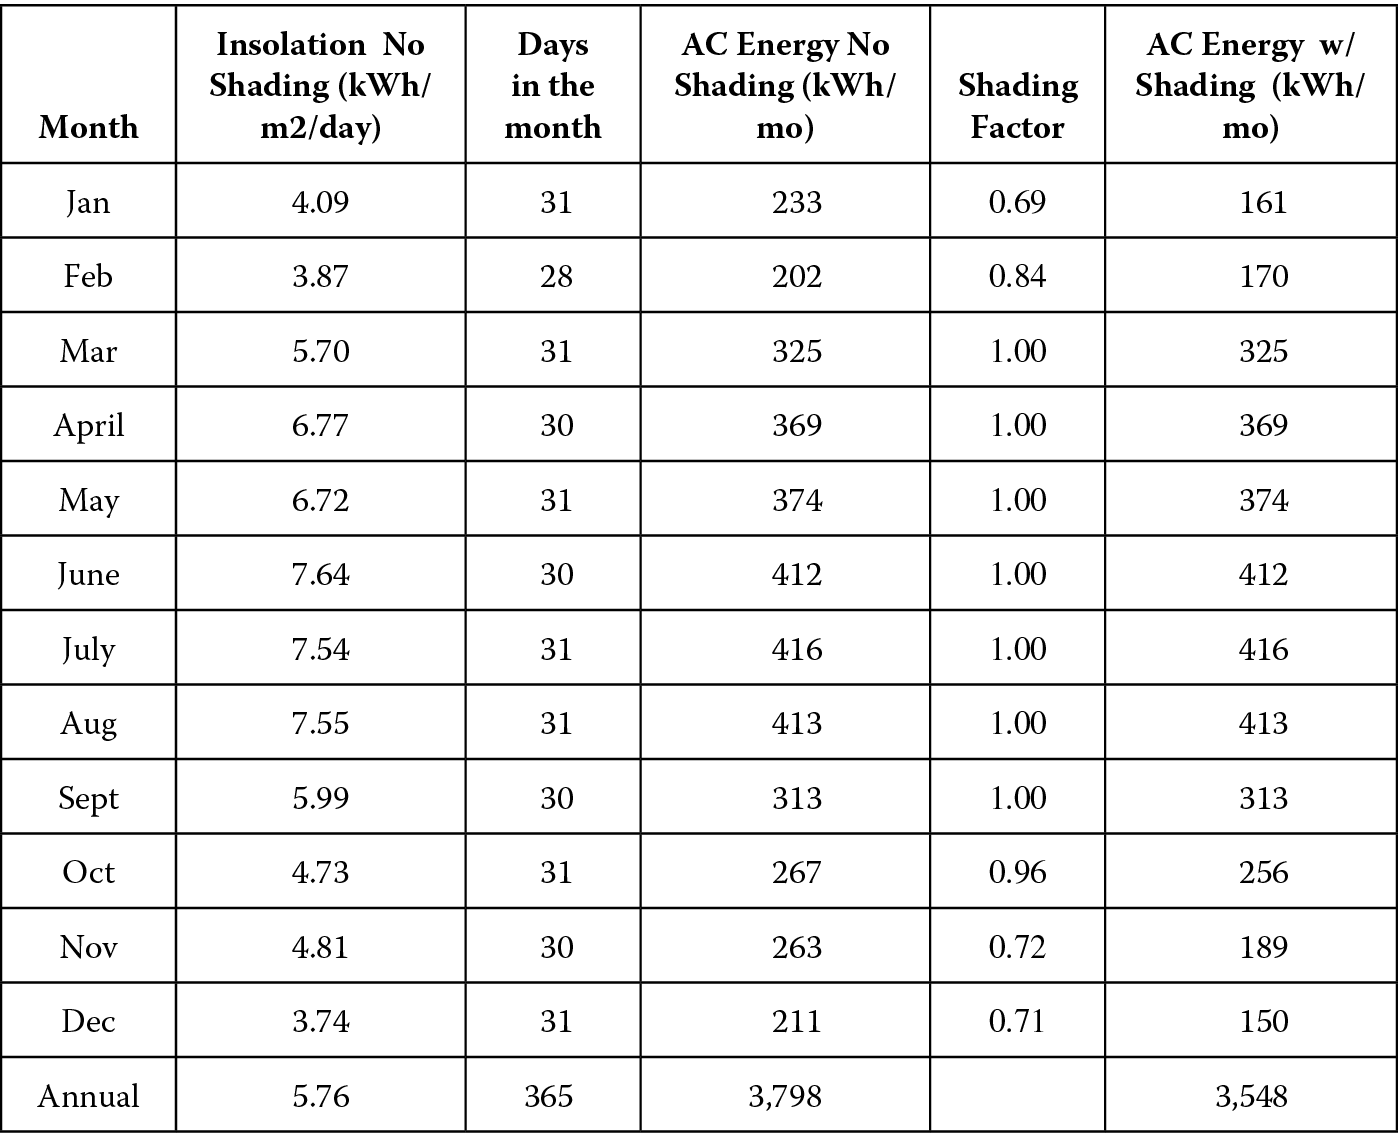
Completed energy with shading calculation after entering energy per month (unshaded) and shading factor.
4.8.2 Performing an Advanced Shading Analysis Using the SolarPathfinder
We can speed up the process of getting a shading analysis by using the SolarPathfinder Assistant (SPA) software and using digital images of the sun path traces. The SPA software also links to PVWatts so that we do not have to do a separate PVWatts calculation. The SPA software then calculates the “AC Energy with shading” and produces a report.
□ Remove the dome and take a photo of the skyline trace on the sun path graph paper while it is still in the instrument section.
□ Upload the trace images to your computer.
□ Start the SolarPathfinder Assistant and start a new report.
□ Fill in the following information:
- Report name
- Notes
- Report type: choose PV
- Site location finder: choose zip code
- Tilt angle: enter 18°
□ Click on “Next.”
□ Choose south to be 180°.
□ Enter compass azimuth (or true south if using a GPS-based compass).
□ Leave the “Ideal Tilt” and “Ideal Azimuth” at their default values.
□ Click on “Next.”
□ Choose inverter make and model.
□ Choose panel make and model.
□ Enter the inverter count and PV module count.
□ Click on “Next.”
□ Enter the DC-to-AC derate factor data: inverter efficiency of 0.965 and soiling of 0.98.
□ Click on “Next.”
□ Enter in the number of skyline measurements per roof section.
□ Crop and calibrate each image.
□ Trace the images.
□ Click on “Create Report.”
The report will be automatically generated and saved. The most important column will be the “Actual Un-shaded AC Energy,” by month.
4.8.3 Performing a Shading Analysis Using the Solmetric SunEye®
The Solmetric SunEye has a built-in fisheye camera, a GPS compass, and an electric level. Thus, it is able to automate the process of capturing skylines. The SunEye can be connected to a computer where the finishing touches can be made on the skylines and a shading report can be generated. Because of the ease of taking skyline images, the SunEye allows a site surveyor to take dozens of skyline images without a great deal of effort.
□ Make sure that the SunEye is fully charged before using.
□ Connect the power cable, if need be, and start the SunEye by pressing the yellow button.
□ Click on “New Session” and give the session a name, usually the name of the client. Add any notes you believe would be useful later. Click on “Next.”
□ Decide which method to use to identify the location of the site. With the model 210 GP, the SunEye will get the location via GPS satellites. With the non-GPS version of the model 210 or with the model 100, the best way to enter the site location is to choose a city and state.
This completes the entry of the session properties.
□ Click the icon at the lower left-hand corner of the screen and click on “Skyline.”
□ Click on “New.”
□ Choose “Fixed” (axis); “Azimuth,” choosing true or magnetic, and tilt. Click on “OK.”
□ Level the SunEye and align it to true south and click on “Snap.”
□ Create a skyline at each of the corners and at the center of the roof section in question.
□ Annotate the location of these multiple skylines (e.g., “SE corner, roof section #1”).
□ If necessary, click on the green and yellow paintbrushes to edit the image, erasing spurious shading or to add shading that was missed. Click on the X and choose “Apply Changes.”
□ Repeat this process for all roof sections that will have PV modules.
You have the choice to create a new session for each new roof section or to annotate the skylines adequately so that it is obvious which skylines go with each roof. The latter choice is more appropriate, since the Solmetric software allows you to choose which skylines are to be used for a given shading analysis.
At this point we will launch the Solmetric software on a computer, upload the SunEye images, and produce shading reports:
□ Launch Solmetric software.
□ Click on “File.”
□ Click on “Transfer from device.”
□ Click “Next.”
This will download all new sessions and erase them from the SunEye.
□ Click on “Session” and “Browse.”
□ Click on the session you want to use and click “Open.”
□ Click the icon at the lower left-hand corner of the screen; click on “Skyline” and click on “Browse.”
□ Choose the first skyline and click on “Open.”
□ Use the paintbrush tools to edit the skyline and click on the X and click on “Apply Changes.”
□ Edit all of the skylines.
□ Click on “File” and then click on “Export Session Report and Data.”
□ Fill in the client information and click “Next.”
□ Fill in the site surveyor information and click “Next.”
□ At this point you can choose which skylines are used to create a shading report. Usually these are the skylines for a single roof. Click “Next.”
□ Choose the file format for the report. A .pdf file format is best for our purposes.
□ Choose the directory where the report will be saved.
□ Add a company logo if desired.
□ Click “Export.”
□ The resulting report will consist of a cover page, a summary shading analysis (averaging over the chosen skylines), and shading analyses for each skyline.
□ Copy the monthly solar access averages from the summary page into the “Shading Factor” column in Figure 4.8.
□ Multiply the “AC Energy No Shading” by the “Shading Factor” to get the “AC Energy with Shading.”
□ Sum the individual monthly entries to an annual AC energy.
4.9 Summary
We have used three separate techniques to calculate an estimate of AC energy production for a given PV array: manual SolarPathfinder, SolarPathfinder Assistant, and SunEye. Each has its own benefits.
The totally manual SolarPathfinder is straightforward but quite laborious. It does have the pedagogical merit that the process makes it extremely clear how shading analysis can be used in conjunction with AC energy estimation software to predict the performance of a PV system.
The basic SolarPathfinder used in conjunction with SolarPathfinder Assistant software still requires handcrafted traces, but by using a digital camera, the traces can be processed by a computer program, eliminating the tedious reading of the sun path traces. It also has the benefit of performing the basic AC energy calculation as well, eliminating the need to use PVWatts. The report contains quite a bit of information, in addition to the crucial AC energy with shading data.
The SunEye tool, especially with GPS, makes quick work of the job of creating skylines. The report looks quite professional. However, to arrive at a number for AC energy with shading still requires the use of PVWatts.
For the site surveyor, the SunEye is obviously the best tool to use. However, the SolarPathfinder’s cost is a quarter of the SunEye. Thus, as a pedagogical tool or if shading analyses do not need to be done that often, the SolarPathfinder may be quite adequate for the task.
Notes
1. The underlying concept to a shading analysis is the sun as an energy resource. It is assumed that this concept has already been covered in the companion lecture sequence to this laboratory, but it will be covered again to make sure that this extremely important piece of the site survey is understood and applied accurately.
2. In 1979, the city of Los Angeles adopted an ordinance establishing historic preservation overlay zones to provide for review of proposed exterior alterations and additions to historic properties within designated districts.
3. See “Bringing Solar Energy to the Planned Community,” T. Starrs, L. Nelson, and F. Zaleman (www.doc.gov/bridge).
5. In rare cases, a 28 ft. extension ladder may be needed for two-story buildings.