
Every Enterprise system is prone to performance issues and errors despite best practices being employed. Having looked at Fusion Applications monitoring in the previous chapter, you may have an understanding of what conditions invoke a need for troubleshooting. Since Fusion Applications is a complex enterprise system with large number of components involved, troubleshooting Application-related issues includes a vast variety of techniques and starting points for performance diagnosis. Starting the troubleshooting with the most logical component is the key here. Proficiency in Fusion Applications troubleshooting may be developed over the period of time and once you have worked on a breadth of diagnostic tools, the time taken for effective diagnosis and problem resolution may reduce drastically.
Troubleshooting Tools and Features
In this section we look at some of the common tools and features of Fusion Applications that assist us in diagnosing and troubleshooting the performance issues and error conditions. We will begin with Fusion middleware-related important files and features. Later we move on to Fusion Applications-specific troubleshooting tools and best practices to be followed for agile problem solving.
Important Files Related to the Topology
If you were not involved during the initial provisioning of the Fusion Applications environment, then you may want to review the instance topology of the environment that you are going to administer and troubleshoot.
Provisioning Summary File: The Provisioning wizard would have created an initial environment summary file at the same location as the response file. For example, /app/fusion/provisioning/bin/provisioning-<timestamp>.summary. You can review this summary file to get a quick understanding of the environment, including all domains, URLs, and so on. But if the environment topology had changed after initial installation, this file will no longer be relevant.
Domain Registry File: The Fusion middleware base directory contains a file named domain-registry.xml that contains the list of WebLogic domains configured in the environment along with the location of the home directory for each domain. For example, /app/oracle/fusionapps/domain-registry.xml for Fusion Applications nodes and /app/oracle/products/app/domain-registry.xml for IDM nodes.
Domain Configuration File: Another important file is config.xml, which contains the configuration details for each domain. You can see the list of ports, including the Administration server port for the domain in order to log in to the Administration console. This is located at <Domain_Home>/config/config.xml for each of the domains.
Web Tier Virtual Host Configuration Files: Depending on whether you have selected name-based, IP-based, or port-based virtual host mode, you need to know the virtual host and port details for each product family in order to access certain URLs. This information is stored in HTTP port mapping and the redirection files located at <OHS_INST_TOP>/config/OHS/ohs1/moduleconf/FusionVirtualHost_<pf>.conf, where pf refers to the product family. For example, /app/oracle/instance/CommonDomain_webtier/config/OHS/ohs1/moduleconf/FusionVirtualHost_hcm.conf.
Important Fusion Middleware Log Files
You may need to access various log files while troubleshooting and diagnosing various issues, errors, and crashes, including while starting up the environment. The following are some of the important log files that you may access when troubleshooting. We will look at application logging in next sections.
1. WebLogic server logs and output files
Domain Log: The overall domain log file <DomainName>.log and the Administration Server log file AdminServer.log are created at <Domain_Home>/servers/AdminServer/logs.
Managed server log: The WebLogic server container log file <ManagedServer_name>.log for each managed server is created at <Domain_Home>/servers/<ManagedServer_name>/logs.
Standard output: For each managed server, the standard output and errors are redirected to a file named <ManagedServer_name>.out, which is located in the same directory as the log file.
Diagnostic log: Application diagnostics are stored in log file named <ManagedServer_name>-diagnostic.log for each WebLogic server and saved along with log and output files at same location.
2. BI-server related log files
BI server OPMN log file: The OPMN related log files for the BI server are located at <APPLICATIONS_CONFIG>/BIInstance/diagnostics/log/OPMN/opmn.
BI server components log files: The log files for the BI server components are located at <APPLICATIONS_CONFIG>/BIInstance/diagnostics/logs/<process_type>/<Component_name>. For example, the log files for the BI server component are stored at /app/oracle/instance/BIInstance/diagnostics/logs/OracleBIServerComponent/coreapplication_obis1.
3. Oracle HTTP server related log files
OHS Server OPMN log files: The OPMN related log files for Oracle HTTP server are located at <OHS_INSTANCE_HOME>/diagnostics/logs/OPMN/opmn. These files can be used to troubleshoot issues specific to the OPMN configuration.
OHS server log files: The OHS server log file is located at <OHS_INSTANCE_HOME>/diagnostics/logs/.
Access log: The OHS Server access log file (access.log) is created in the same location as the OHS server log file. This helps in troubleshooting the incoming requests to the web server along with source IPs and return code.
WebGate process file logger: The WebGate process logger is located in the same directory and named oblog.log. It may help troubleshoot WebGate specific errors.
Problems and Incidents
Fusion Applications diagnostic framework provides automatic problem detection and information collection features, namely problems and incidents. When an application request from a user or an implicit call fails with serious errors without any immediately available resolution, then Fusion Applications creates a Problem record. The Problem record has a unique key with the [Product Short Code]-[Error Number] format; for example, BEA-000337. Incidents could be created automatically by Fusion Applications or a support personnel can manually create an incident by manually adding relevant information at the time of problem which may assist in troubleshooting the problem.
An incident directory contains various ZIP files containing important log files and dumps collected at the time to assist during troubleshooting. The following are the contents of automatically created incidents. This can vary depending on the type of incidents and it may create more or fewer logs than the listed here.
Application Diagnostic Logs including QuickTrace
JVM Thread Dump
WebLogic Server Diagnostic Image including JFR (JRockit Flight Recorder)
DTF (Diagnostic Test Framework) reports
ADF (Application Development Framework) configuration
PL/SQL Logs
A README file for the incident
The WLS diagnostic image ZIP file contains a file named JRockitFlightRecorder.jfr, which acts as a black box recorder with detailed information about the activities within JVM. This file can be read by a tool named JRockit Mission Control. We will also look at QuickTrace and the JVM Thread Dump in upcoming sections of this chapter.
Accessing Incidents
If you have managed an 11g database as an administrator then you may have already worked with incidents, which were introduced in the 11g database and later rolled out to other Oracle products. Fusion Applications implements similar mechanisms for storing and viewing each incident. Each incident is stored in a dedicated directory on a file system and contains a number of logs and ZIP files. You must monitor the growth of the incident home directories, especially when moving the incidents that have already been addressed.
Table 15-1 shows typical locations for the incident directory for every type of incidents. Note that the ADR_BASE directory location is <DOMAIN_TOP>/servers/<Server_Name>/adr for WebLogic server domain while for database server the ADR_BASE file is typically the same as the ORACLE_BASE or a directory within it.
Table 15-1. Incident Directories Location for Each Components
Incident Component | Incident Directory Location |
|---|---|
Fusion Middleware | <ADR_BASE>/diag/ofm/<domain_name>/<server_name>/incident |
Java/SOA Composite | <ADR_BASE>/diag/ofm/fusionapps/<application_name>/incident |
PL/SQL Code | <ADR_BASE>/diag/ofm/<db_name>/<db_instance>/incident |
Oracle Database | <ADR_BASE>/diag/rdbms/<db_name>/<db_instance>/incident |
There are various ways of viewing an incident, including the command-line interface. However, Oracle recommends using Support Workbench or Incident Manager only to access and view incidents since it provides a much simpler and more efficient way to working with incidents. The prerequisite for using Support Workbench is to have Enterprise Manager Cloud Control configured in your environment. The following are various ways to access the incidents in Cloud Control.
Clicking on the incident count in the Monitoring and Diagnostics section of any product or domain page
Accessing through Product Menu ➤ Diagnostics ➤ Support Workbench
Accessing through Enterprise Menu ➤ Monitoring ➤ Incident Manager (or using the keyboard shortcut Ctrl+Shift+I) from any page
Figure 15-1 shows the Incident Manager home screen showing a list of all currently open Incidents. You can also access the list of all open problems from the Tasks link in the Regional area. Selecting any of the incidents from the list populates detailed information about the selected incident in the lower region of the screen, as shown in Figure 15-1. You may also collapse this region to view the incident details in a larger window.

Figure 15-1. Accessing open incidents
The advantage of using Support Workbench to access incidents is that it provides immediate access to relevant support knowledge base along with guided diagnostics for the selected incident. It also allows you to view recent configuration changes to see if there was any impact. You can view the collected diagnostics dumps, see the results of automatically triggered diagnostic tests, and use the guided resolution process.
Log Viewer
Fusion Applications log files provide a wealth of information for troubleshooting, including Fusion middleware related logs as well as information gathered through the Application loggers. As you saw in an earlier section, automatically created incidents contain important information from these log files but at times we must access these log files manually in order to diagnose a problem. You can always view the log files directly from the operating system but Fusion Applications control and Cloud Control provide Log Viewer functionality that allows you to search, browse, and look up content in the log files in an easily readable format. The log viewer also detects distinct events, problems, and errors and displays them on the summary page.
Viewing and Editing Log Configuration
You can view the log configuration of a WebLogic server by manually reading the logging configuration file logger.xml located at <DOMAIN_HOME>/config/fmwconfig/servers/<ManagedServer_Name>. This file includes details about the maximum size of log, rotation policy, log handlers name, the severity of logging, and so on. Instead of manually reading through the logging configuration files, you can use the Logs ➤ Log Configuration menu on any WebLogic server page in Cloud Control to launch the Log Configuration page, as shown in Figure 15-2. You see three tabs in this page. The first two tabs are related to regular diagnostic logs configuration while the last tab is related to QuickTrace configuration that we will see in next section.

Figure 15-2. Diagnostic log level configuration screen
The default level for the root logger and all the other loggers is SEVERE so it only stores a high level of logging when severe errors occur. It is not recommended to keep this level higher for regular operations since it may incur an additional load on the server.
As you can see in Figure 15-2, you can specify two types of logging levels for each logger.
Runtime or non-persistent log level: This is the default setting for all runtime loggers. Any change you make in the Oracle Diagnostic logging level remains applicable only until the component is restarted.
Persistent log level: When you select a log level to be persistent across restarts by selecting the checkbox at the bottom of the screen, this level persists even after a component is restarted.
Let’s look at the second tab on the Log Configuration screen, called Log Files Configuration, as shown in Figure 15-3. This page displays the default log files path for each log handler along with the log rotation policy. This helps you quickly locate the log files if you are not sure about the location of required logs. This page should be left unchanged unless there is an absolute need and justification to change it.

Figure 15-3. Log files configuration screen
Now let’s see how you can view the log messages and files manually. Open the Cloud Control page for the WebLogic server for which you want to see the important log messages. Choose Logs ➤ View Log Messages from the WebLogic server menu to access the Log Messages screen, as shown in Figure 15-4.

Figure 15-4. Viewing important log messages
In the Log Messages screen, you can select the type of messages to be searched and displayed or even the messages containing specific text instead of going through the complete contents of log files. The table shows the filtered messages along with the log filename and time of occurrence. You may also save the search query to view the same type of messages again without having to search again.
Viewing and Downloading Logs
Clicking on any of the log filename in this screen will open View Log file page for the selected log file, as shown in Figure 15-5. The messages being displayed are specific to the selected log file. You can set a refresh interval to monitor the log file messages when an activity is being performed at the application level. This page also gives you an option to download the complete log file offline and view it manually or send it to Oracle support. Make sure to remove any sensitive data before sending the log files to Oracle Support or any third-party consultants.

Figure 15-5. Viewing a specific log file
QuickTrace
As you saw earlier, logging can be set at various levels to change the degree of log being collected in order to analyze errors and system performance. However, logging uses the native I/O functionality of the operating system and hardware, which is generally slow and beyond the control of Fusion Applications. This adds up to the resources consumption and may degrade the performance of the application, especially if logging is set to FINE or a similar level. So there is a trade-off here—keeping logging set to SEVERE or another high level of logging will provide limited log information, but setting it to FINE or another low level logging will provide a good amount of data but at a performance cost.
In order to resolve the this dilemma, Oracle has introduced QuickTrace. The difference between QuickTrace and regular logging is that QuickTrace logs the information in memory buffers instead of writing it on disk. This eliminates the I/O drag, hence reducing any performance bottlenecks. QuickTrace is not a replacement of logging, but it can be enabled or disabled in addition to the existing logging and is independent. By default QuickTrace logs at the FINE level and the amount of data contained in it is limited by the size of the buffer specified. It allows you to view the current activities in the WebLogic server while troubleshooting without manually enabling a low level of logging temporarily without affecting the performance of the system.
Setting QuickTrace Related Profile Options
We can set the QuickTrace related parameters using the profile options or the QuickTrace configuration screen, which is similar to the normal application log configuration seen earlier. Let’s first look at how to enable/disable QuickTrace and set its important configuration values using profile options. Open the Manage Administrator Profile Options Task using the Task Search work area in the Function Setup Manager. You can search the two most important profile options related to QuickTrace by querying AFLOG_QUICKTRACE_% in the Profile Option Code field, as shown in Figure 15-6.

Figure 15-6. Setting QuickTrace related profile options
You will see the following two profile options in the results table:
AFLOG_QUICKTRACE_ENABLED: The value of this profile (FND: QuickTrace Enabled) determines whether QuickTrace is enabled. If the value is set to Yes at the site level, it enables QuickTrace across the application unless it’s set at any other level, which may override the site-level value. Set the value to No to disable QuickTrace.
AFLOG_QUICKTRACE_LEVEL: The value of this profile (FND: QuickTrace Level) determines the level of logging in the memory buffers. The default value is Fine at the site level and this can be overridden by setting it a further level down.
Manually Invoking QuickTrace
By default QuickTrace is created when a critical error occurs and an incident is being created and placed within the incident directory. We can also manually dump QuickTrace if an incident is not created or if its requested specifically by Oracle Support. Let’s see how to generate the QuickTrace dump manually.
From the homepage of the WebLogic server for which we need to generate QuickTrace dump, choose the WebLogic Server ➤ Logs ➤ Log Configuration menu option. Once the Log Configuration page is open, click on the QuickTrace tab. This will display the currently configured QuickTrace handlers, including the custom created handlers if there are any, as shown in Figure 15-7.

Figure 15-7. QuickTrace configuration
You can view the existing handler configuration by clicking on the View button. In order to manually generate QuickTrace dump, click on the Invoke QuickTrace Dump button. The next screen will prompt you whether you want to use the common buffer or a user-specific buffer if the handler is configured to log user specific trace as well.
Editing a QuickTrace Handler
Let’s look at how to edit an existing QuickTrace handler. The Create new Handler screen prompts for same input values as seen in this screen. Figure 15-8 shows an example of editing the existing QuickTrace handler.

Figure 15-8. Editing a QuickTrace handler
The following are the important parameters of interest in this screen:
Buffer size: The default value is 5242880 bytes (5 MB). This value determines how much memory to allocate for this buffer. Ideally, this is enough to log recent issues with the WebLogic server but this can be adjusted in case there are a lot of errors being encountered and if it is not accommodating the required time window.
Handler level: The default value is FINEST, which is same as the one set at site level profile option. It is not recommended to change this since it may defeat the very purpose of QuickTrace.
Loggers to associate : By default, oracle.apps.quicktrace logger is used but if you are troubleshooting a component-specific issue then you may also want to include an additional logger in QuickTrace. The list of values allows you to select multiple loggers at the same time.
User buffer-related parameters: Another important set of parameters in this screen is related to whether you want to trace a specific user to generate a trace for a specific issue. In this case, you can select the Enable User Buffers checkbox. If User Buffer is enabled then you may need to enter the username in the field called User Names for Reserve Buffer.
Diagnostic Dashboard
Fusion Applications provides pre-seeded diagnostic tests to manually check whether an application functionality is working. This tool can be used to either perform a routine health check, diagnose and troubleshoot a problem with a specific application, or collect data to be provided to Oracle Support. In order to access the Diagnostic Dashboard, you must first configure access to it for the selected users. You must decide which users need to run diagnostic tests and what level of access should be granted to these users based on the following four available job role options:
Diagnostic Viewer: This role allows you to view results of already executed Diagnostic tests. This role is mainly suggested for consultants who may need to analyze the results and provide appropriate suggestions.
Diagnostic Regular User: This role allows you to run diagnostic tests, view their results, and cancel tests you start if required.
Diagnostic Advanced User: This role is an extension of the Diagnostic Regular User and allows you to attach test results to incidents in order to prepare data for sending to Oracle Support.
Diagnostic Administrator: This role provides complete access to all the features of Diagnostic Dashboard, including cancelling tests initiated by others, purging results, and so on.
Note
Fusion Applications currently allows access to diagnostic tests for all applications based on the selected job role and the results may contain some sensitive data based on the test being run. Be careful before assigning diagnostic job roles to users who must not see any data accidently.
Table 15-2 provides a summary comparison of these roles in order to access which user should be granted what role.
Table 15-2. Comparison of Roles that Provide Access to the Diagnostic Dashboard
Job Role Name | View Results | Run Tests | Cancel Tests by Others | Attach Results to Incidents | Purge Results |
|---|---|---|---|---|---|
Diagnostic Viewer | Yes | No | No | No | No |
Diagnostic Regular User | Yes | Yes | No | No | No |
Diagnostic Advanced User | Yes | Yes | No | Yes | No |
Diagnostic Administrator | Yes | Yes | Yes | Yes | Yes |
There are two types of diagnostic tests available in the Diagnostic Dashboard.
Internal Diagnostic Tests: These tests require the related application to be available since the test or part of the test runs within the application.
External Diagnostic Tests: These tests do not require the related application to be available and can diagnose problems in the application even if it’s not running.
Fusion Applications provides two interfaces to run diagnostic tests. The Diagnostic Dashboard that we are going to see now and the command-line utility named diagctl. Note that diagctl cannot run internal diagnostic tests but the Diagnostic Dashboard can run either type. In fact, the Diagnostic Dashboard can also be used to make sure whether a test is internal or external. We will look at how to check this in next section when you see how to run a diagnostic test.
Accessing the Diagnostic Dashboard
There are multiple ways to access the Diagnostic Dashboard depending on which interface you are currently logged in to. Let’s look at each of the ways to navigate to the Diagnostic Dashboard.
Accessing through the Fusion Applications interface: If you are logged in to the Fusion Applications interface using an application user that has been assigned any of the diagnostic roles discussed earlier then you will see a link titled Run Diagnostic Tests from the User menu ➤ Troubleshooting section, as shown in Figure 15-9. Click on this link to launch the Diagnostic Dashboard.
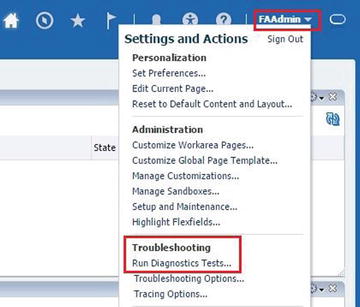
Figure 15-9. Accessing the Diagnostic Dashboard using the Fusion Applications interface
Accessing through the Cloud Control interface: You can access the Diagnostic Dashboard from the product family homepage for which you want to run or view the diagnostic tests by choosing Diagnostics ➤ Fusion Applications Diagnostic Dashboard, as shown in Figure 15-10. You can see a small arrow in front of this link that suggests that it points to an external page from Cloud Control. In this case it points to the Diagnostic Dashboard application of the selected product family. You will need to log in using your applications username before you can access the dashboard.

Figure 15-10. Accessing Diagnostic Dashboard using Cloud Control
Accessing using a direct URL: If you are not logged in to either interface or you want to access Diagnostic Dashboard as part of your routine job then you can bookmark the following URL. It will prompt you to log in as a Fusion Applications user with appropriate job roles.
http(s)://<ProdctDomainHostname>:<WebPort>/diagnosticDashboard/faces/DiagnosticDashboard
For example:
https://fahost.paramlabs.com:10634/diagnosticDashboard/faces/DiagnosticDashboard
Note
Diagnostic Dashboard is deployed as a J2EE web application in each product domain as part of the diagnosticDashboard module of DiagnosticsUI-Assembly Application deployment. This allows you to launch the web application directly using the provided URL.
Running Diagnostic Tests
You may need to run various Fusion Applications diagnostic tests to periodically perform health checks of specific components, check an application’s setup, troubleshoot issues, compare the performance with last know good performance, or even generate incident logs for Oracle Support. You can search for specific diagnostic tests or browse through all the available tests on the Diagnostics Dashboard. The following is the list of steps required in order to execute one or more diagnostic tests.
1. Select all the diagnostic tests that need to be run by browsing through the list or by searching them one by one and clicking on Add to Run button. This will add the jobs to the Run queue. As you keep on adding the jobs, the list on the top right pane will continue to populate with these jobs.
2. Next you can select all or specific tests in the Run Queue table to be executed in a single group. You can optionally specify a unique name for the tests execution in the Run Name textbox.
3. If any of the tests require any input parameters before running then you may see an warning or exclamation icon in the Input Status column. You may click on this icon to display the Input Parameters window. Enter the required values to make sure the column now displays the value as Required Input Parameters Validated.
4. You may want to know whether all these tests can be run now or any of the selected test is internal and requires an application to be running. Select all the tests that you want to check and then choose the View ➤ Availability menu item to display the Availability window. Make sure the Availability Column shows check/tick mark for all the selected tests. If you see a warning sign then either any dependent application, Java class, or PL/SQL procedure may be unavailable or the user may not have the required permissions. If the dependent application for the internal diagnostic test is not available then you will see this error message: The following Web Applications were inaccessible. Fix the stated issues before moving on to the next steps.
5. Once the required checks are complete, click Run to execute the selected diagnostic tests. Once the tests are complete, the bottom pane will display diagnostic test results in an expandable list based on job run name. You can now analyze the test results and take appropriate corrective action if required.
Figure 15-11 shows a summary of these steps by highlighting each of the activities.

Figure 15-11. Running diagnostic tests
Tracing Fusion Applications Issues at Database Level
During the course of troubleshooting you may want to troubleshoot the SQLs running in the database, especially when you have verified that network or application server is not causing the performance bottleneck. There are various ways to check the currently running SQLs in the database, but the most effective option is to enable trace on specific sessions or applications for short durations and then analyze the trace files for further analysis. In this section, we will look at database tracing at the application level as well as at the Enterprise Scheduler level depending on where the performance issue persists.
Tracing Fusion Applications Sessions
Before you look at SQL tracing of Fusion Applications session, you need to know that the Troubleshooting menu is not enabled by default for all users. Table 15-3 lists the duty roles that, if included in the respective job role, enable the troubleshooting option for the user.
Table 15-3. Duty Role Options for Enabling the Troubleshooting Menu
Duty Display Name | Product | Duty Internal Name |
|---|---|---|
Supportability Level Management Duty | CRM | FND_SET_SUPPORTABILITY_ LEVEL_DUTY_CRM |
Supportability Level Management Duty | FSCM | FND_SUPPORTABILITY_ LEVEL_MANAGEMENT_DUTY_FSCM |
Supportability Level Management Duty | HCM | FND_SUPPORTABILITY_ LEVEL_MANAGEMENT_DUTY_HCM |
Note that by default no user level job role is seeded with these duty roles except for the following two job roles.
Application Administrator (FND_APPLICATION_ADMINISTRATOR_JOB)
Application Diagnostics Administrator (FND_DIAG_ADMINISTRATOR_JOB)
As you can see, these are administrative job roles, so you should not assign these to any non-administrator users just to enable troubleshooting options. Instead, create a new job role or include these duty roles in any existing functional job roles.
Now let’s look at how to enable database tracing for any regular application session in order to trace the functional flow or performance issues with the application. Note that you must disable the additional tracing that you enable for troubleshooting because it may adversely affect application performance by additional load and generating excessive logs even when it’s not required. Once you are logged in to Fusion Applications, open the page that you want to select as the starting point of the trace in order to avoid unnecessary data. Now click on the user menu and choose Troubleshooting Options under the Troubleshooting section. This will launch the Tracing and Logging options screen, as shown in Figure 15-12.

Figure 15-12. Enabling trace in a Fusion Applications session
In this screen you can select various combinations of DB trace; for example, DB trace without bind or waits, with bind, with wait, with bind and wait, and same options along with or without PL/SQL profiler, and so on. Once you click Save and Close, any further application navigation creates database trace, which is created in the user session trace dump (user_dump_dest) specified in the database. Since there could be many traces available in this location, it’s important to understand how to locate the corresponding trace file for this particular session.
Once trace is enabled in an application, you may need to locate the browser cookie related to this host and session. Note that depending on browser, the procedure to locate cookies will be different. Figure 15-13 shows an example of a cookie for a host named fahost.

Figure 15-13. Looking up FND session cookie values
Once you have located the cookie, you need identify the value for ORA_FND_SESSION_FUSIONDB. The value is prefixed by DEFAULT_PILLAR and contained between two colons (:). In this example, the parameter value in the cookie is Bcn2SB+mJE7IKhPMouXUaWwlSt8wKZuhZKGYBHdpGonR+Lofpe9Bj4qs0HisUYqF. Now let’s locate the database session ID corresponding to this value by using following query:
SQL> select (fnd_session_mgmt.get_session_id_from_cookie('Bcn2SB+mJE7IKhPMouXUaWwlSt8wKZuhZKGYBHdpGonR+Lofpe9Bj4qs0HisUYqF')) SESSION_ID from dual;
SESSION_ID
--------------------------------------------------------------------------------
130AA3E60F561481E053B501A8C0E0F8
Now we can locate the database trace files generated for this application session by using this database session value. We can locate the database trace files with this value as the postfix in the user trace dump location. For example:
[fusion@fa9host trace]$ ls -l *130AA3E60F561481E053B501A8C0E0F8*
-rw-r----- 1 fusion dba 237788 Apr 6 13:33 fusiondb_ora_5178_130AA3E60F561481E053B501A8C0E0F8.trc
-rw-r----- 1 fusion dba1439 Apr 6 13:33 fusiondb_ora_5178_130AA3E60F561481E053B501A8C0E0F8.trm
-rw-r----- 1 fusion dba 26416 Apr 6 13:33 fusiondb_ora_5247_130AA3E60F561481E053B501A8C0E0F8.trc
-rw-r----- 1 fusion dba345 Apr 6 13:33 fusiondb_ora_5247_130AA3E60F561481E053B501A8C0E0F8.trm
Once the required activity is complete, you should disable the trace using this same method. Now you can go through these traces directly or using the tkprof utility in order to troubleshoot the issue.
Tracing Scheduled Job Sessions
Similar to Fusion Applications tracing, you can trace a scheduled job session as well. In fact in realtime, an administrator may get more frequent requests for scheduled jobs as compared to other elements of Fusion Applications. In order to enable database tracing for an ESS job, you need to enable the tracing option at the job definition level.
In order to edit a scheduled job definition, you must first navigate to the product family’s middleware page in Cloud Control or the Fusion Applications Control depending on the product corresponding to the job. Now in the Target Navigation region, open the ESS homepage by choosing the Product Domain ➤ Scheduling Services ➤ ESSCluster ➤ ESS Server (ess_server1) menu option, as shown in Figure 15-14.

Figure 15-14. Edit a job definition
Now you can access the Job Definitions page from the ESSAPP homepage by choosing the Scheduling Service menu ➤ Job Metadata ➤ Job Definitions menu item. Either search for the job or browse through the list of jobs and locate the scheduled job that you want to trace at the database level. We are using the example of same job discussed earlier—Retrieve Latest LDAP Changes (SyncRolesJob). Once the job is located, select it and click the Edit button to open the Edit Job Definition page, as shown in Figure 15-15.

Figure 15-15. Enabling a database trace for a job
In the Edit Job Definition page, you can add an Application Defined property by clicking on an Add (+) icon above the Application Defined Properties table, as shown in Figure 15-15. You can select the enableTrace property from the list of values. This property specifies the level of database tracing for the selected job. Table 15-4 shows the list of possible values along with the corresponding trace option. We selected the initial value as 13 here, which corresponds to database trace with bind and wait, similar to what we selected during the applications tracing.
Table 15-4. Database Trace Options in the ESS Job
enableTrace Value | Trace Option |
|---|---|
1 | Database trace |
5 | Database trace with bind |
9 | Database trace with wait |
13 | Database trace with bind and wait |
16 | PL/SQL profile |
17 | Database trace and PL/SQL profile |
21 | Database trace with bind and PL/SQL profile |
25 | Database trace with wait and PL/SQL profile |
29 | Database trace with bind, wait, and PL/SQL profile |
Once you have enabled tracing at the job level, run the job using the Scheduled Processes work area, as you saw earlier. Once the job starts running, a related database trace file is generated in a user session trace dump location (user_dump_dest) specified in the database. In order to locate the correct trace file, you must find the FND session ID similar to the application trace, but the method to look up this value is different here. This information is stored in the REQUEST_CP table of the ESS database schema (FUSION_ORA_ESS).Use the following query to locate the session ID specific to the request ID that was initiated:
SQL> select FND_SESSION_ID from fusion_ora_ess.REQUEST_CP where requestid=1404;
FND_SESSION_ID
--------------------------------------------------------------------------------
12DADA70B7051C9FE053B501A8C08F2A
This is the same postfix value as the database trace file so we can easily locate the file with this postfix value as follows.
[fusion@fa9host trace]$ ls -ltr *12DADA70B7051C9FE053B501A8C08F2A*
-rw-r----- 1 fusion dba37561 Apr 6 16:24 fusiondb_ora_7327_12DADA70B7051C9FE053B501A8C08F2A.trm
-rw-r----- 1 fusion dba 2428340 Apr 6 16:24 fusiondb_ora_7327_12DADA70B7051C9FE053B501A8C08F2A.trc
Once the required tracing is complete, it is recommended that you turn off database tracing for scheduled jobs in order to avoid excessive resource usage.
Troubleshooting Enterprise Scheduler
Troubleshooting issues related to Enterprise Scheduler is one of the most important tasks for a Fusion Applications Administrator because scheduled jobs are some of the most resource-consuming activities performed by business users. As we know now, the function of the Concurrent Manager from the Oracle E-Business Suite is replaced by Enterprise Scheduler in Fusion Applications. If you have worked with Oracle E-Business Suite, you need to spend the same amount of administrative efforts to manage Enterprise Scheduler as you used to do for Concurrent Manager.
Understanding Enterprise Scheduler Jobs execution
Before going into the details of Enterprise Scheduler troubleshooting, let’s first understand the basic flow of a scheduled process or scheduled job in Enterprise Scheduler. Figure 15-16 provides a basic understanding of the stages of a scheduled request from submission to completion, but not necessarily covering all conditions.

Figure 15-16. Default execution of a scheduled process
The execution of scheduled process involves three major components of Enterprise Scheduler—Runtime Module, Request Dispatcher, and Request Processor. You can manually stop or start Request Dispatcher and Request Processor but it is not recommended to manually control them unless there is a specific justification to do so. Even if these components are down, the scheduled jobs will continue to queue up. Once a scheduled request is submitted, the Runtime Module accesses the job’s metadata from the Metadata Store in Oracle MDS and puts the job in the WAIT queue. Now the Request Dispatcher processes the WAIT queue and puts the job in the READY queue.
As soon as the Enterprise Manager has a processor available to run the request, the Request Processor changes the job state to RUNNING and sends the job to the relevant application. Once the request completes successfully or with an error, it receives a callback from the application about the completion status. If the request was completed successfully, it changes the status to COMPLETED and starts post-processing. Once post-processing is complete, it changes the status to SUCCEEDED.
Enterprise Scheduler Status Codes
You have seen the basic flow of a scheduled job with WAIT, READY, RUNNING, COMPLETED, ERROR, and SUCCEDED. However, there are few more possible status codes for a job depending on various conditions and events. The job execution details are stored in the REQUEST_HISTORY table of Enterprise Scheduler schema (FUSION_ORA_ESS). The current status code for the scheduled request is stored in a numeric value column named STATE. Some of the statuses are considered terminal since they represent the final status of the request after execution regardless of whether it completes successfully. While remaining codes specify the non-terminal state of a scheduled request, which means they are waiting, running, or not started due to various reasons. The following are the terminal status codes for any scheduled job.
SUCCEEDED
WARNING
ERROR
CANCELLED
EXPIRED
VALIDATION_FAILED
FINISHED
You can use the following query, which returns the numeric STATE value based on the request ID in order to check the current status of a request directly from the database.
SELECT
STATE
FROM FUSION_ORA_ESS.REQUEST_HISTORY
WHERE REQUESTID = <Request_ID>;
Table 15-5 shows a mapping of the STATE column with the corresponding job status. You can use this table to derive the current status based on the returned value.
Table 15-5. Mapping the STATE value in REQEST_HISTORTY to the Scheduled Process Status
STATE Value | Corresponding Request Status |
|---|---|
1 | WAIT |
2 | READY |
3 | RUNNING |
4 | COMPLETED |
5 | BLOCKED |
6 | HOLD |
7 | CANCELLING |
8 | EXPIRED |
9 | CANCELLED |
10 | ERROR |
11 | WARNING |
12 | SUCCEEDED |
13 | PAUSED |
14 | PENDING_VALIDATION |
15 | VALIDATION_FAILED |
16 | SCHEDULE_ENDED |
17 | FINISHED |
18 | ERROR_AUTO_RETRY |
19 | ERROR_MANUAL_RECOVERY |
If you notice that certain jobs are in the same status for a long time without doing any activity in the back end, the reason could be associated with the ESS server or due to conflicts with other jobs or resources. Figure 15-17 shows the internal diagnostic codes for scheduled jobs that are in non-terminal state and not executing currently due to various reasons. This figure will help you understand why a request could be in the same status for long time and take further corrective action accordingly if required.

Figure 15-17. Scheduler jobs status and diagnostic codes
Important Database Objects of Enterprise Scheduler
Although you can get all relevant information about a scheduled job from the ESS homepage, at times you may want to access backend database for further troubleshooting or sometimes for automatic monitoring purposes. Figure 15-18 lists some of the important database objects that may help you in ESS troubleshooting. Notice that the main ESS schema contains the required tables and packages and you can access those using the FUSION schema through corresponding synonyms. Although some of the queries mentioned here will refer to the ESS schema, you can alternatively use synonyms from the FUSION schema as well.

Figure 15-18. Important database objects related to Enterprise Scheduler
Execution Flow of BI Jobs Invoked Through Enterprise Scheduler
The Role of Enterprise Scheduler Service (ESS) is to control execution of different types of PL/SQL, C, or Java code based on its job definition. However, the actual execution may be done by the application itself. For example Oracle Business Intelligence runs the reports related jobs invoked via Enterprise Scheduler. Once Scheduler sends the job request to BI, it waits for the callback from BI with an update of final execution status. So at times the status of an ESS and BI job might not be in sync for a short duration. Figure 15-19 explains a general scenario of a BI job execution that’s invoked through ESS.

Figure 15-19. Scheduler job status with corresponding BI job status
As you can see, once the ESS job enters the RUNNING state, the corresponding BI job may not have been initiated. Once both of the jobs are in the RUNNING state, the ESS job will continue to be in the same state until the BI job completes with a success or failure. Once the BI job is complete, it will send a callback to Enterprise Scheduler, which in turn changes the status of the ESS job for further post-processing.
A similar scenario occurs when you cancel an already running ESS job. You may expect both ESS and BI jobs to end with a CANCELLED status. However, if you look at various scenarios in Figure 15-20, you will understand that this might not always be true. This figure will help you troubleshoot mismatching status between ESS and BI jobs, especially when the BI job was completed successfully and the ESS job was cancelled before reaching the SUCCEEDED status.
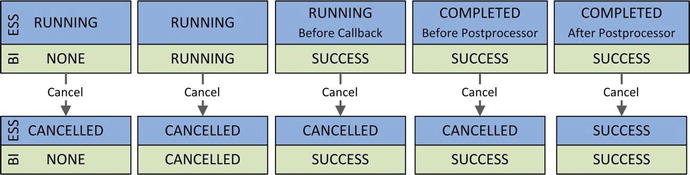
Figure 15-20. Cancelling the BI publisher-related ESS job
Troubleshooting Using ESS Job Log Files
If you find some issues with an individual or multiple scheduled jobs through proactive monitoring, alerts, or user complaints, you can look up the scheduled job log and output files. These log files are created temporarily in the respective product family’s ESS server log directory. The default location is APPLICATIONS_CONFIG/domains/<hostname>/<Domain>/servers/ess_sevrer1/logs/ess_requests. Once the job is complete, the Scheduler moves these files to the Universal Content Management (UCM) server. These files can later be accessed through the Scheduled Jobs work area by selecting the request ID. You can see the log and output files as attachments in the Log and Output section of the Job Details pane. We can use the following query to look up the domain, temporary log directory, and output directory.
SELECT
STATE,
PROCESSGROUP,
LOGWORKDIRECTORY,
OUTPUTWORKDIRECTORY
FROM FUSION_ORA_ESS.REQUEST_HISTORY
WHERE REQUESTID = <Request_ID>;
For example, this query returns the following values for an example request ID 801.
STATE: 3 (RUNNING)
PROCESSGROUP: HCMDomain##ESSCluster
LOGWORKDIRECTORY: /app/oracle/instance/domains/fa9host/HCMDomain/servers/ess_server1/logs/ess_request//801/log
OUTPUTWORKDIRECTORY: /app/oracle/instance/domains/fa9host/HCMDomain/servers/ess_server1/logs/ess_request//801/out
You can see that the request is currently running under HCMDomain’s ESS cluster. You can view the log file (<request_id>.log) and output file (<request_id>.txt) for further details as to what is currently being processed or where it is stuck. You can further troubleshoot HCM domain’s ESS cluster if we see a lot of requests stuck with a particular Scheduler Server.
Enterprise Scheduler Health Check
Once you have identified that multiple requests belonging to same product family are pending or encountering errors, you may want to make sure that the ESS server for the product family is running and able to process requests normally before deciding to bounce the service. We can do a quick health check of a particular ESS service and then launch ESS diagnostic health check using the following URL.
https://<hostname>:<port>/EssHealthCheck/checkHealth.jsp
The host and port are the web server host and port for the selected product family. For example:
https://fahost.paramlabs.com:10624/EssHealthCheck/checkHealth.jsp
Where 10624 is the financial domain web server port in this demo installation. Log in with Fusion Applications super user (FAAdmin in our installation). You will see a page similar to Figure 15-21.

Figure 15-21. Enterprise Scheduler health check
Click on Check Health to check the ESS status as well as initiate a sample job run in order to estimate the performance of the ESS Server, as shown in Figure 15-21. This should give you an indication if something is not right with the ESS Service. If you suspect an issue with ESS and want to drill down to the ESS cluster and managed servers level, you can use the following link to further diagnose the problem.
https://<hostname>:<port>/EssHealthCheck/diagnoseHealth.jsp
For example:
https://fahost.paramlabs.com:10624/EssHealthCheck/diagnoseHealth.jsp
This will launch ESS Diagnostics page, as shown in Figure15-22. Although it looks same as the previous Health Check page, clicking on the Diagnose Health button does an extensive checkup of ESS and provides details of the corresponding ESS cluster along with the WebLogic managed servers that are part of the cluster, as shown in Figure 15-22.

Figure 15-22. Enterprise Scheduler diagnostic health check
Note that the response code must be 200 for successful completion of sample jobs. The result page also points out if there are any issues with ESS setup as well as the number of servers alive if more than one server is part of the cluster.
Troubleshooting JVM Performance
Fusion Applications relies on the Oracle Fusion middleware infrastructure, especially Oracle WebLogic Server domains. Troubleshooting application performance issues or hang situations mostly deals with troubleshooting Fusion middleware components. Since Fusion middleware is based on Java Virtual Machines (JVM), troubleshooting JVM plays a paramount role in diagnosing and resolving Fusion middleware-related performance issues. JVM troubleshooting is an extensive and daunting task. It may take quite some time before you completely understand and become adept at troubleshooting JVM-related performance issues. However Enterprise Manager Cloud Control provides excellent JVM diagnostic features to help you succeed and provides quite an edge over manual troubleshooting. This also helps you to continue to troubleshoot JVM issues even if the specific Fusion Applications host, domain, or cluster is not responding in a timely manner. Cloud Control is hosted outside of the Fusion Applications environment and contains the last available data from the hosts. In this section, we will cover some of the JVM troubleshooting tasks that may help you understand how to make better use of the JVM Diagnostics engine to resolve the issues yourself or provide relevant dumps to Oracle for further support and troubleshooting.
Enabling JVM Diagnostics
As you saw in the previous chapter of configuring Fusion Applications with Cloud Control, we deployed the JVM Diagnostics Engine on a Cloud Control Server in order to provide JVM troubleshooting related features for Fusion middleware. Before we can use the features of JVM Diagnostics for the WebLogic server domains of Fusion Applications, we must deploy diagnostic agents to each of the product family WebLogic domains.
As you can see in Figure 15-23, the JVM diagnostics-related items in the Diagnostics menu on the WebLogic domain home are initially grayed out, indicating that the JVM diagnostic agent is not yet deployed on this domain. In order to deploy the agent, click on the Setup Diagnostic Agents option from the Diagnostics menu to launch the Agent Deployment page. Select the Deploy option for the selected WebLogic domain and follow the screens to enter the target credentials to complete the deployment. The last screen will display a link to the deployment job where you can track the deployment status.

Figure 15-23. Enable JVM Diagnostics
As you can see in Figure 15-23, after deployment of the JVM diagnostic agent, the Diagnostics menu on WebLogic domain home now has all the JVM diagnostics related tasks enabled. This will allow you to perform all the required JVM troubleshooting related activities right from this menu.
If you are using this method to deploy JVM agent on multiple domains at the same time then only the job that was invoked first will run and the remaining jobs will show the status as Suspended on Lock until the previous job is complete. The alternate way to deploy diagnostic agents on multiple WebLogic domains is to use the Setup ➤ Middleware Management ➤ Application Performance Management homepage, as shown in Figure 15-24.

Figure 15-24. Deploy JVM diagnostic agent on multiple WebLogic domains
Once you launch the Application Performance Management homepage, click on the Manage Diagnostic Agents button on the top of the page to launch the Diagnostic Agents deployment screen, as shown in Figure 15-24. This screen is similar to what you saw in Figure 15-23, but here it allows you to select multiple individual WebLogic servers from more than one WebLogic domain and runs the deployments as a single job.
Accessing JVM Diagnostics Homepage
Once you have installed JVM diagnostic (JVMD) agent in one or more WebLogic domains, you can access the JVMD related tasks in Cloud Control. These were not available prior to agent deployment. In order to view the summary of the current status of all JVMs configured for a product family, you can navigate to the Java Virtual Machine Pool home. There are several ways to access the JVM Pool homepage.
Using the Middleware Summary page: You can view all the discovered Java Virtual Machines and JVM Pools by selecting Target Type as JVM in the Middleware Summary screen in Cloud Control, as shown in Figure 15-25. You will notice one JVM pool per WebLogic domain. The JVMs for each managed server will have a _jvm postfix. Clicking on any of these will open the respective JVM pool or JVM homepage.

Figure 15-25. Summary of all monitored JVM targets
Using Target Navigation region: Once the JVM diagnostics agent has been deployed for the selected product family domain, you will see an additional subtree node called Java Virtual Machine Pools in the domain tree in the Target Navigation region as we will soon see in Figure 15-26. Once you expand it, you will see the JVM Pool and JVMs for this domain listed in the subtree. This can be accessed from any product family, product, or WebLogic domain page in Cloud Control.

Figure 15-26. Java Virtual Machine Pool homepage
Using Diagnostics menu: As you saw in Figure 15-23, you can use the Diagnosis menu from any page of WebLogic domain, cluster, or server home in Cloud Control to access various JVM diagnostics-related tasks. These links are disabled until the Diagnostics Agent has been deployed for the selected product family domain.
Troubleshooting Using JVMD Features
The JVM Pool homepage and JVM homepage look quite similar except for the fact that JVM Pool displays consolidated information about threads from all the JVMs while the single JVM homepage displays the threads and relevant information for that specific JVM, as the name suggests. Depending on whether you have already identified the specific JVMs or are troubleshooting overall performance of an application, you may access one of these two homepages. Figure 15-26 shows an example of the CommonDomain_jvmpool homepage.
As you can see, the JVM or JVM Pool homepage displays threads activity graph along with which layer it is spending most time at, including DB, CPU, Network, I/O, or in situations like Lock. This gives you a quick overview of whether the JVM is acting as a bottleneck or other components in the environment. Any automatically generated incidents are also displayed here so that you can review and access existing issues quickly without manual troubleshooting.
The next section shows availability, resource usage, and important wait events for each of the JVM threads. The default installation configures one JVM per managed server but depending on your custom configuration or tuning you may see multiple JVMs in this section. This section gives a quick overview of which of the JVM is performing badly so that we can focus on those JVMs to troubleshoot further. Clicking on any of the links will open the homepage for the selected JVM.
The last section shows the top requests in the last hour, along with the average duration, count, and the standard deviation, which indicates the amount of variation in the sample data. You may want to customize the screen by adding or removing regions of importance. You can do this by clicking on the Personalization icon at the top.
You can monitor JVM performance by clicking on the JVM Performance Diagnostics link on the JVM homepage or by choosing the Diagnostics ➤ JVM Performance Diagnostics menu option in any product family page in Cloud Control. Figure 15-27 shows an example of a JVM performance diagnostics page for the WebLogic managed server HomePageServer_1.

Figure 15-27. Performance diagnostics for the selected JVM
The JVM performance diagnostics page provides a large magnitude of information for running JVM threads, including historical information related to resources utilization, garbage collection, and so on. If users are frequently reporting performance issues with a particular product then you may want to keep this console open to monitor sudden spikes in resources utilization by the selected JVM.
Note
If you have not configured Cloud Control yet, you can monitor JVM performance by choosing the WebLogic Server menu ➤ JVM Performance in Fusion Applications control for a specific WebLogic managed server. The disadvantage here is that by default it shows only the last 15 minutes of performance summary, while Cloud Control stores historical data, which allows you to generate more accurate performance graphs.
An important feature of JVM performance diagnostics is the ability to compare collected data from the current period with historical data and to compare the current period’s performance with an earlier good performance period. In order to do this, you need to select the time period for which the performance issue has been reported by either selecting from the default options on the screen or by manually selecting start and end times. Now select the Compare With checkbox. This will prompt you to select another historical time period similar to how you selected current period. Figure 15-28 shows an example of the last 15 minutes server state chart with past day performance charts.

Figure 15-28. JVM Performance Diagnosis comparison
JVM Performance comparison with valid historical data gives you clues to understand whether the current period performance is abnormal. This can save a lot of time by eliminating the selected JVM from the list of suspects for slowness or errors.
Live JVM Thread Analysis
Another useful feature of JVM Diagnostics is live thread analysis. Often you may see that once a user has clicked on a page link, it may show a waiting or spinning icon on the page for long time. You can analyze the live JVM threads using Live Thread Analysis page. You can launch this page by clicking on the Live Thread Analysis button from the JVM/JVM Pool homepage or by choosing the Diagnostics ➤ Live Thread Analysis link from any product page menu. The active threads are shown with the [ACTIVE] prefix and the stuck threads are listed with the [STUCK] prefix. You can search for the thread name starting with [STUCK] to filter only those threads. Clicking on any of any of the threads provides detailed information about what the activity was at the thread level and the wait status. This page also provides an option to stop and start the WebLogic server. There could be other dependencies that might be causing the thread to be stuck or not respond, so troubleshoot thoroughly before making a critical decision like service bounce or adding more JVMs.
Figure 15-29 shows an example of Live Thread Analysis for the JVM Pool for the CommonDomain (CommonDomain_jvmpool).

Figure 15-29. Live Thread Analysis example
As you can see in Figure 15-29, the Live Thread Analysis of JVM Pool lists all the JVMs included in this pool, each of which corresponds to a WebLogic server. Clicking on any of the JVMs populates the list of JVM threads corresponding to the selected JVM, with a summary of each thread in JVM threads table. Once you select a thread from this table, it populates the Thread Info and Thread Stack subsections under the Thread Details section. You can see what exactly is running on this JVM thread in real time. Unlike other JVM diagnostics pages, this page has an Auto Refresh option that you can select at the top of the page. The default values are 30 seconds and 1 minute, but you can select a custom Auto Refresh interval in seconds.
JVM Thread Dumps
Java Virtual Machine thread dumps are mostly included in the automatically created incidents related to JVM issues. But in many circumstances you may need to obtain JVM thread dumps manually to troubleshoot an issue or to provide to Oracle Support since they contain some of the most critical pieces of information for Oracle Support to diagnose and resolve an issue. There are multiple ways to collect a thread dump. Let’s look at some of these methods.
Using the Command Line: In order to generate a thread dump for a WebLogic managed server from the command line, you need to get the OS process ID (pid) for the server JVM process. Use the following command to get the OS pid for the Linux platform.
ps -ef | grep <DomainName> | grep <ManagedServer_Name> | awk '{print $2}'
Once you have the pid for the JVM, you can generate thread dump using the following command.
kill -3 <managed_server_process_ID>
Using the WebLogic Administration Console: Navigate to WebLogic Administration Console ➤ Environment ➤ Servers and click on the managed server for which the JVM thread dump is required. Click on the Monitoring tab followed by the Threads tab. Here you will see summary of the JVM thread activity for the selected managed server. Click on the Dump Thread Stacks button to generate a thread stack dump, as shown in Figure 15-30.

Figure 15-30. Getting JVM thread stacks dump through the Administration Console
Using Fusion Applications Control: Alternatively if you are logged in to the Fusion Applications Control interface for the required WebLogic server, you open WebLogic Server ➤ JVM Performance on the WebLogic Server homepage and click on the Thread Dump button on the JVM Performance page to generate the JVM thread stack dump, as shown in Figure 15-31.

Figure 15-31. JVM thread dump example
Summary
In this chapter you explored some of the important aspects of Fusion Applications diagnostics and troubleshooting. However, troubleshooting all aspects of the Fusion Applications environment is not limited to the activities listed here. Most of the time, it involves teamwork between a support desk team, network-security team, core DBAs, Fusion Middleware and Identity Management experts, and functional specialists. Recent releases of Fusion Applications provide much better diagnostic features and enhancements coupled with Cloud Control features to identify and resolve issues rapidly as compared to earlier releases.
In the beginning of the chapter, you learned about some common troubleshooting features of Fusion Applications followed by various methods of tracing issues at the database level. Since Enterprise Scheduler plays a sizable role in the day-to-day business, you saw Enterprise Scheduler jobs troubleshooting as well. At the end of the chapter, you got a glimpse of JVM troubleshooting features provided by Fusion Applications in conjunction with Cloud Control. This chapter gives you a good starting point in overall troubleshooting and diagnosing of a Fusion Applications environment.