
Health and Monitoring
The health of your new SharePoint 2010 deployment is very important. Your organization, you, and your administration team have likely spent considerable time installing, configuring, and deploying SharePoint 2010 to accommodate the needs of the enterprise. In my time as a SharePoint Architect, I have seen a number of organizations stop here, but the fact of the matter is that SharePoint 2010 requires a certain amount of care and feeding, just like any enterprise computer system. This is not to say that SharePoint 2010 left alone will fall over in time, but as more users pump data into the system, eating up storage space, and the system grows a larger user base, administrators should expect to monitor SharePoint and the underlying server infrastructure for stress areas and efficiency optimization.
Organizations understand that it is costly to stand up large-scale enterprise systems, and they rely on them as an integral part of their daily business. Spending more money ensuring that such systems remain healthy and sustain significant uptime is just as important as the upfront investment in the creation of the system. Consider how much money an organization might lose if its core information system falls over and suffers downtime.
Earlier in this chapter, we looked at disaster recovery. I demonstrated several planning techniques to recover in the event that your SharePoint 2010 infrastructure fails. Disaster recovery is akin to planning for what to do when a hurricane hits your town, but it would sure be nice to factor in some notice before the storm hits—this analogy is what health and monitoring is all about.
In the previous versions of SharePoint, administrators tended to work in reactive mode—typically, users of the system would report performance issues or loss of access to their data in SharePoint, and the IT department would then jump on the case to rectify the issue. SharePoint 2010 now provides health and monitoring features to give the IT group a heads-up of potential issues in the platform, long before users ever see an issue. In the remainder of this chapter, I shall describe these new features and how to configure them to give you advanced warning of problems brewing in the platform, so that you may remedy issues and users may never know there was a problem in the first place.
Logging
Logging is an important part of health monitoring because it is via various log files that SharePoint 2010 may alert administrators to issues in the system.
The Unified Logging Service (ULS), which also existed in SharePoint 2007, provides administrators with an extensive dump of information, warning, and errors occurring in the platform. When something goes wrong, the user typically sees either a custom-developed “oops” message in their browser, or a default SharePoint error message. It is the job of SharePoint administrators to find out what went wrong, and the ULS logs will likely give an indication to the problem—especially if it is recurring.
![]() Note By default, the ULS logs live on each SharePoint 2010 server in the Logs folder of the hive, typically
Note By default, the ULS logs live on each SharePoint 2010 server in the Logs folder of the hive, typically c:program filescommon filesMicrosoft sharedweb server extensions14logs.
Figure 10-15 shows an Explorer view of the ULS log folder on my SharePoint 2010 development server. The log folder consists of a number of files, both log and usage files (all text files), that have a filename in the format of year, month, day, and time. If you crack-open any of the log files you can see lots of detail, reported by the various functional areas of the SharePoint platform—notice that the Timer Service reports lots of information events.

Figure 10-15: A log folder in SharePoint 2010
SharePoint 2010 allows you to fine-tune the ULS log files to contain information most important to you. The Trace Log Service, which controls output of the ULS log files, also operates in a variety of verbosity modes, ranging from error reporting to very detailed information for every action in the platform. As you might expect, Central Admin is the place to configure the ULS settings, as demonstrated in the following steps:
- Open Central Admin.
- Click on the Monitoring link.
- Click the Configure Diagnostic Logging link, which then shows a page like Figure 10-16.

Figure 10-16. ULS logs settings
- Expand the Categories node and specify the types of events you wish SharePoint to log in the ULS logs.
- When an error occurs in the platform, SharePoint reports events to both the ULS and Windows Event Log; you may control the severity (verbosity level) of events logged to both in the Throttling section of the page.
Note This page does not show you the current configuration for throttling; it defaults to empty drop-down controls, and no categories selected.
- Flood protection consists of preventing SharePoint logging the same repeated event to the Windows event log when a consistent problem arises. For example, if a timer service job runs every 5 minutes and fails, you really do not want hundreds of event log errors of the same message because an administrator did not get to the issue for a few hours.
- Finally, the Trace Log section defines the location of ULS log files, the number of days of history to store, and the maximum size of log files.
![]() Note When changing settings for diagnostic logging, I recommend you restart the SharePoint 2010 Tracing service in Windows Services. Also, stop this service if you need to delete any of the ULS log files.
Note When changing settings for diagnostic logging, I recommend you restart the SharePoint 2010 Tracing service in Windows Services. Also, stop this service if you need to delete any of the ULS log files.
Correlation IDs
New to SharePoint 2010 are Correlation IDs GUIDs (Global Unique Identifiers) that map an event in SharePoint with the error or warning in the ULS log. In the previous versions of SharePoint, the administrator had to hunt and peck through the log files looking for the event that caused the error. Correlation IDs now allow a user, experiencing a problem and an error page, to send the ID to the administrator to find more details about the issue.

Figure 10-17. Correlation ID in a SharePoint 2010 error page
As well as using a text-editor-find action to find errors in the logs files, SharePoint 2010 includes a very nice PowerShell command to simplify finding the messages with a given correlation ID:
Get-SPLogEvent | ?{$_.Correlation -eq "<ID>"}
The Logging Database
The new Logging Database in SharePoint 2010 provides developers with a central data store to capture all events occurring in the platform. Microsoft introduced the logging database both to provide a transactional database of all events for easy query and to herd developers away from executing custom queries directly against content and configuration databases in the farm.
The logging database provides a central location to query all events occurring in the farm, whereas ULS logs only report information per the verbosity settings (see previous sections of this chapter) and spread across servers in the farm. The following steps demonstrate how to configure the logging database for your farm:
- Open Central Admin.
- Click the Monitoring heading link.
- Click the Configure Usage and Health Data Collection link.
Figure 10-18 shows a page like that for configuring the health data collection events.

Figure 10-18. Configure health data collection
- Ensure that the topmost check box is checked to enable usage data collection.
- Select the events you wish SharePoint 2010 to capture; by default the page shows you all events.
- In the Usage Data Collection Settings section, notice the location defaults to the same folder as ULS logs, looking into this folder you should see usage files as well as the familiar log files.
- Ensure that the checkbox is checked for the Health Data Collection setting to monitor SharePoint 2010 farm health, which is in addition to usage.
- Click the Health Logging Schedule link if you wish to change the schedule that the health logging timer services run (several of them).
- SharePoint 2010 populates the logging database using the various usage files on each SharePoint server. A timer service collects data from these files and populates the database configured in the Logging Database Server section; click the link to configure the schedule of the log collection timer service.
Allow the usage collection to run for a day or two and interact with your farm to generate usage events. Next, I shall show you the logging database, which in my farm is the
WSS_UsageApplicationdatabase.- Open SQL Server Management Studio.
- Navigate to the logging database (in my case
WSS_UsageApplication).- If you expand the Tables node, you should see a large number of partitioned tables, which is not too helpful; expand the Views node instead.
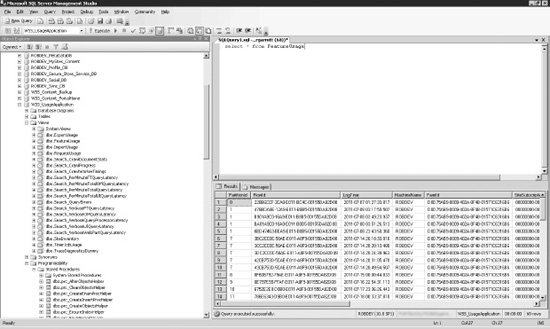
Figure 10-19. SQL Server Management Studio and the logging database
- You may execute SQL queries against the views; in Figure 10-19 I ran a select T-SQL statement over the
dbo.FeatureUsageview.The logging database also contains a number of stored procedures that return tabular usage data.
As you can see, the logging database provides a nice collection of usage event data that developers may query in custom controls, without having to dip into the main farm content and configuration databases. The premise here is that Microsoft optimizes the configuration and content databases for SharePoint 2010 and does not guarantee consistency in the schema between versions. The logging database is isolated from the other farm databases and offers consistency, allowing developers the confidence that their queries remain working with future upgrades of the platform.
SharePoint 2010 caters to developers, but at the same time, it does not leave administrators out in the cold—SharePoint 2010 provides several administrative, usage, and health reports, which rely on the logging database.
- Click the Monitoring heading link from the Central Admin home page.
- Click the View Administrative Reports link to review a document library of administrative reports—the reports are simple ASPX pages, which developers may download and edit.
- Click the View Health Reports link to see health reports.
- Click the View Web Analytics Reports link to view analytic usage reports.
![]() Note The reports require a working State Service Application, and the Web Analytics Reports require the Web Analytics Service Application running.
Note The reports require a working State Service Application, and the Web Analytics Reports require the Web Analytics Service Application running.

Figure 10-20. The Web Analytics report page
The Health Analyzer
The previous few sections of this chapter were concerned with reviewing the health of SharePoint 2010 proactively. When I first mentioned health and monitoring in this chapter, I said that SharePoint has the capability to monitor and report itself and give administrators a heads-up when potential problems in the platform are brewing. This is the job of the Health Analyzer.
- Open Central Admin.
- Click the Monitoring heading link.
- See the links under the Health Analyzer heading.
Because the job of the Health Analyzer and reporting issues is important, you may notice that the HA displays a banner on the home page of the Central Administration home page when it detects problems.

Figure 10-21. Health Analyzer alerts the administrator of problems via the home page of Central Administration.
- Click the View These Issues link, which navigates you to the same page as the Review Problems and Solutions link under the Monitoring heading.
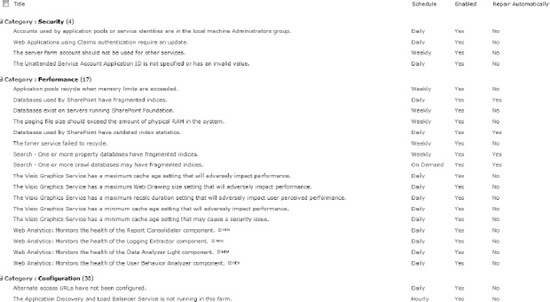
If the Health Analyzer has picked up issues to address in your farm, the Review Problems and Solutions page should list those issues. See Figure 10-22 for an example from my development farm.

Figure 10-22. A list of problems and solutions identified by the Health Analyzer
- Click any of the issues, and SharePoint 2010 will open a dialog with more specifics about the issue.
- In some cases, SharePoint 2010 can help you fix issues, with the Repair Automatically icon in the dialog Ribbon.
- If SharePoint 2010 cannot automatically fix an issue, fix the issue manually; then come back to the issue and click the Reanalyze Now icon to request that the Health Analyzer determine if the issue is remedied.
The Health Analyzer uses a series of rules to determine if a particular area of the SharePoint 2010 platform needs attention:
- Navigate back to the Monitoring page in Central Admin.
- Click the Review Rule Definitions link.
SharePoint 2010 shows a page like that in Figure 10-23, which consists of a standard list of rules.
- Click the name of any list item in the appropriate category to view the dialog for the rule list item.
- You may click the Edit icon to edit the rule list item—you may change the name, scope, schedule, and whether SharePoint can configure the issue automatically.
Since Health Analyzer rules consist of list items, Microsoft and third parties may add additional rules later.
Timer Jobs
Time Jobs work at the heart of a SharePoint 2010 farm. Each SharePoint server (web-front-end or application server) hosts a SharePoint 2010 Timer service, which is a Windows service. This service is responsible for running SharePoint jobs—designated units of functionality to execute a designated time and perhaps recurring.
SharePoint 2010 relies on a vast number of timer service jobs to maintain operation of the farm. The following steps demonstrate how to view the available timer job definitions in the farm:
- Open Central Admin.
- Click the Monitoring heading link.
- Click the Review Job Definitions link, under the Timer Jobs heading.
SharePoint displays a page like that in Figure 10-24.

Figure 10-24. Timer job definitions
Timer job definitions exist either as common to the SharePoint 2010 Foundation Timer service or associated with other SharePoint 2010 services, such as the Access or Excel services.
- Click the Service drop-down box in the top right to change the service. You may also list timer services by web application, by changing the far-right drop-down from Service to Web Application.
- Click the name of any of the timer job definitions to see the details of the job.
Administrators may change the schedule of most jobs. They may also disable and enable jobs. SharePoint 2010 only allows creation of new jobs via code and feature deployment, so seek a developer if you need a special job created.
Some of the functional features of SharePoint 2010 create timer jobs to perform their tasks; for example, Content Deployment creates a new timer job to deploy content to another farm.
- Navigate back to the Monitoring page of Central Admin.
- Click the Check Job Status link, and SharePoint 2010 shows you a page of upcoming scheduled jobs, running jobs, and a history of jobs executed, with their completion status.

Figure 10-25. Timer Job Status
The Developer Dashboard
As much as this book is about administration and not development, I need to say a few words about the SharePoint 2010 Developer Dashboard. This new feature in SharePoint 2010 provides performance and tracing information within SharePoint rendered pages, so that developers (and administrators) may diagnose slow-rendering pages. Figure 10-26 is an example of the Developer Dashboard output.

Figure 10-26. Output from the Developer Dashboard
The following STSADM command demonstrates enabling the Developer Dashboard:
STSADM-o setproperty –pn developer-dashboard –pv ondemand on
The following command disables it:
STSADM-o setproperty –pn developer-dashboard –pv ondemand off