When I first started writing T-SQL, I focused on using the right syntax. I worked to try memorizing things like if the GROUP BY clause came before the ORDER BY clause. As I became more familiar with writing T-SQL, I had new challenges like making sure that my results were accurate. Over time, I got to the point that not only was I writing queries with complex logic, I also had to write several simpler queries to verify my results. I got to the point where I started debugging T-SQL code that had been written by other database developers. I also became responsible for researching various application issues.
In many cases, the result of this research came down to some T-SQL code that was running at the same time as an application crash or a spike in hardware usage. At this point in time, the pressure was on to figure out what was causing the performance issue as quickly as possible. In the beginning, I learned to rely on my understanding of the needs of the business and the database design. While this can be very helpful, it does require a significant amount of domain knowledge that can take years to acquire. There are better, faster, and easier ways to find the pain points in your queries.
In this chapter, you will learn how to view and understand SQL Server execution plans. You will also see demonstrations on how your existing and new indexes can affect your execution plans. You will also learn about how SQL Server will join data together in the execution plan. By the end of this chapter, you will have the knowledge to know how to use execution plans to improve the performance of your T-SQL.
Reading Execution Plans
My ultimate goal when writing to T-SQL is to make sure that I get accurate results. In some cases, the queries I write are simple and straightforward. As a data engineer, I find myself needing to performance tune queries related to reporting or writing new queries for reporting. Because these are queries to provide reports on transactional data, I often must incorporate more joins and more logic than I would need if I were to write queries for application. While this is not ideal, this is a very common scenario for many companies out there.
Many companies have begun to realize the importance of the data in their systems, or they want additional monitoring to ensure the applications are working as intended. In either case, it is highly likely that you will come across a query in your environment that is negatively affecting your applications. At that time, you will want to know what you can do to resolve the issue. In this section, you will learn why execution plans are important and when you need to use them. You will learn how to read execution plans including commonly used symbols. You will also learn about properties and warnings in execution plans.
My first mentor once told me that in order to write good T-SQL, I needed to understand how SQL Server worked. It is some of the wisest advice I have received, and I am still working to understand SQL Server internals better each day. Taking this advice in mind, one way that we can have a better understanding of SQL Server is to understand how SQL Server will execute any queries that we have written. While I will not cover all the internals related to executing a query, I will show you the instructions that SQL Server has determined should be used to execute your T-SQL code. These instructions can be found in the execution plan for as long as the plan is still in the plan cache.
Once you have decided that you want to start investigating an execution plan for some T-SQL code, you should confirm that you have access in SQL Server to view execution plans. You have several options. If you are going to be getting the actual execution plan when the T-SQL code is executed, you will need to make sure you have permissions to execute that code and that you have SHOWPLAN access for the databases that exist in the T-SQL code. You can also get the execution plan from the plan cache, but you will need to be able to query the dynamic management view sys.dm_exec_cached_plans. Now that you know how to verify that you have access, I want to go over the different types of execution plans available.
There are various ways to retrieve execution plans, and depending on your needs at the time will help determine which is the best model to use. When you are trying to troubleshoot performance issues, the best option is to retrieve the execution plan from sys.dm_exec_cached_plans. This is the method you will want to use if you want the best idea of the execution plan that was used previously. You may not be able to find the query or stored procedure here if the execution plan has been cleared from the plan cache. In addition, depending on when the performance issue happened, the plan that was in cache may have been cleared. This may mean you can find an execution plan, but it may not be the same one used previously.
If you find that the execution plan is not in the plan cache or that the execution plan has been changed since the performance issue, you can try to find the current execution plan. There are two options available when using this method. One option is to get a hypothetical idea of what SQL Server would use as an execution plan. This can be done without running the actual T-SQL code on the server. This is called the estimated execution plan. The largest challenge using this method is that just because SQL Server has estimated an execution does not give you any guarantee that this will be the actual execution plan that SQL Server uses when the query is run. I do not usually use estimated execution plans in my day-to-day operations. I have used estimated execution plans only a handful of times, and that was when I was hesitant to run the T-SQL code for fear of causing an outage in Production.
The next best option besides reviewing an execution plan in the plan cache is to see what the execution plan would look like right now if you ran the execution plan. Requesting an actual execution plan when you execute your T-SQL code will cause the execution plan to be available after the query execution completes. There is also a newer option available in SQL Server 2014 and higher, that is, the ability to see the flow of data through the execution plan as the query is executing. Instead of viewing the actual execution plan, you will ask SQL Server to show you the live query statistics. While this option may be helpful in slower queries where there is one specific pain point, I often find that many queries complete too quickly to use this method to effectively diagnose many issues I am trying to resolve.
Graphical Execution Plan
Operator Details from a Graphical Execution Plan
Additional Properties for Execution Plans
XML Execution Plan
While this method may be more difficult to read, it does contain all information related to the execution plan. The query that generated this table was a SELECT statement on one table. As you can also see, having all the data in one place makes for quite a bit of code that needs to be reviewed.
Once you have set up SQL Server Management Studio to give you an execution plan, you will want to know what to look for when reviewing the execution plan. You will need to know how to interpret the flow in the execution plan to better understand how SQL Server will execute the query. There are also some general shapes you will want to be familiar with as they may help you find potential issues at a glance. Included in the execution plan you may find additional text that quickly shows issues that have been determined to be negatively affecting the execution of your query. Having a better understanding of all these elements will help you figure out the pain points for your queries so that you can determine where to focus your efforts.
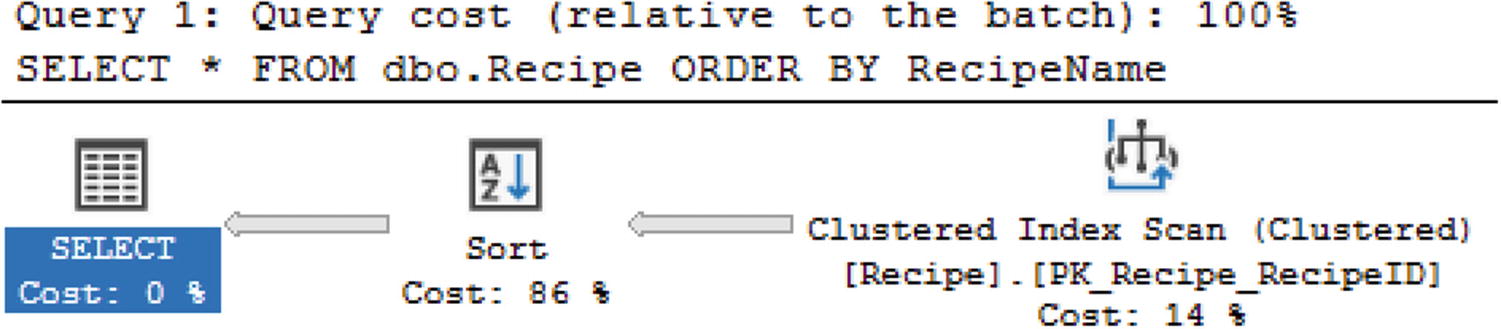
Execution Plan with Multiple Steps
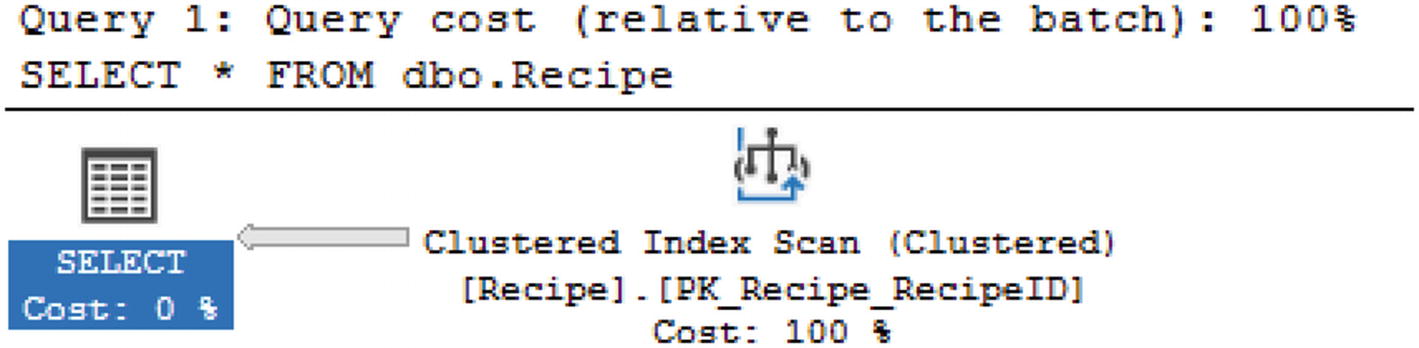
If I read from left to right, I can see the representation for the results returned with the SELECT. When I move to the right, I can see that SQL Server used the compute scalar immediately before getting the result set. This means that if I move to the right-most object, this is the first action SQL Server took when executing the query. In this case, the first step SQL Server performed when executing this query is a clustered Index Scan. This is important to know because you may hear references to reading execution plans left to right. In these cases, the person is referring to reading the execution plan in the same way SQL Server executes the query.

Arrows from Execution Plans
I learned that the difference in the thickness of the lines indicated the relative amount of records SQL Server was accessing for each step. While there are some queries that are going to return more records than others and therefore have thicker lines, you will find execution plans where one step has a very thick line and the next step will have a thin line. This usually indicates the step with the thicker line could be written more efficiently in order to pull back less data. Looking at the thickness of the lines is one of the things you can check when you look at execution plans.
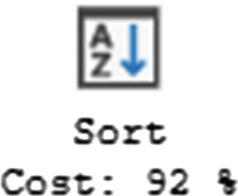
Sort Operator
You will see Sort operators in your execution plans. There are occasions where the Sort operator is necessary. However, you will want to look for instances where the Sort operator may not be needed. This can include Sorts that are required for Merge Joins. In these cases, you will want to see if there is an index that can be used for the join that already has the data sorted. One of the largest issues to watch out for is when there is a warning related to the Sort operator.

Warning in an Execution Plan
The main advantage of seeing a warning is that SQL Server has identified a potential issue with your T-SQL code. It would benefit you to investigate any warnings that are returned and see if you can take steps to resolve them.
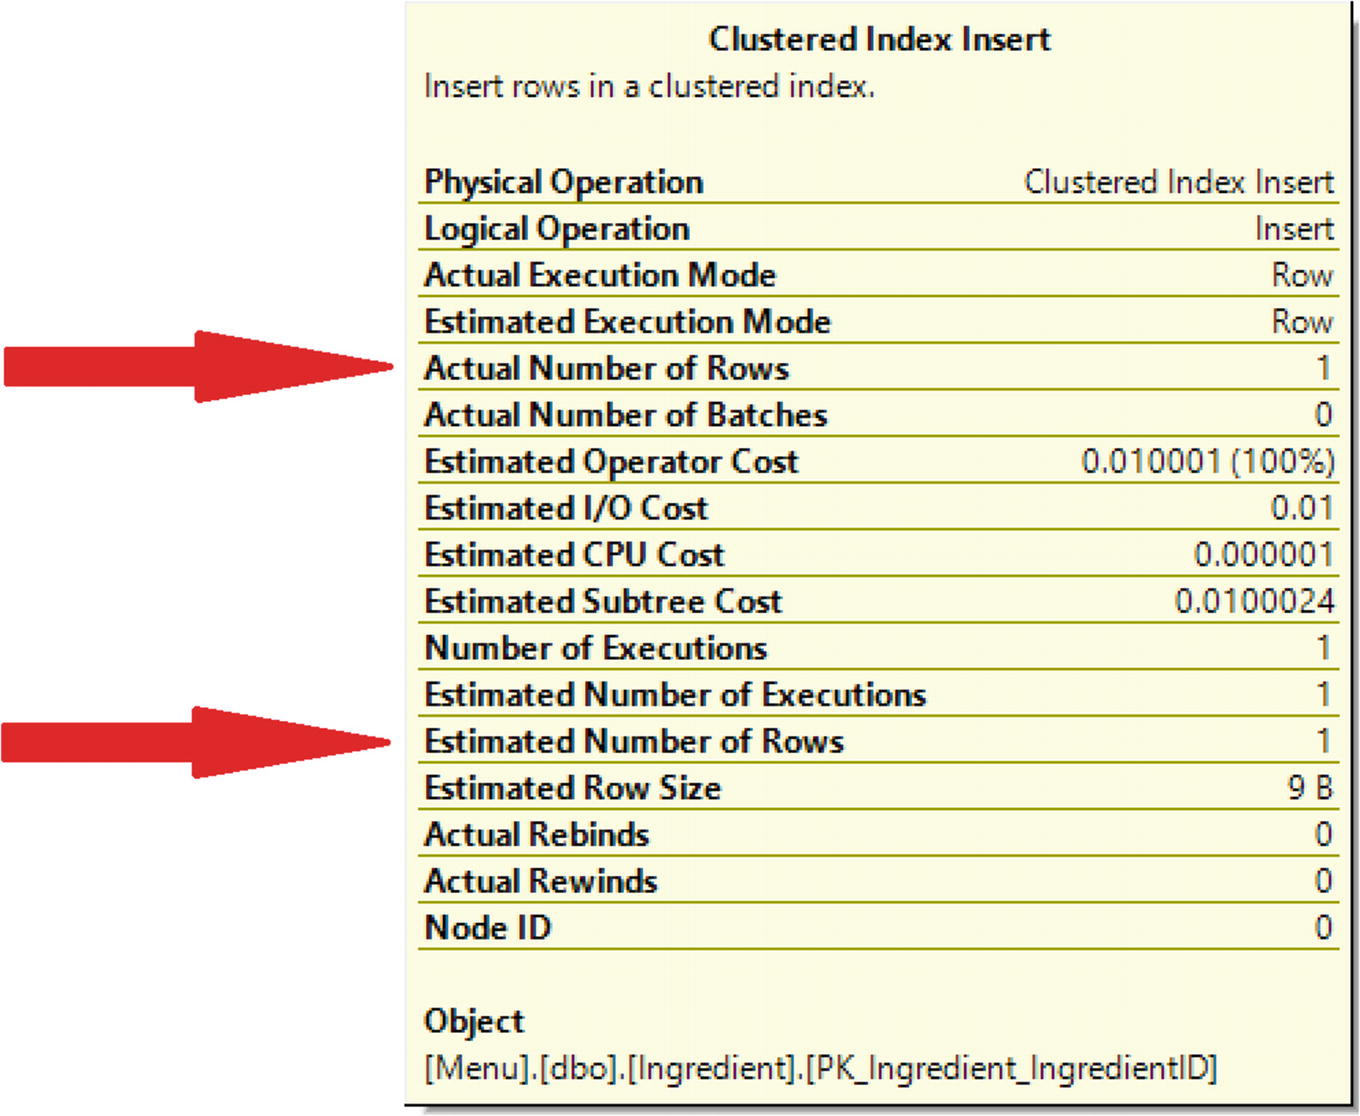
Estimated vs. Actual Number of Rows
The first arrow points to the actual number of rows returned for this step of the execution plan. The second arrow points to the estimated number of rows returned. In this case, the number of rows matches. If the number of rows matches or is close in range, you will not have performance issues related to estimates. If the two numbers are significantly different, then you may get an execution plan that does not perform as well as it could. This could be happening because the statistics are out of date, and SQL Server cannot accurately determine the number of rows that will be returned. Another possibility is that SQL Server may have created the execution plan for a different set of values. Regardless of the reason, if you see a large variation between the estimated and actual number of rows returned, this is something that you should investigate.
By reading execution plans, you can quickly identify where there are performance issues in your queries and what steps you can take to solve those issues. This includes knowing how to access execution plans and know the difference between estimated and actual execution plans. Execution plans also have several features that will help you quickly identify possible performance issues. By looking at the size of the arrows, you can tell the relative amount of data passing through each step in an execution plan. The Sort operator may provide insights into data that is sorted for more reasons than returning an ordered result set. You can also look at the estimated and actual number of rows returned to help determine if SQL Server has enough information to give you a good execution plan. Once you have gotten familiar with these aspects of execution plans, you may want to investigate how SQL Server is using your indexes.
Index Usage in Execution Plans
In terms of managing T-SQL, one of the largest differences I have seen across companies is how indexes are managed. In some cases, the development teams own writing all the T-SQL code including index creation. There are also companies where the database team handles all index creation and maintenance. Since database administrators usually have less access to development than the developers, I believe it may be most helpful to have the two teams work together. The database administrators can find indexes that are performing poorly and may have more experience designing indexes for multiple T-SQL queries. On the other hand, the developers may have a better idea of how the tables are designed and how the T-SQL code uses those tables.
There are many queries, health checks, and monitoring tools that exist that can help you identify issues with your indexes. You can either use queries to find what stored procedures use the same database objects or you may have a specific query in mind to improve performance. Once you get the execution plan from the cache or generate the current actual execution plan, you can start looking into potential performance issues. As discussed in the previous section, you know that you can check the relative amount of data records for each step, look at various operators and warnings, and verify the estimated and actual number of rows returned. You can also look at how indexes are being used as part of your execution plan.
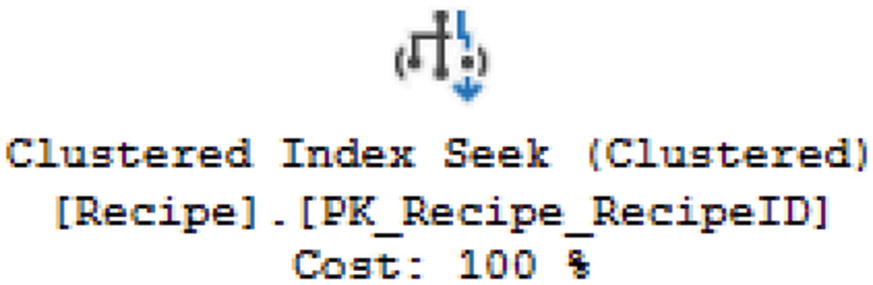
Clustered Index Seek
Seeing a Clustered Index Seek lets you know that your T-SQL code is written well enough to find the data quickly. If you do not see a Clustered Index Seek in your execution plan, you may want to see if there is a way to rewrite your T-SQL to use a Clustered Index Seek.
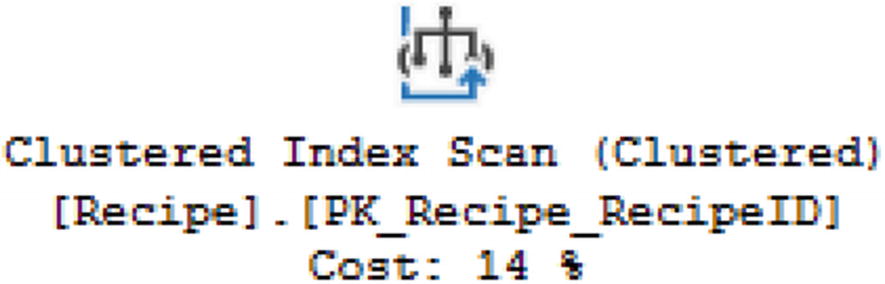
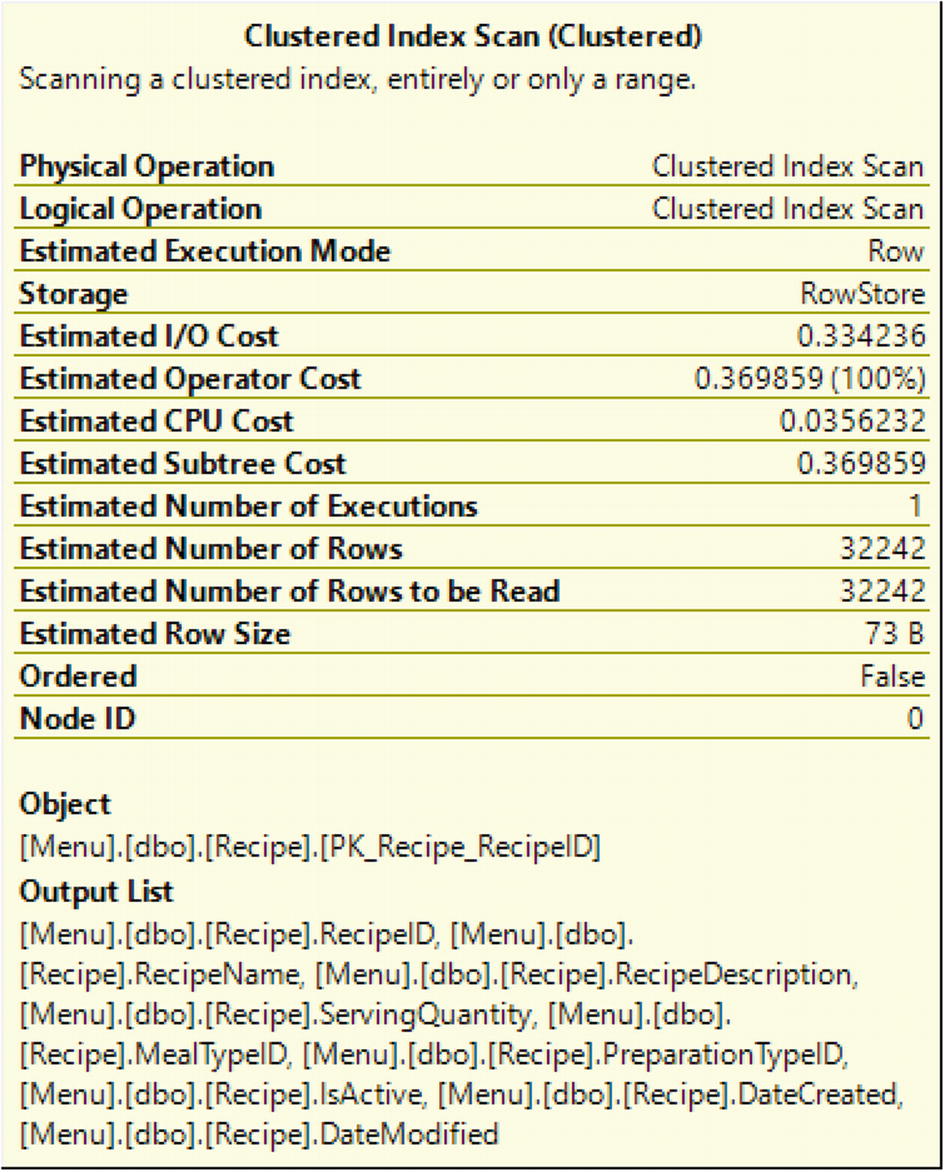
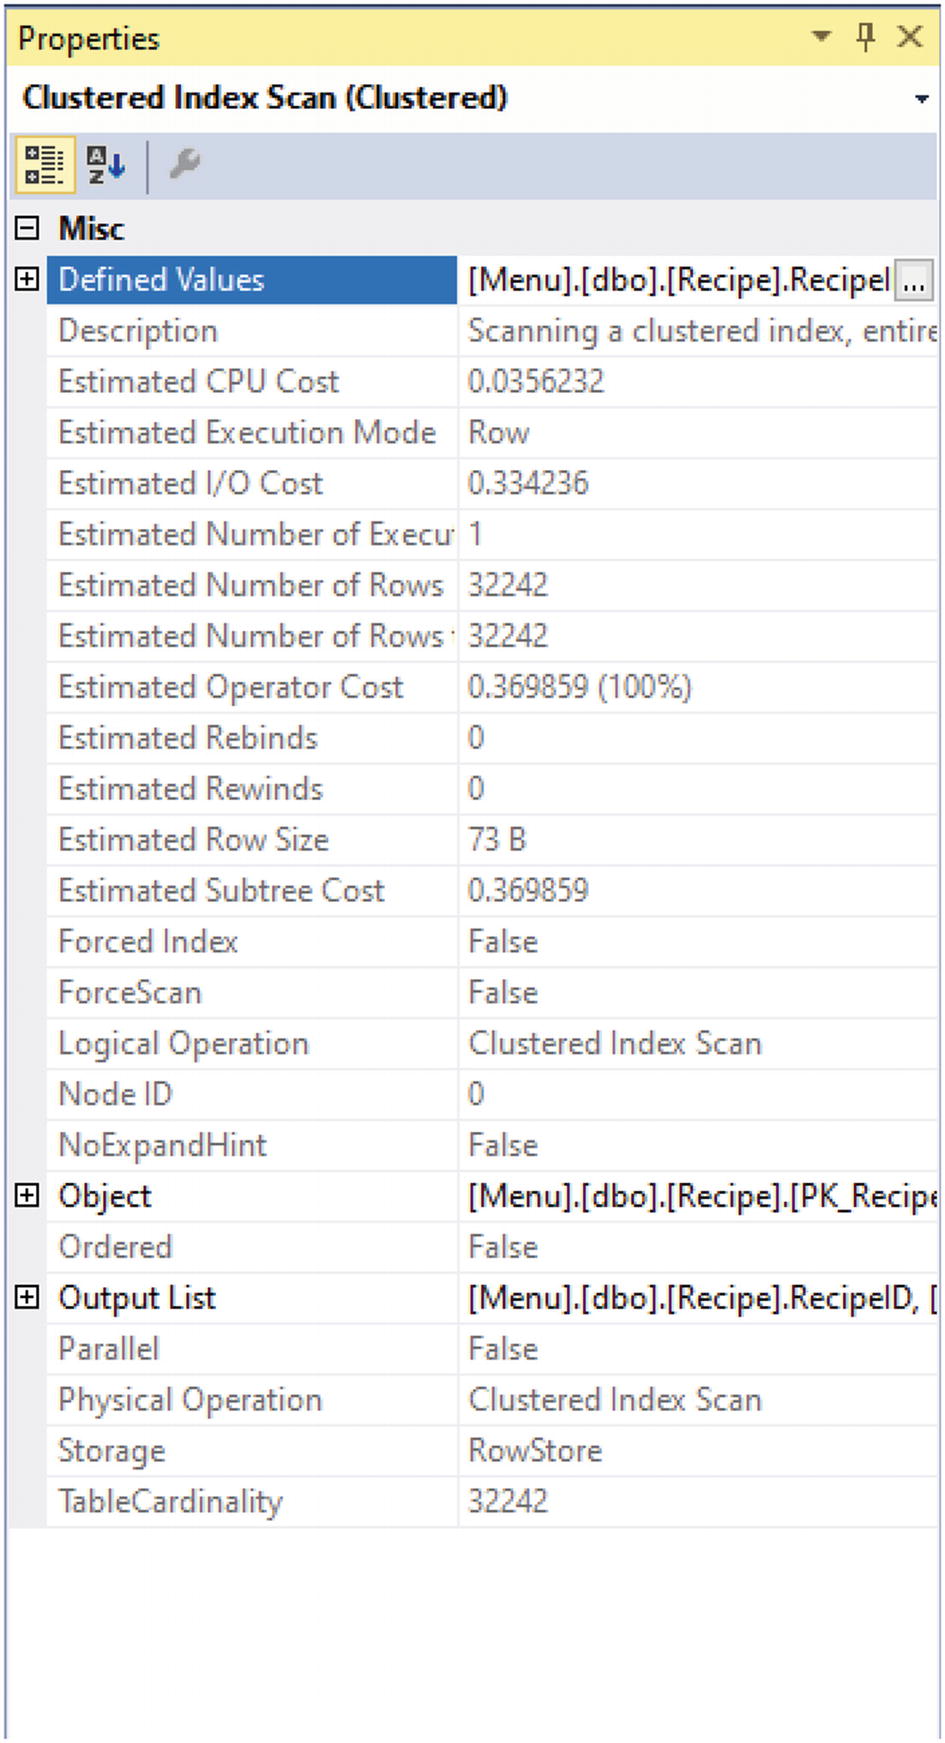
Clustered Index Scan
This does mean that SQL Server looked through the data as sorted by the clustered index but had to scan through the table to find all the records needed to satisfy the query requirements.
SQL Server uses the term seek to indicate that the requested data could be found without searching a significant portion of the reference index. When the entire table or a significant part of the table needed to be searched, SQL Server refers to this as a scan. While seeks or scans can apply to clustered indexes, they can also apply to non-clustered indexes. Non-clustered indexes are not sorted in the same order as the clustered index or the table, if the table is a heap. The non-clustered index is sorted in the order of key columns specified in the index. If there is a clustered index on the table, the non-clustered index will have a pointer back to the clustered index. If there is no clustered index, then the non-clustered index will point back to the row ID in the table.
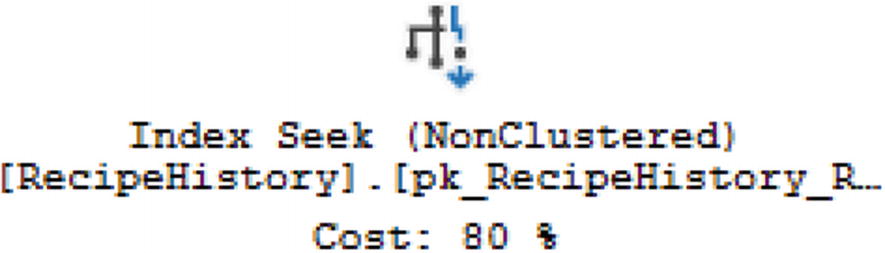
Index Seek
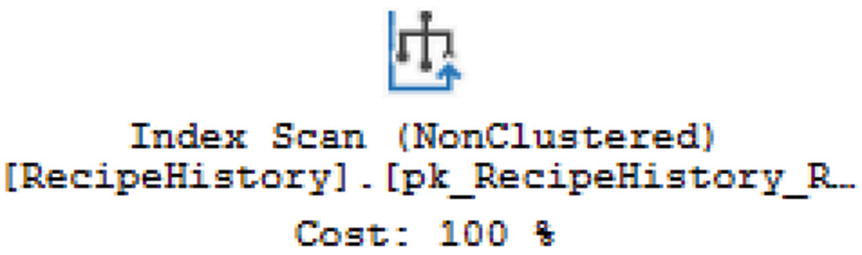
Index Scan
Also, like Clustered Index Scans , if you see an Index Scan, you may want to see what can be done in terms of rewriting T-SQL to use an Index Seek instead.

Key Lookup
When you see a Key Lookup, that lets you know that not all of the information needed for your query existed in the non-clustered index. In these scenarios, it signifies that the index may need to be modified to include those columns. Before deciding to add these data fields as included columns, you should be aware that including the columns in the index may have an additional cost associated with writing or updating the index.
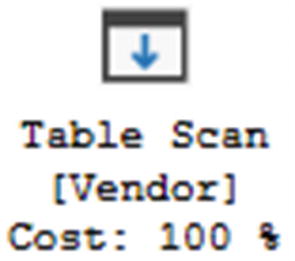
Table Scan
Some tables that are very small may not need to have indexes, and using a Table Scan may be acceptable. If there are many records in the table, then a Table Scan is not ideal. When this is the case, you may want to investigate if there are any possible indexes that can be added to the table.
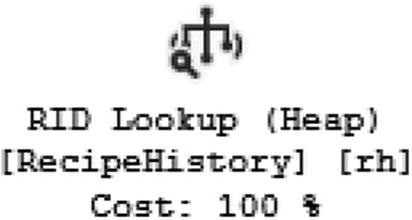
RID Lookup
Like the Key Lookup, you will want to see if you can alter any non-clustered indexes to include the necessary columns from the T-SQL code. It is also possible that the query can be modified to exclude the columns that are causing the RID Lookup.
Query to Get Ingredients
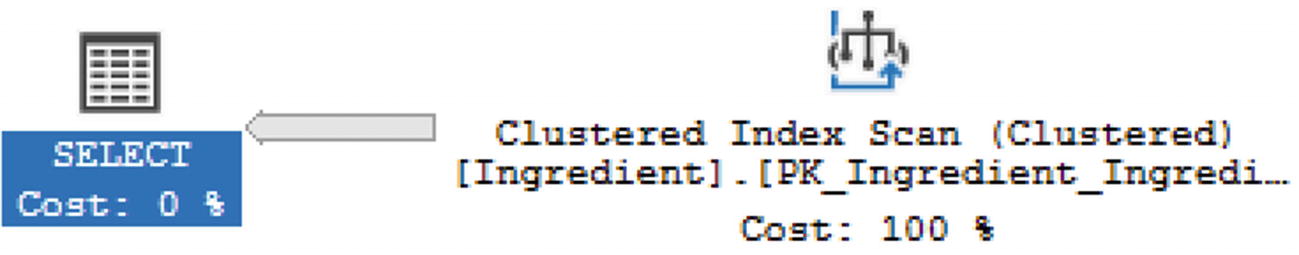
Execution Plan with Only Clustered Index
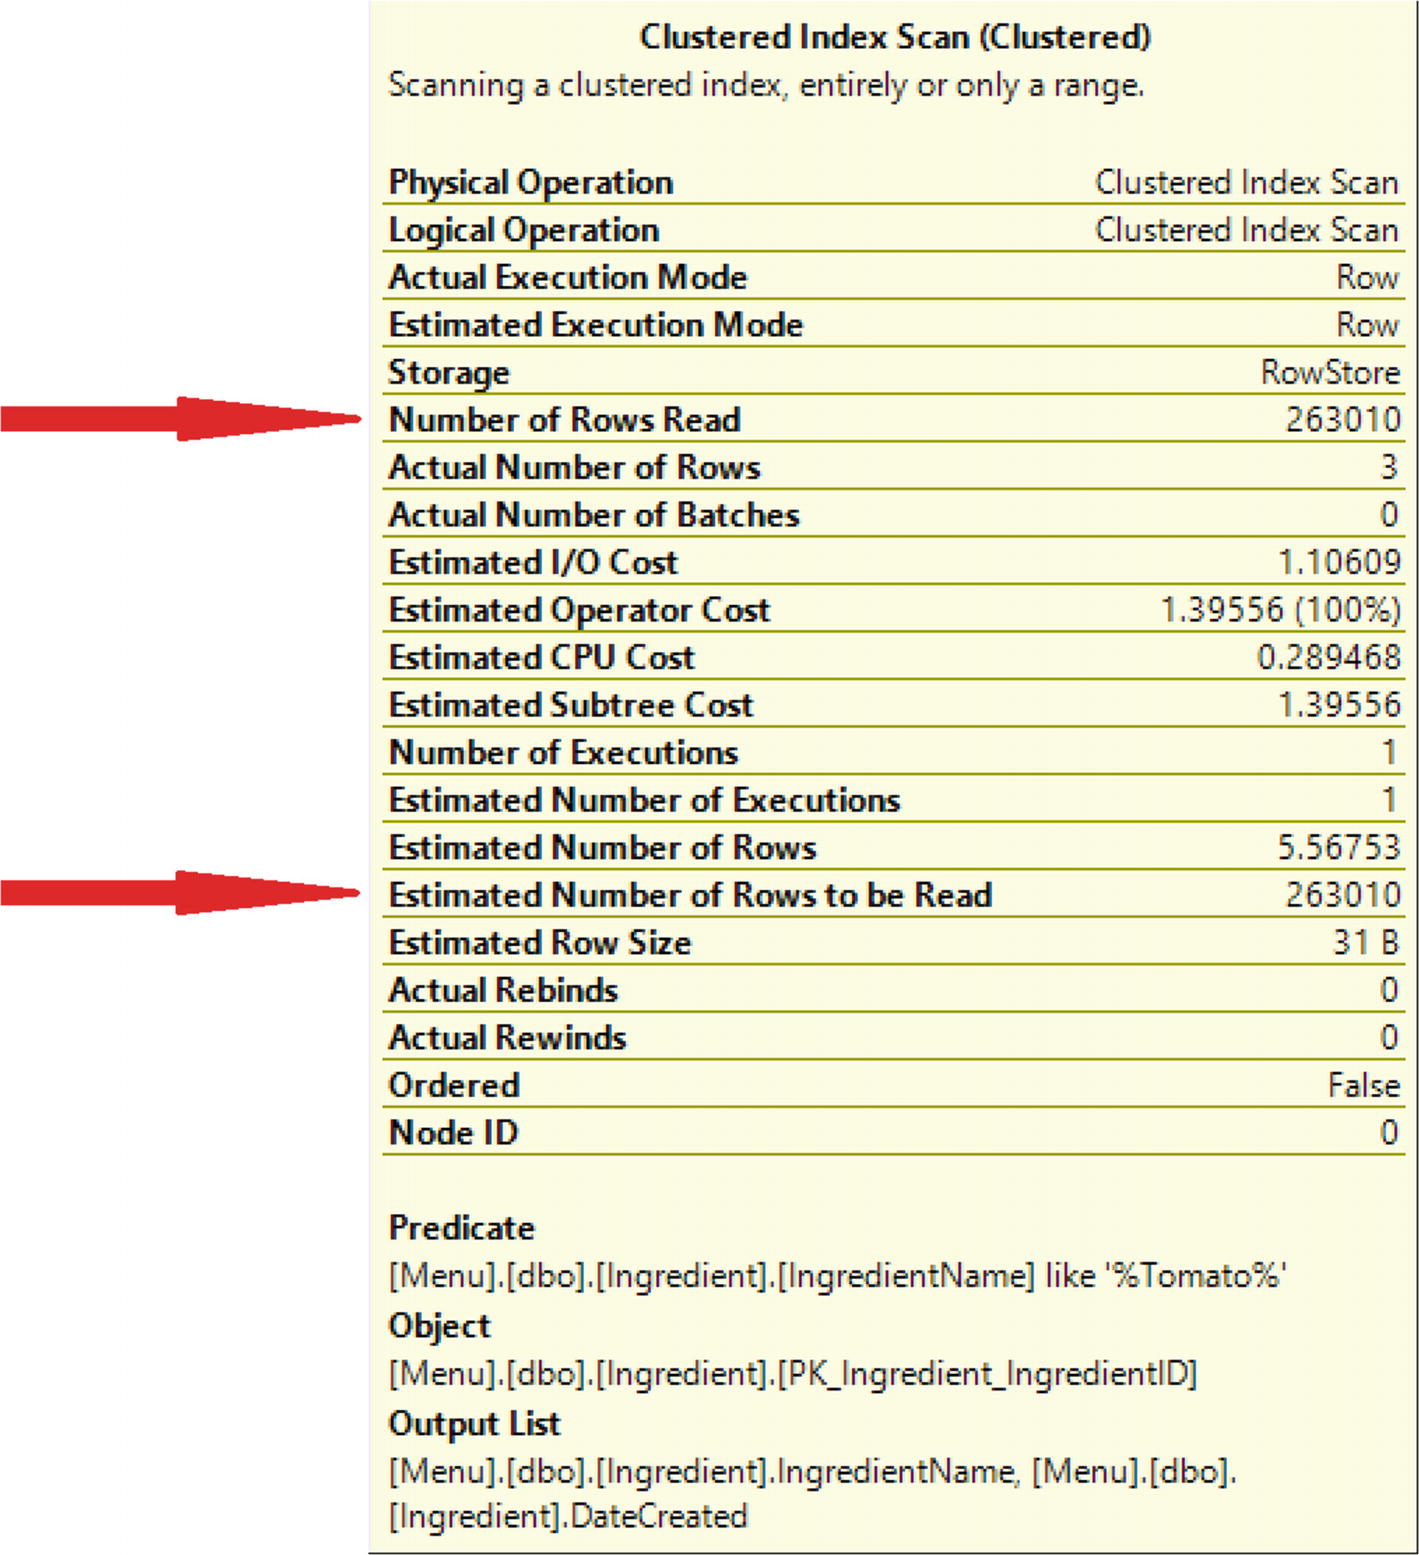
Reads with Clustered Index
Looking at the estimated and actual number of rows to be read, the rows to be read are the same for both. The total for each was 263,010 rows read. The actual number of rows is 3. SQL Server must search 263,010 rows to find the 3 rows that matched the criteria.
Create Non-clustered Index
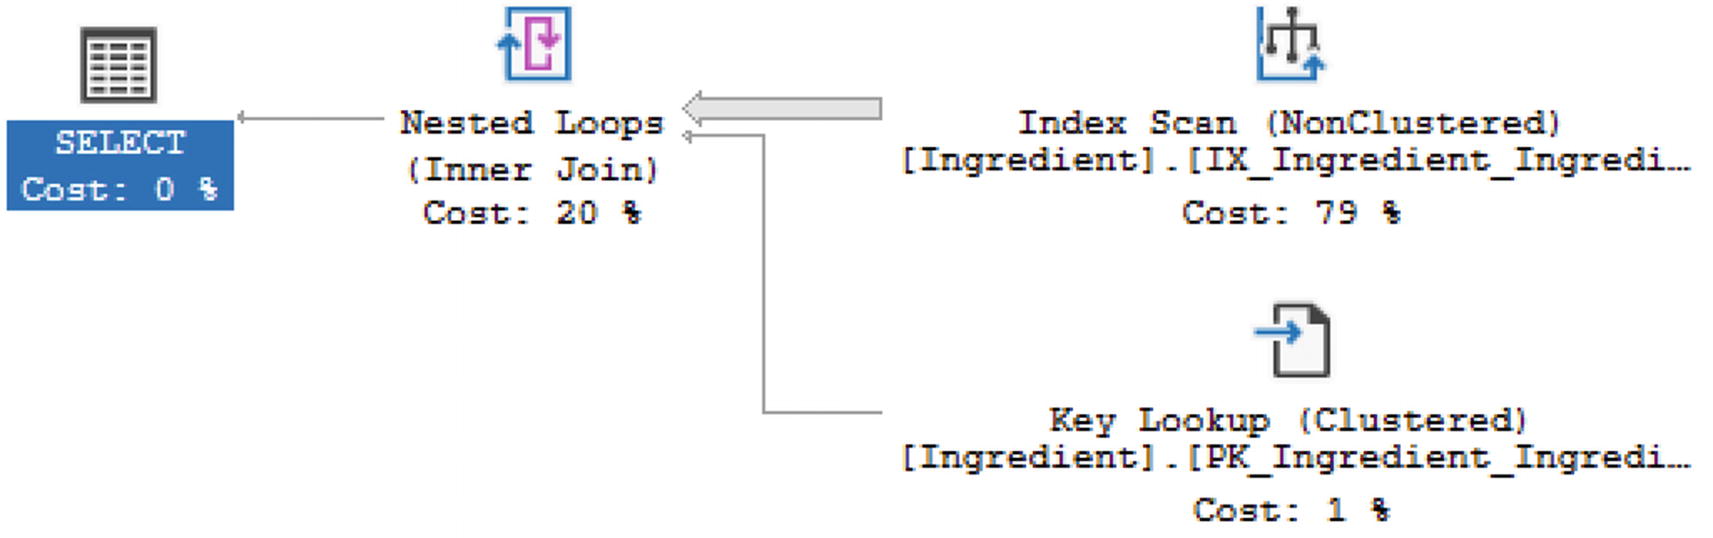
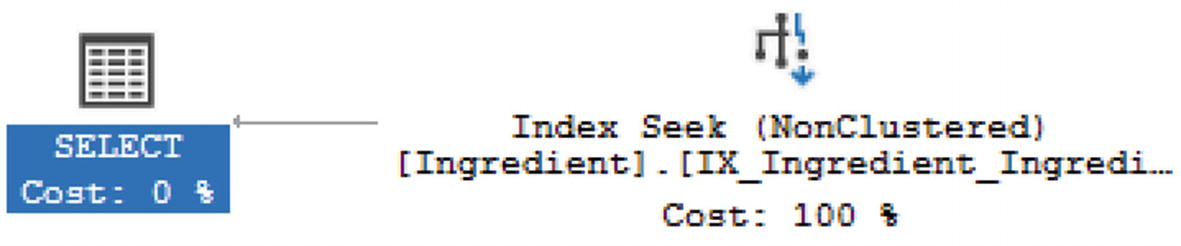
Execution Plan with Non-clustered Index
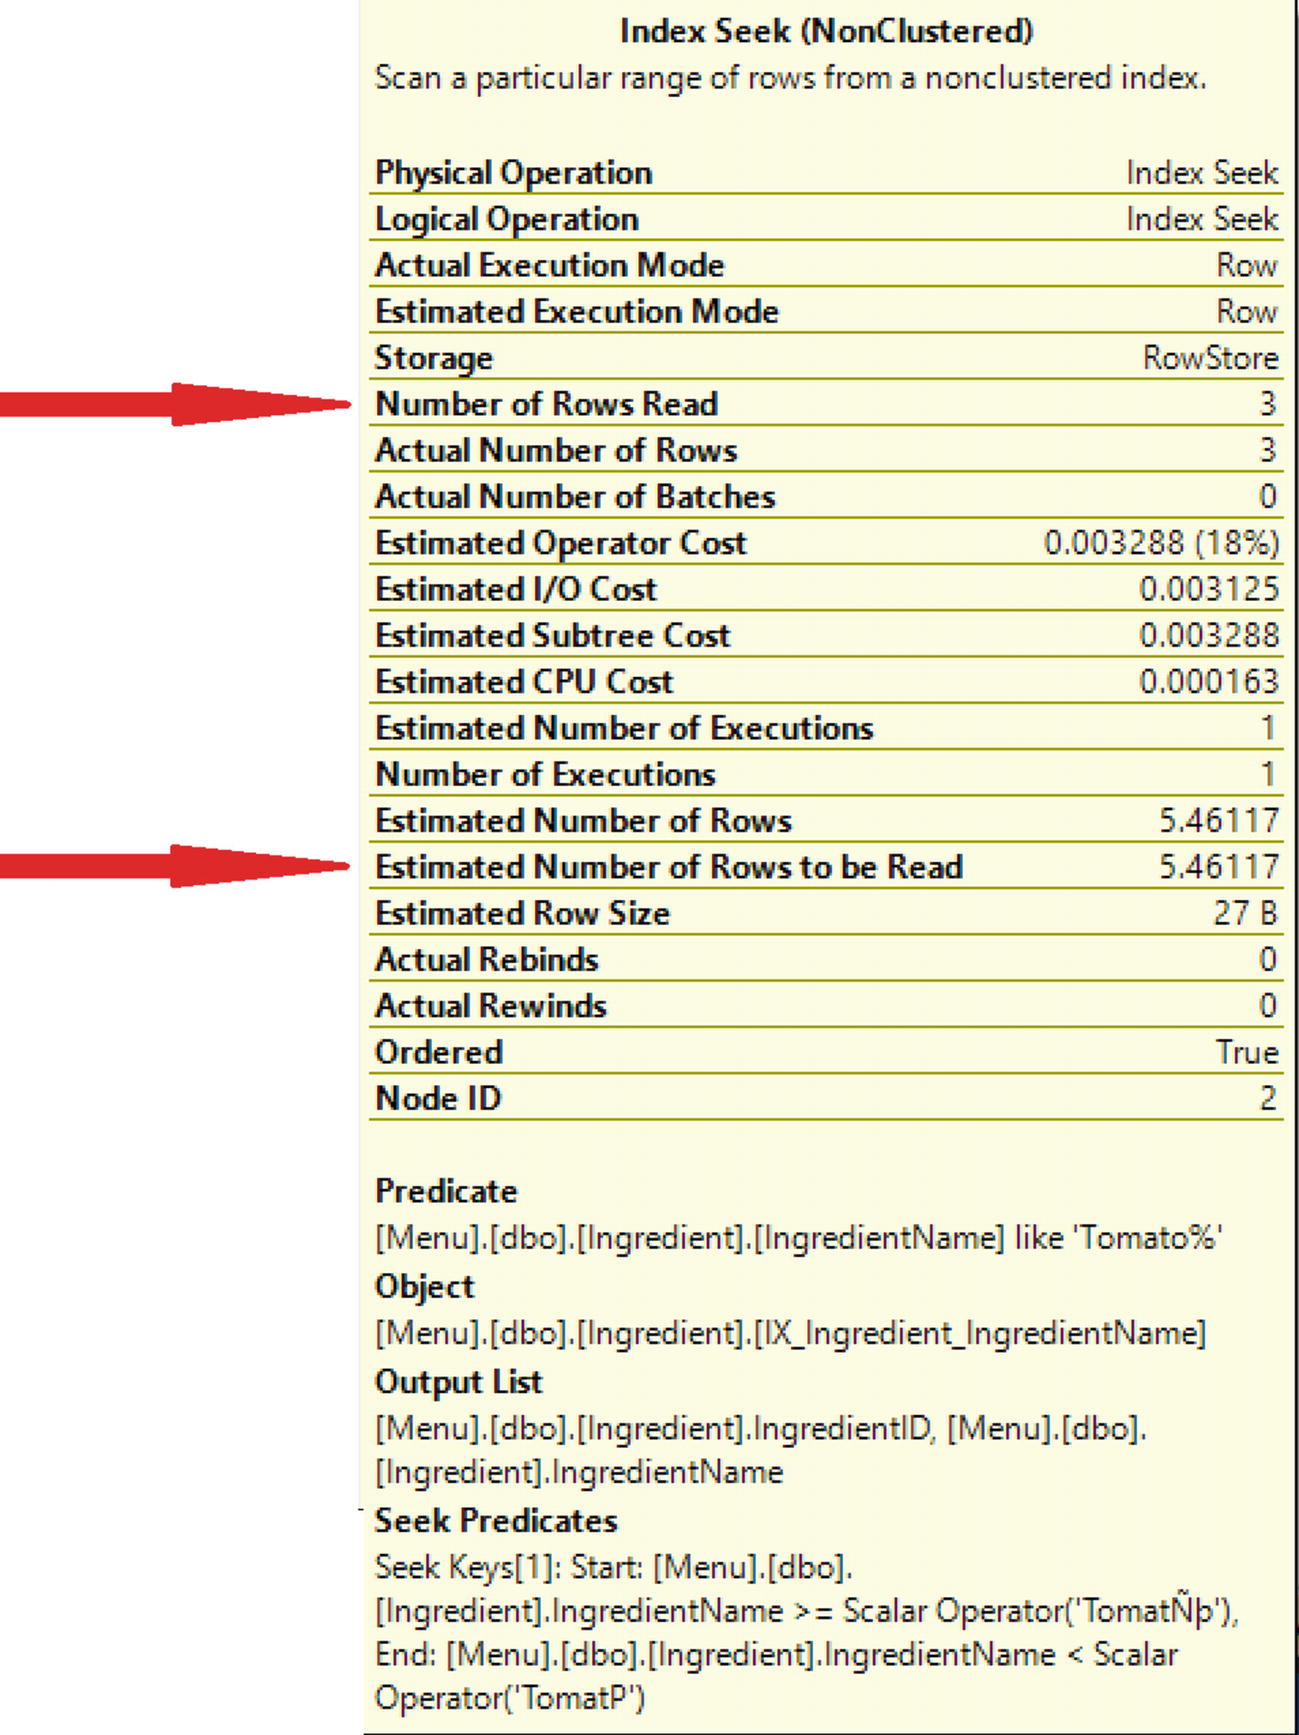
Properties for Index Seek
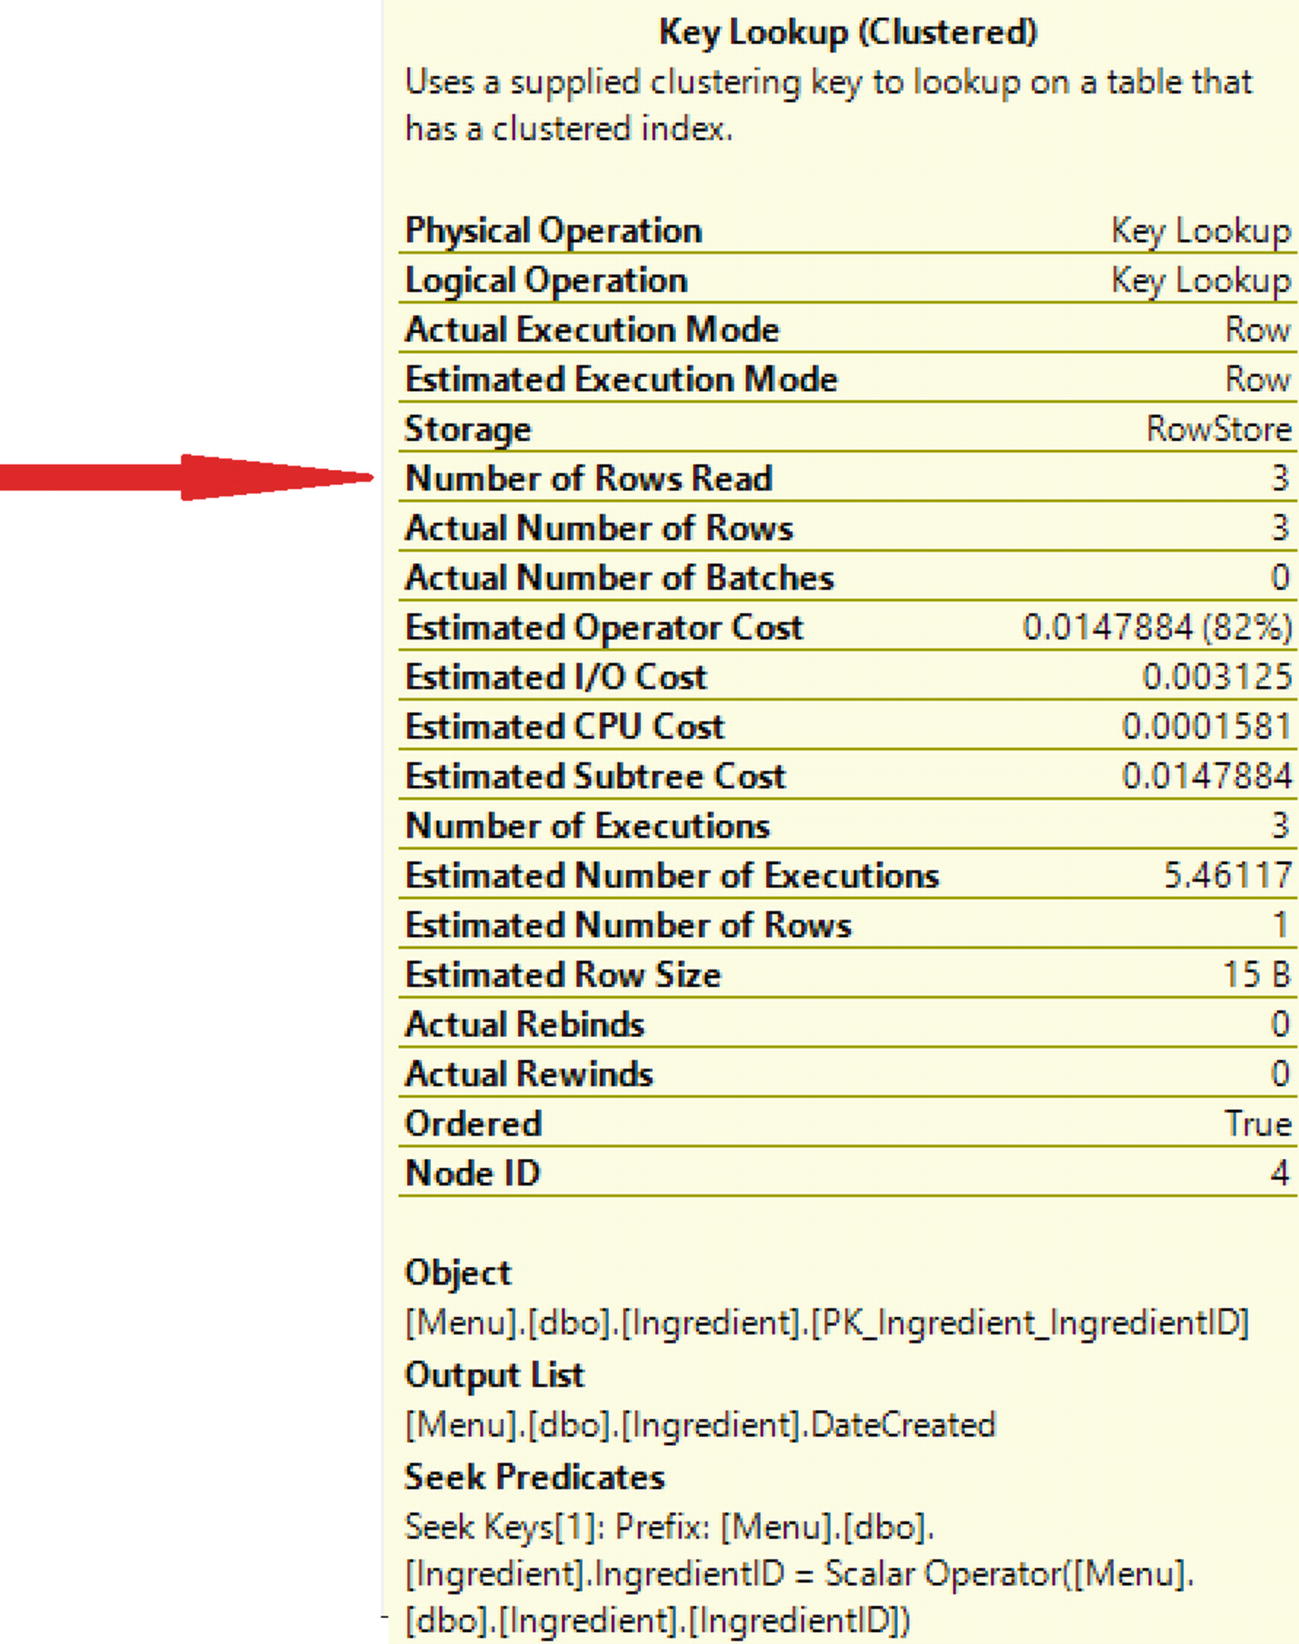
Properties of the Key Lookup
Reviewing the Key Lookup, there were also three rows read in the Key Lookup. The T-SQL code without the non-clustered index had reads of 263,010. The total number of rows read with the non-clustered index is six.
Non-clustered Index with Included Column
Execution Plan with Non-clustered Index and Included Column
The execution plan is showing that the query is still using the non-clustered index. Since this index has changed to include the additional column in the select statement, the execution plan has changed. Previously, with the non-clustered index, the execution plan had an Index Scan and a Key Lookup. Now the execution plan is using an Index Seek.
Once you get familiar with reading execution plan, you can start using execution plans to help you determine how to improve performance. When you look at your execution plan, you may find a Clustered Index Scan. Generally, this implies that SQL Server had to look through the entire table to find the data that meets the query criteria. As shown in this section, creating a non-clustered index that includes the join criteria can help improve the performance of your query. If you find that SQL Server is having to perform a Key Lookup, you can see if it makes sense to include the columns being selected as part of the non-clustered index. Understanding how SQL Server uses indexes can help improve your query performance. Understanding how SQL Server compares data from more than one data set can also help you improve query performance.
Logical Join Types in Execution Plans
In addition to reading execution plans and understanding indexes, your T-SQL code can also be used to determine how an execution plan will be generated. In some cases, how tables are joined together is just as important as how data is stored in the tables. There are times where how you are joining your columns together may also affect your execution plan. Some T-SQL in the WHERE clause can impact what types of logical joins are used in the query execution. If multiple queries are combined, it is also possible that it may change how the query is executed. Ultimately, there is a relationship between how the T-SQL code is written and how SQL Server decides to execute the query.
There are several different logical joins in SQL Server. Some of these logical joins are easily visible in T-SQL. This includes the INNER JOIN, LEFT OUTER JOIN, RIGHT OUTER JOIN, and FULL OUTER JOIN. These are not the only logical joins that exist in SQL Server. With some T-SQL commands, SQL Server will compare one table to another looking for records that match or not. In these scenarios, SQL Server does not perform a full join but a SEMI JOIN. This type of join is not specified as a T-SQL command, but some T-SQL commands like EXISTS or NOT EXISTS will indicate a SEMI JOIN. Available semi joins include the LEFT SEMI JOIN, LEFT ANTI-SEMI JOIN, RIGHT SEMI JOIN, and RIGHT ANTI-SEMI JOIN. Finally, there are some logical joins that are related to combining two or more query results in the same transaction. This can include CONCATENATION which is often associated with a UNION ALL or the UNION logical join which can happen with a UNION in T-SQL. Based on the logical join, SQL Server will determine what physical joins can be used. In this way, logical joins can be used to affect query performance.
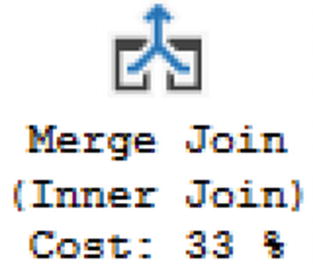
Merge Join

Hash Match
Nested Loop
Starting in SQL Server 2017, there is a new physical join operator that can be used when SQL Server determines an execution plan for a query. This new physical join operator is intended to help in situations where the data stored in a given table may vary significantly based on the criteria in the WHERE clause . This type of physical join allows SQL Server to determine if a Hash Match or Nested Loop should be used depending on the data selected for the query. This is referred to as an Adaptive Join. In SQL Server 2017, Adaptive Joins were only available with columnstore indexes. This has changed for SQL Server 2019.
Going through the logical joins that are available, the next one on the list is the LEFT OUTER JOIN and the RIGHT OUTER JOIN. In some ways, these two types of logical joins are the same but also different. For instance, Nested Loops can only use a LEFT OUTER JOIN. If a query is written using a RIGHT OUTER JOIN, SQL Server will incur an additional cost to convert a RIGHT OUTER JOIN to a LEFT OUTER JOIN. Except this specific scenario, all physical join types support the use of LEFT OUTER JOIN. In previous versions of SQL Server, it was possible for SQL Server to generate two different execution plans depending on whether a LEFT OUTER JOIN or a RIGHT OUTER JOIN was used in the query. This was due to the limitations around how joins can be reordered.
Primary Key to Sort Data by RecipeIngredientID
Outer Join Between Recipe and RecipeIngredient
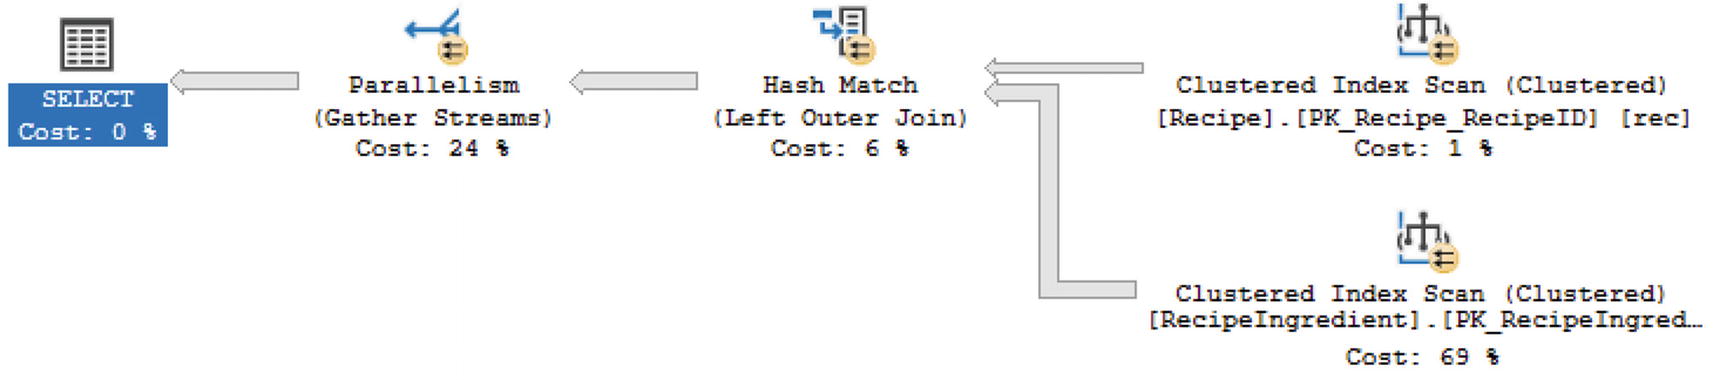
Execution Plan Using Hash Match
Change Primary Key to Sort Data by RecipeID
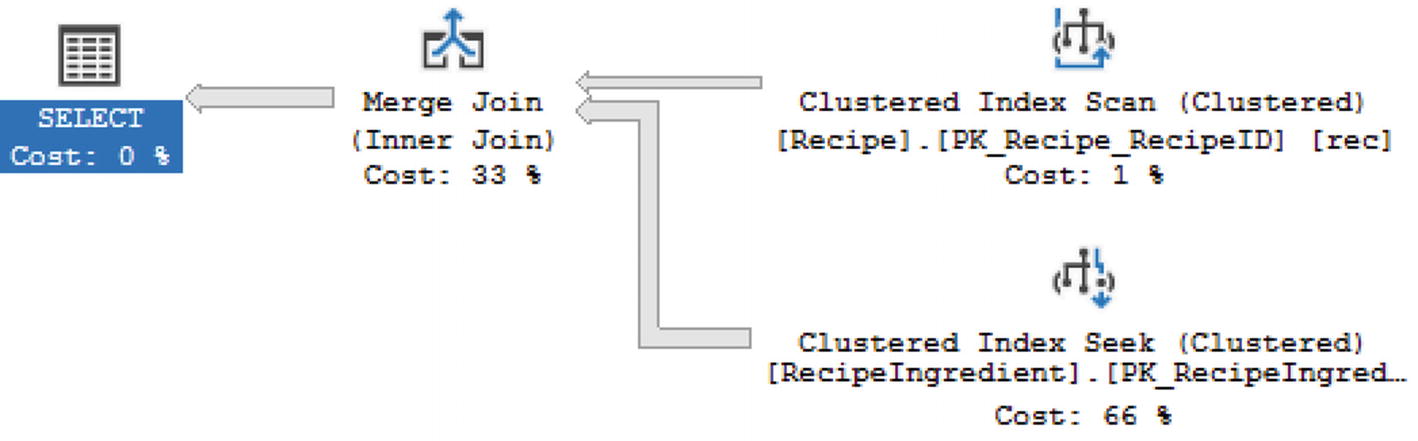
Execution Plan Using Merge Join
Full Outer Join with Inequality
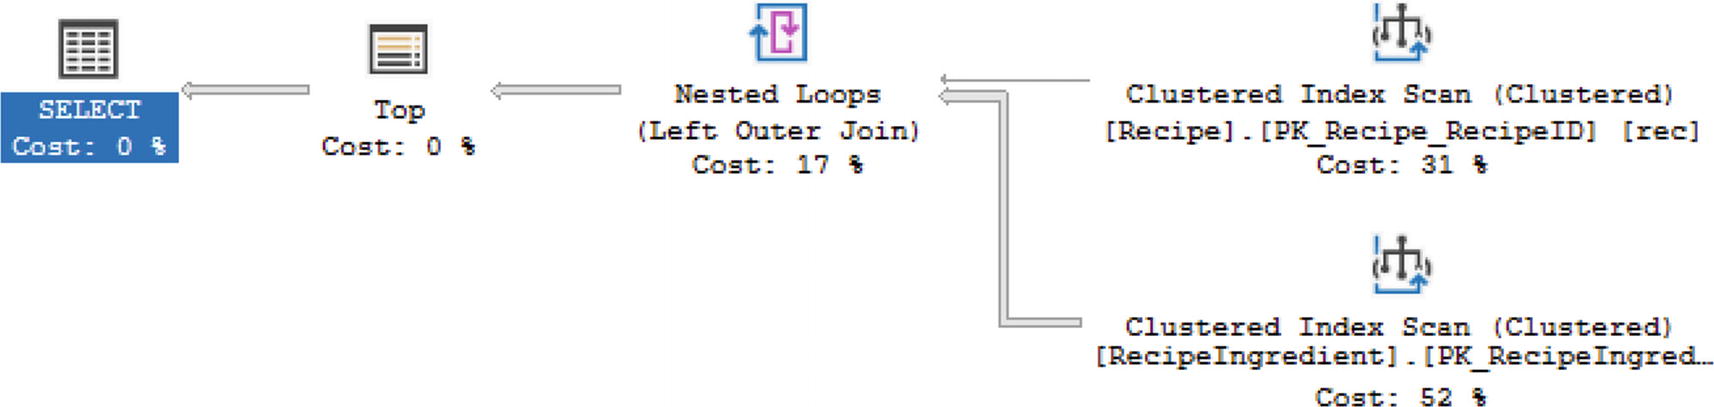
Execution Plan Using Nested Loop
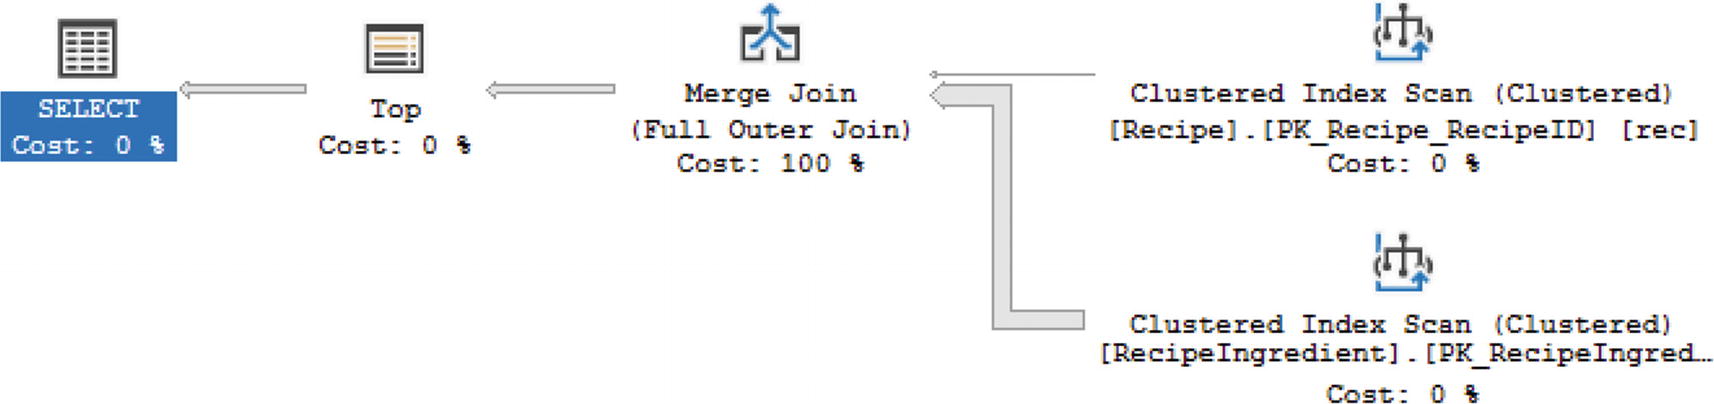
Execution Plan Using Merge Join
Figure 7-28 shows us that it is possible to have a Merge Join when there is an inequality. However, only when the tables are sorted and there is an inequality is where you can see a Merge Join with a FULL OUTER JOIN. In addition to T-SQL joins that relate to logical joins, there are other logical join types that SQL Server can use.
All Ingredients Except Those in RecipeID 2
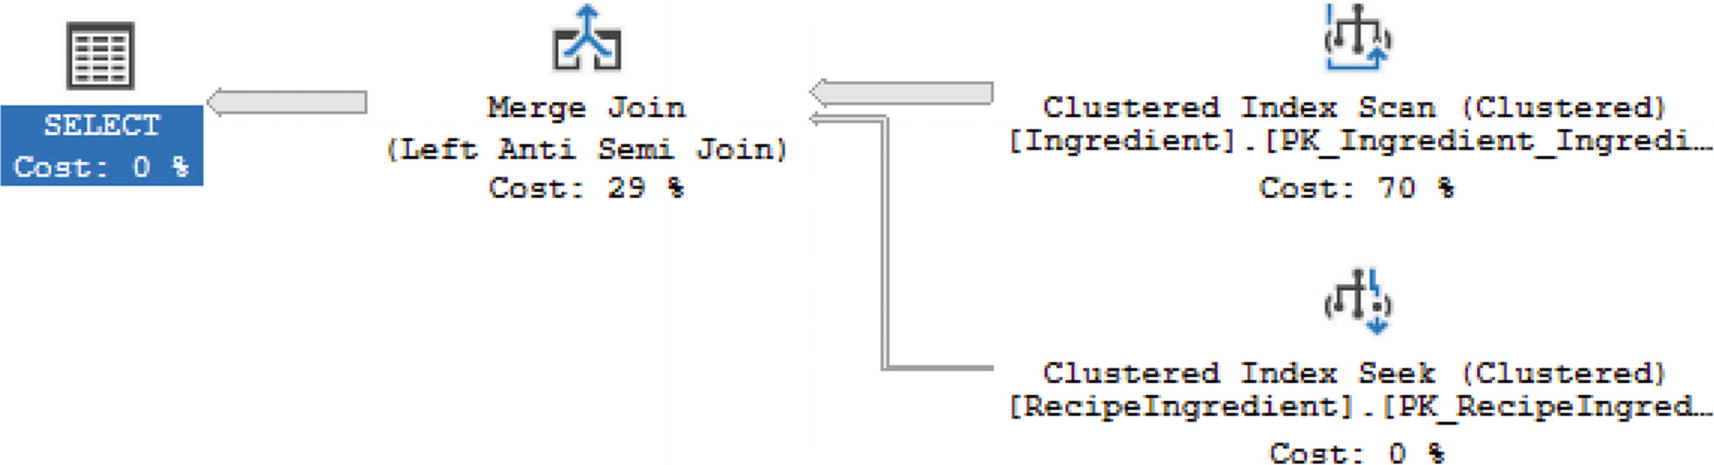
Execution Plan with Left Semi Anti Join
All Ingredients in All Recipes up to RecipeID 200
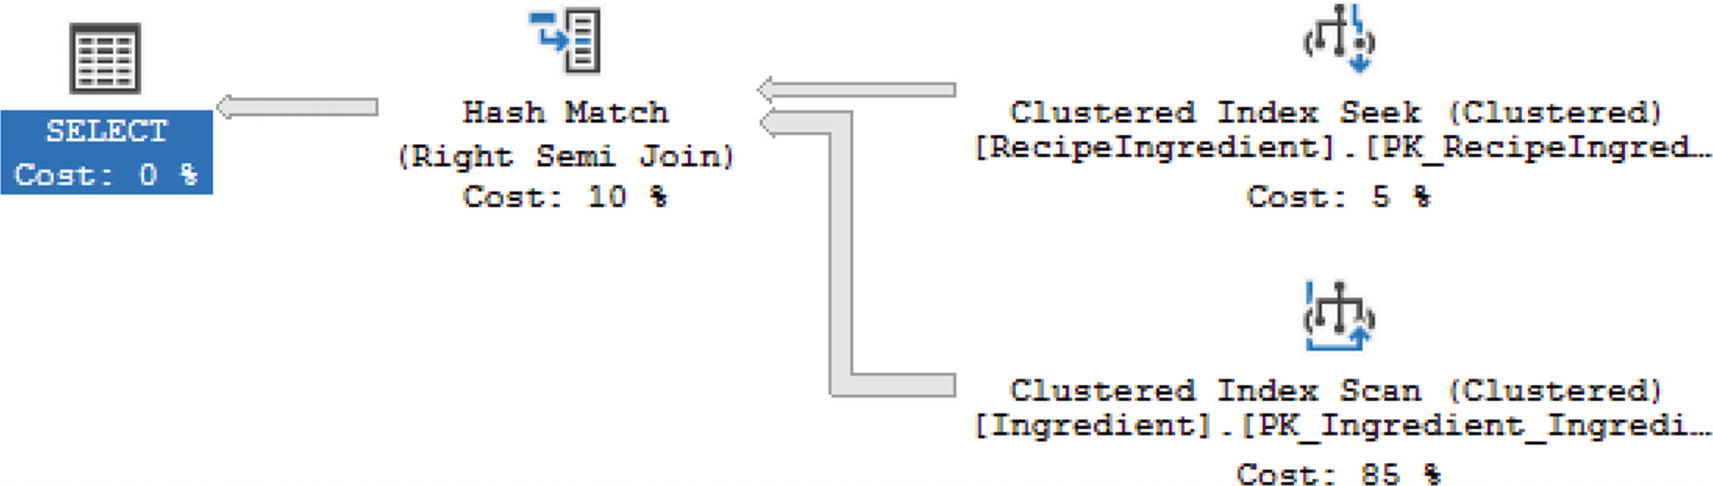
Execution Plan with Right Semi Join
All Ingredients in RecipeID 2
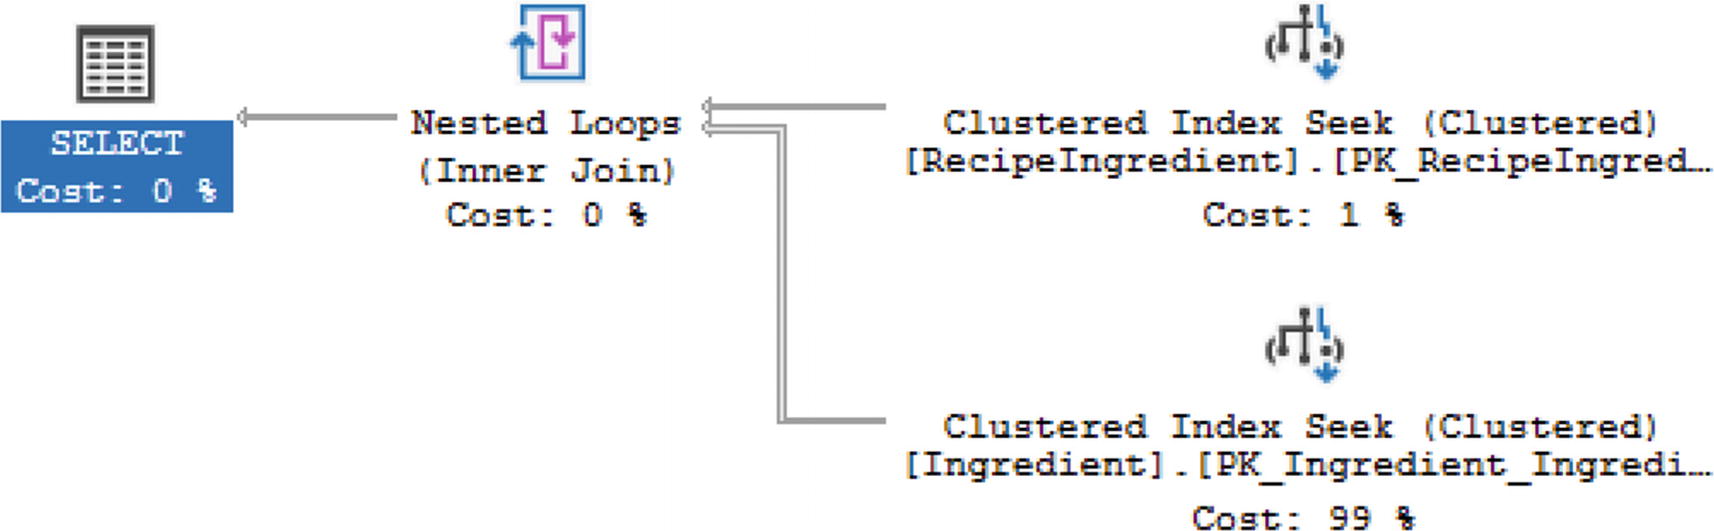
Execution Plan with No Semi Joins
For this execution, SQL Server has decided to convert this T-SQL to act like an INNER JOIN instead of a SEMI JOIN. This is because SQL Server has calculated that this will give the best execution out of those evaluated.
All Ingredients with Tomato

Execution Plan with Concatenation
In the case of this query, SQL Server is not joining the data together as it has in the other examples from this chapter. Instead, there is only one operator, Concatenation, that indicates how SQL Server is combining this data.
Overall, the goal is to use the physical join that is the most effective for the data that is being joined. Merge Joins can perform very well, but they are limited to data that has been ordered by indexes or ORDER BY or GROUP BY statements. As expected, Index Merge Joins will perform even better than Merge Joins that do not use an index. When data is not sorted and particularly if one of the two sides of the data being joined is small, SQL Server may use a Nested Loop. You will want to confirm that the cost of looping through the other table does not incur a significant cost. Just as a Merge Join using an index performs better than a Merge Join without an index, the same is true for a Nested Loop. For both a Merge Join and Nested Loop, see if you can alter your T-SQL code to use an index. This does not mean creating an index if one does not exist; instead, you can check the indexes on the table and see if any will apply for your specific query. If the tables are not sorted and particularly if the numbers of records being joined on either side are both large, the Hash Match can be the ideal solution.
Throughout this chapter, we have gone over various aspects of working with execution plans. We started with some of the ways you can access and view execution plans. We also discussed how estimated execution plans, actual execution plans, and executions in the plan cache differed. When looking at execution plans, there are some items such as arrow sizes, estimated number of rows, and actual number of rows that can give you some hints regarding the next steps you can take to improve the performance on your T-SQL code. After looking into these items, you may also be able to check how the execution is using indexes. It is helpful to not only focus on what indexes are being used but how SQL Server is searching through those indexes. When joining tables, you will use T-SQL code that can reference certain logical join type behavior. These logical join types can affect what types of physical join types will be used as part of the execution plan. By writing your T-SQL code differently, you may be able to impact the execution plan generated by SQL Server. Using all the information covered in this chapter should help you get more comfortable with reviewing your T-SQL code and improving the speed and hardware usage associated with your T-SQL.