
In this part of the book, I have gone over many aspects of writing T-SQL code. I started with going over the use of set-based design in queries. When designing queries, it will also be important to design queries that use hardware effectively. One way that you can check the performance of your queries is using execution plans. Once you have an execution plan of a query you are wanting to improve, you can start focusing on how to optimize the query. There are some options available when it comes to optimizing T-SQL.
You have many options available to you when you start working on performance tuning your queries. In the past, one option you would have would be to manually identify poorly performing queries and improve them. When identifying queries that need to be optimized, there are many different factors that you can take into consideration. Starting in SQL Server 2017, additional functionality has been added that allows SQL Server to automatically improve the performance of certain aspects of executing T-SQL. With SQL Server 2019, there have been even more enhancements to help queries run better and faster without changing the underlying T-SQL code.
Optimizing Logical Reads
I have seen T-SQL code that appears to run well. The code executes in a timely fashion and returns the correct results. When you look at one of your SQL Server monitoring tools, you may notice some unexpected behavior that indicates there is a performance issue on your system. In some cases, you may find queries that are reading pages from memory that are not included in the result set. Reading the data pages can be identified as logical reads. You will want to look at the execution plan for the T-SQL code to figure out what could be causing this discrepancy. This does not only involve looking at what T-SQL code is executing but also trying to determine what can be done to improve performance.
The advantage of optimizing this query to use less reads is that this should decrease the number of data pages that are read into memory as part of this query execution. Put another way, the downside of reading more data than is needed for the query result is that pages that are used more frequently by the applications may be cleared from memory too soon. Unfortunately, we often are only aware of performance issues when we find out that an application is running slowly or an application is crashing. At these times, it can be difficult to diagnose the specific query causing issues. If you do not have access to monitoring software, this situation can become even more difficult to troubleshoot. When I first started investigating performance issues, I would check SQL Server Agent’s job history. Sometimes you will find a process running at the same time as the Production issue. While this does not confirm that the SQL Server Agent job is the cause, it may be worth investigating.
For these situations, it would be preferable to know the exact stored procedure or prepared statement that is causing performance issues. Aside from third-party software, Query Store or extended events that were previously set up, you may have very few options available. In addition, I would rather identify queries that may cause performance issues before there is an outage. If I do not have access to third-party tools, I will use DMVs to try and find queries before they become an issue. I will often use any combination of the preceding actions with Performance Monitor to help track SQL Server over time and confirm if my performance tuning is effective.
If you do not have third-party tools or you want to get more familiar with DMVs to find T-SQL that needs performance tuning, you can query sys.dm_exec_query_stats. This DMV tracks statistics about T-SQL code that is executed and is still part of the plan cache. This will only return results for queries that have not been cleared out of the plan cache. If you believe that this DMV is missing some stored procedures that you would expect to see, you may want to do some research on your plan cache and determine if the cache is getting filled with ad hoc queries. You will need to join this data to sys.dm_exec_sql_text to find the T-SQL code associated with the statistics.
When trying to find queries with high logical reads, you will want to look at T-SQL code based on various criteria. Looking at the average logical reads is usually my main target when looking for queries to performance tune. I prefer this metric as it often identifies T-SQL code that runs frequently on the server and probably has more reads than I would expect. If there is a process that runs frequently on the server, I would not expect the average number of reads to be very high as a frequent process would imply the T-SQL code is directly related to an application. There are also some queries that do not run very often but use a high number of logical reads when they do run. In my experience, if the total logical reads are high and the overall execution count is low, I will prioritize these queries below T-SQL code that has a higher average logical read value and a high number of executions.
Original Query for Recipe and Preparation Details

Partial Execution Plan for Listing 8-1
The execution plan has one thick line that results in a thin line after the Hash Match. This is a good indication that the query may be able to be optimized to use less reads overall. Based on this information, I need to investigate how the data from dbo.Recipe is combined with dbo.RecipeIngredient. Looking at either the T-SQL code or the output of the T-SQL code, I can get a better idea of what the purpose of this query is. This query is returning all ingredients where the cost has changed three times along with information about what recipes use these ingredients.
Query for Index on RecipeIngredient
The non-clustered index does not change the order of the data in the table, but the index does keep the data for the index ordered. In this case, the index orders all the data first by the value of the IsActive column, then by the IngredientID. The non-clustered index also must be able to reference back to the clustered index for situations where SQL Server decides to use this non-clustered index but also may need some additional data from the table. SQL Server does this by including the columns for the clustered index as part of this index. This helps us because this means the RecipeID from this index can be used to find all RecipeIDs with this ingredient.
Optimized Query for Recipe and Preparation Details
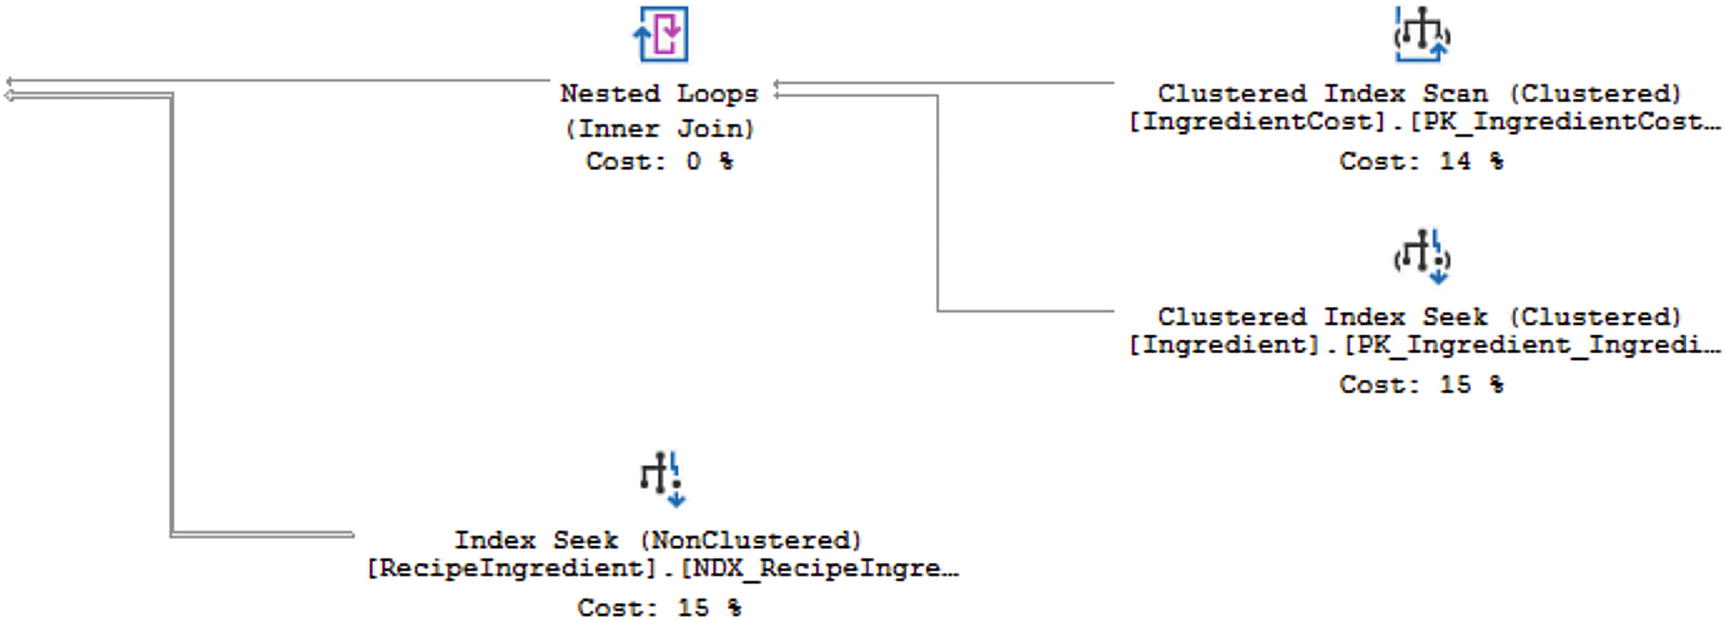
Partial Execution Plan for Listing 8-3
There are a couple of changes that happened. Looking at the execution plan overall, you can see that all the lines are much thinner than they were before. While the order of some steps has changed, the largest different is related to the non-clustered index. In Figure 8-1, SQL Server was performing an Index Scan on this index. Now that I have specified the IsActive column as part of my query, SQL Server is now using an Index Seek on this same non-clustered index. Not all attempts to optimize your T-SQL code are this simple. However, it is possible for you to make dramatic improvements in your T-SQL code when you understand how your data is stored and how the indexes on your tables reference that data.
Optimizing Duration
My goal when working with SQL Server is to have the queries executing T-SQL code run as quickly as possible. I tend to focus on logical reads as I want to minimize the number of data pages going into the cache that are not needed by the query that is being executed. However, there are other issues that can happen in SQL Server that can have negative effects downstream.
Prior to SQL Server 2019, one of the most common reasons for slow queries was parameter sniffing. The Adaptive Join in SQL Server 2019 has helped minimize issues associated with parameter sniffing. If an execution plan has an Adaptive Join, SQL Server will determine at execution time whether to use a Merge Join or a Nested Loop. The flexibility of the Adaptive Join allows the execution of T-SQL code to execute one way if there is a small set of data and use a different physical join if there is a larger set of data. This will cause the execution of the query to perform better regardless of the data being retrieved.
Working to find the queries that have the slowest durations can be challenging especially if you are trying to find real-time data regarding query performance. Thankfully, SQL Server does keep track of query performance for T-SQL code that exists in the query plan cache. You can use the same DMV from the previous section, sys.dm_exec_query_stats , but instead of looking for records with the highest total logical reads or average logical reads, you will want to look at worker time. You can either start with total worker time or average worker time. Depending on what time of day your queries are running may help you decide which to focus on first. If one of the queries with the highest worker time is running during the most active time for your business, I would address that query first. However, if you have T-SQL code with the highest average worker time running frequently throughout the busy time of your day, you may see more benefit by working on this code first. Either way, you will want to look up the plan in sys.dm_exec_sql_text that matches the plan from sys.dm_exec_query_stats to find the associated query text.
Original Query for Recipe Information for All Recipes
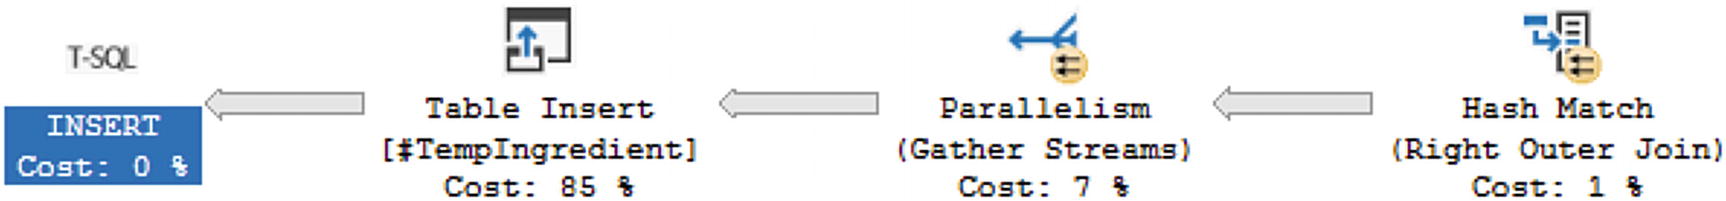
Partial Execution Plan for Listing 8-4
Optimized Query for Recipe Information for All Recipes
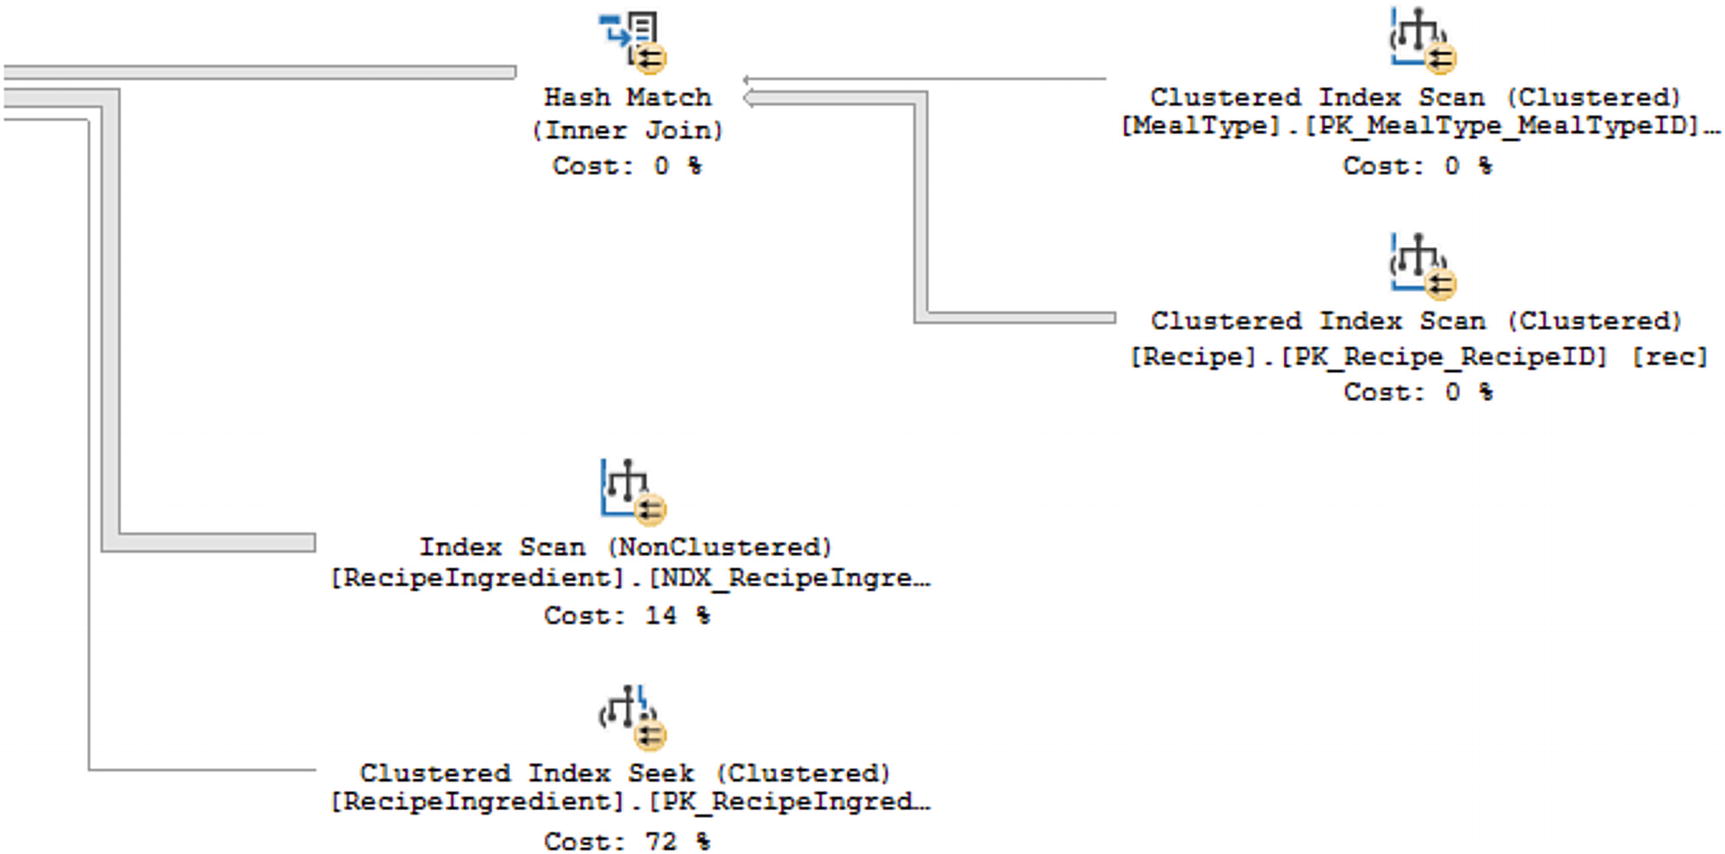
Partial Execution Plan for Listing 8-5
As shown in Figure 8-4, the step taking up the largest percentage of the execution plan has changed. Based on the actual execution plan, the largest percentage is spent performing a Clustered Index Seek on the primary key of the RecipeIngredient table. As this is a seek relating to the primary key of the table, it seems unlikely that there is a better alternative for performance tuning this query.
There are other factors that can contribute to slowness of running queries. In many scenarios, the best way to optimize these queries involves using indexes. You want to check execution plans for Key Lookups. These Key Lookups indicate that SQL Server is having to go from the non-clustered index to the clustered index to find additional fields that are needed as part of the query. In some cases, you may be able to change the values returned or the join conditions of your query to resolve the Key Lookups. Otherwise, you will need to see if the indexes can be changed in order to improve performance.
Creating and maintaining indexes is a topic that could be covered entirely in a book by itself, but there are some things you can do when working with indexes. If you are at a point where you think you may need to consider adding indexes, you will first want to be aware of what indexes currently exist on the tables in question. While it is outside the scope of this book, you will want to determine if there are indexes that are no longer in use and can be dropped. Of the indexes that are remaining, you will want to evaluate these carefully. One of these indexes may be able to be modified to allow it to continue to be effective for other T-SQL code but also to optimize the current query. You can create or modify an index so that additional columns are stored with the index. However, the index is not sorted by these columns. These columns can be referred to as a covering column. If a column is needed for a join or a WHERE clause, I would consider adding it to the index. Before deciding to add the column to the index, make sure you are familiar with how SQL Server uses indexes to search for data. The approach with some indexes involves adding a column as an included column on the index. This will allow SQL Server to return the column results without a Key Lookup, but it will not affect how SQL Server uses the index to retrieve data records.
Optimizing the duration of your T-SQL code can yield many benefits. Among these is improved performance of your applications. In some cases, you may be able to improve the duration of your queries by rewriting the code in a way that is more efficient. In other situations, you may want to consider if there are ways the code can be written differently to make better use of the existing indexes. Another option is to modify existing indexes or create new ones. If you choose to modify indexes, use caution as sometimes indexes can exist that cause more harm than they help. Regularly review the duration of your T-SQL code to see if you can find any queries that need performance tuning.
Automatic Database Tuning
In the previous sections, I have discussed what you can do to optimize your T-SQL code regarding logical reads and duration. Over the past several releases of SQL Server, there have been many changes that can either help you optimize SQL Server or optimize your queries automatically. In some cases, this involves recording information about the performance of your queries. At other times this can be either SQL Server managing your execution plans or your indexes. While the topics covered in this section are related to optimization that SQL Server can perform for you, it is helpful to understand these concepts so that you can have a better idea as to how SQL Server will handle your T-SQL code.
Query Store
When executing queries in SQL Server, one of the key benefits is the use of execution plans. In Chapter 6, I discussed briefly how memory is used in SQL Server, and in Chapter 7, I explained how execution plans are saved in their own plan cache. One of the challenges with execution plans happens when an execution plan gets cleared from the plan cache. Not only was there a cost associated with generating a new execution plan, but there is also the risk that the new execution plan could perform poorly as compared to the original.
Query to Enable Query Store
Enabling Query Store allows SQL Server to keep track of the execution plans over time. In addition to keeping track of execution plans, Query Store also records execution statistics. Starting in SQL Server 2017 and Azure SQL Database, Query Store also tracks information regarding wait statistics for specific query executions. In SQL Server 2016, you would have to manually manage the Query Store to determine if there were better execution plans for your T-SQL code. If you found a query that would benefit from an execution plan in the Query Store, you would need to manually force a plan for that query. This would cause additional maintenance over time as you would need to go back and undo forced plans as the data in your database may change over time.
Automatic Plan Correction
Building on top of the functionality introduced in SQL Server 2016 with Query Store is a new feature introduced in SQL Server 2017. The next step was to see if SQL Server could use the access to historical information about execution plans, execution statistics, and wait statistics for those query executions to the benefit of SQL Server. Like Query Store, this is functionality that can be configured so that no human intervention is required. In order to make that happen, this new functionality also had to include a way to verify the results.
Query to Enable Automatic Plan Correction
Once Automatic Plan Correction has been enabled, SQL Server can compare the new and previous execution plans to determine if the comparison meets the criteria where SQL Server can force the execution plan. In order to make sure that SQL Server did not spend extra effort micro tuning performance, the threshold was set at a benefit of decreasing the CPU cost by 10 seconds or more. The other option was if the number of errors in the execution was less than the previous version. If the new execution plan cost less than 10 extra seconds on the CPU, then SQL Server could force the previous plan automatically. Similarly, if the new execution plan had more errors than the previous plan, then SQL Server could force the previous execution plan.
After SQL Server forced an execution plan automatically, it would continue to monitor performance to confirm that the newly forced execution plan was working as expected. If SQL Server determines that the forced execution plan is no longer providing the performance benefit expected, then SQL Server can undo forcing the execution plan. Automatic Plan Correction does not alter your T-SQL code; this feature only helps manage which execution plan is currently being used for your T-SQL code.
If you would prefer to manually manage your execution plans, you can do so. You will want to make sure that you do not run the T-SQL code shown in Listing 7-8. If you choose to manual plan choice correction, then you will need to regularly monitor which queries need to have plans forced. You will also need to manually undo forcing query execution plans over time as the shape of your data and the associated statistics may change over time. Query Store can be used to monitor execution plans over time starting in SQL Server 2016. With SQL Server 2017, there is also the option of using the DMV sys.dm_tuning_recommendations to find queries that can benefit from forcing an execution plan.
While automatic or manual plan correction is outside the scope of T-SQL, it is helpful to know what SQL Server can do with your T-SQL queries. I would still suggest that you design your T-SQL to run efficiently for a variety of scenarios, but it is nice to know that when there are times that issues like parameter sniffing are unavoidable, there are other options within SQL Server to help your overall query performance.
Automatic Index Management
In addition to allowing SQL Server to manage your execution plans and choose the best available plan, you also have the option of allowing SQL Server to systematically monitor and manage your indexes. This feature is currently only available in Azure SQL Database. Enabling Automatic Index Management allows SQL Server to not only create new indexes that it deems necessary, but SQL Server can also identify indexes that are unused or that seem to be like other indexes that have been created.
Like Automatic Plan Correction, SQL Server will monitor the performance of new indexes. If there are deemed to be less efficient, SQL Server will remove those indexes. The same process will be used if SQL Server modifies or drops indexes. It will still be possible to manually manage your indexes while using Azure SQL Database. However, allowing Azure SQL Database to promptly find and resolve indexing issues may save you money as less resources may be required to perform the same tasks.
Intelligent Query Processing
Along with the ability for SQL Server to automatically manage execution plans and indexes, there are other new features that can help automatically optimize T-SQL code performance. As discussed in Chapter 6, memory is a key resource used by SQL Server. When using memory with SQL Server, we want to be sure that memory is being used as efficiently as possible. Working with data sets is also critical to working with SQL Server. If SQL Server can convert a collection of rows into a batch and then perform any necessary actions, this will help optimize the query. The shape of the data is not always consistent in a data table. In those scenarios, it may be helpful to have an execution plan that is flexible depending on the types of data pulled back. These features can help improve the efficiency of the T-SQL code that is being executed.
Memory Grant Feedback
When executing a query, SQL Server will try to estimate the amount of memory required for that transaction. The amount of memory allocated to a query based on the estimate is referred to as a memory grant. While it is ideal that the SQL Server estimate the memory correctly, there are times where the amount of memory estimated does not match the amount of memory used. Memory Grant Feedback first became available in SQL Server 2017. The original memory grants were for batch mode operations. That is a type of operation where records are processed as a unit instead of row by row.
In order to make sure that memory grants were managed correctly, thresholds were defined for the variance between the memory grant and the actual memory usage. If the memory used was less than 1 MB, no additional analysis was required. If the memory grant was twice the amount of memory used, then the memory grant for the specific query could be recalculated. Similarly, the memory grant could be recalculated if the memory needed to execute the query was more than the memory grant.
Batch Mode on Rowstore
Having memory grants for batch mode operations was a necessary foundation for the next stage in the development of batch mode operations. Batch mode operations are where SQL Server can perform an action to group of records all at once instead of one record at a time. When batch mode was originally introduced in SQL Server 2012, it was only available for columnstore indexes. Starting with SQL Server 2019, batch mode operations were also allowed to be used for a collection of rows. In this case, a collection of rows is also called a rowstore. Memory grants for batch mode operations allowing batch mode operations for heaps and indexes are the foundation for an additional type of query optimization.
Adaptive Joins
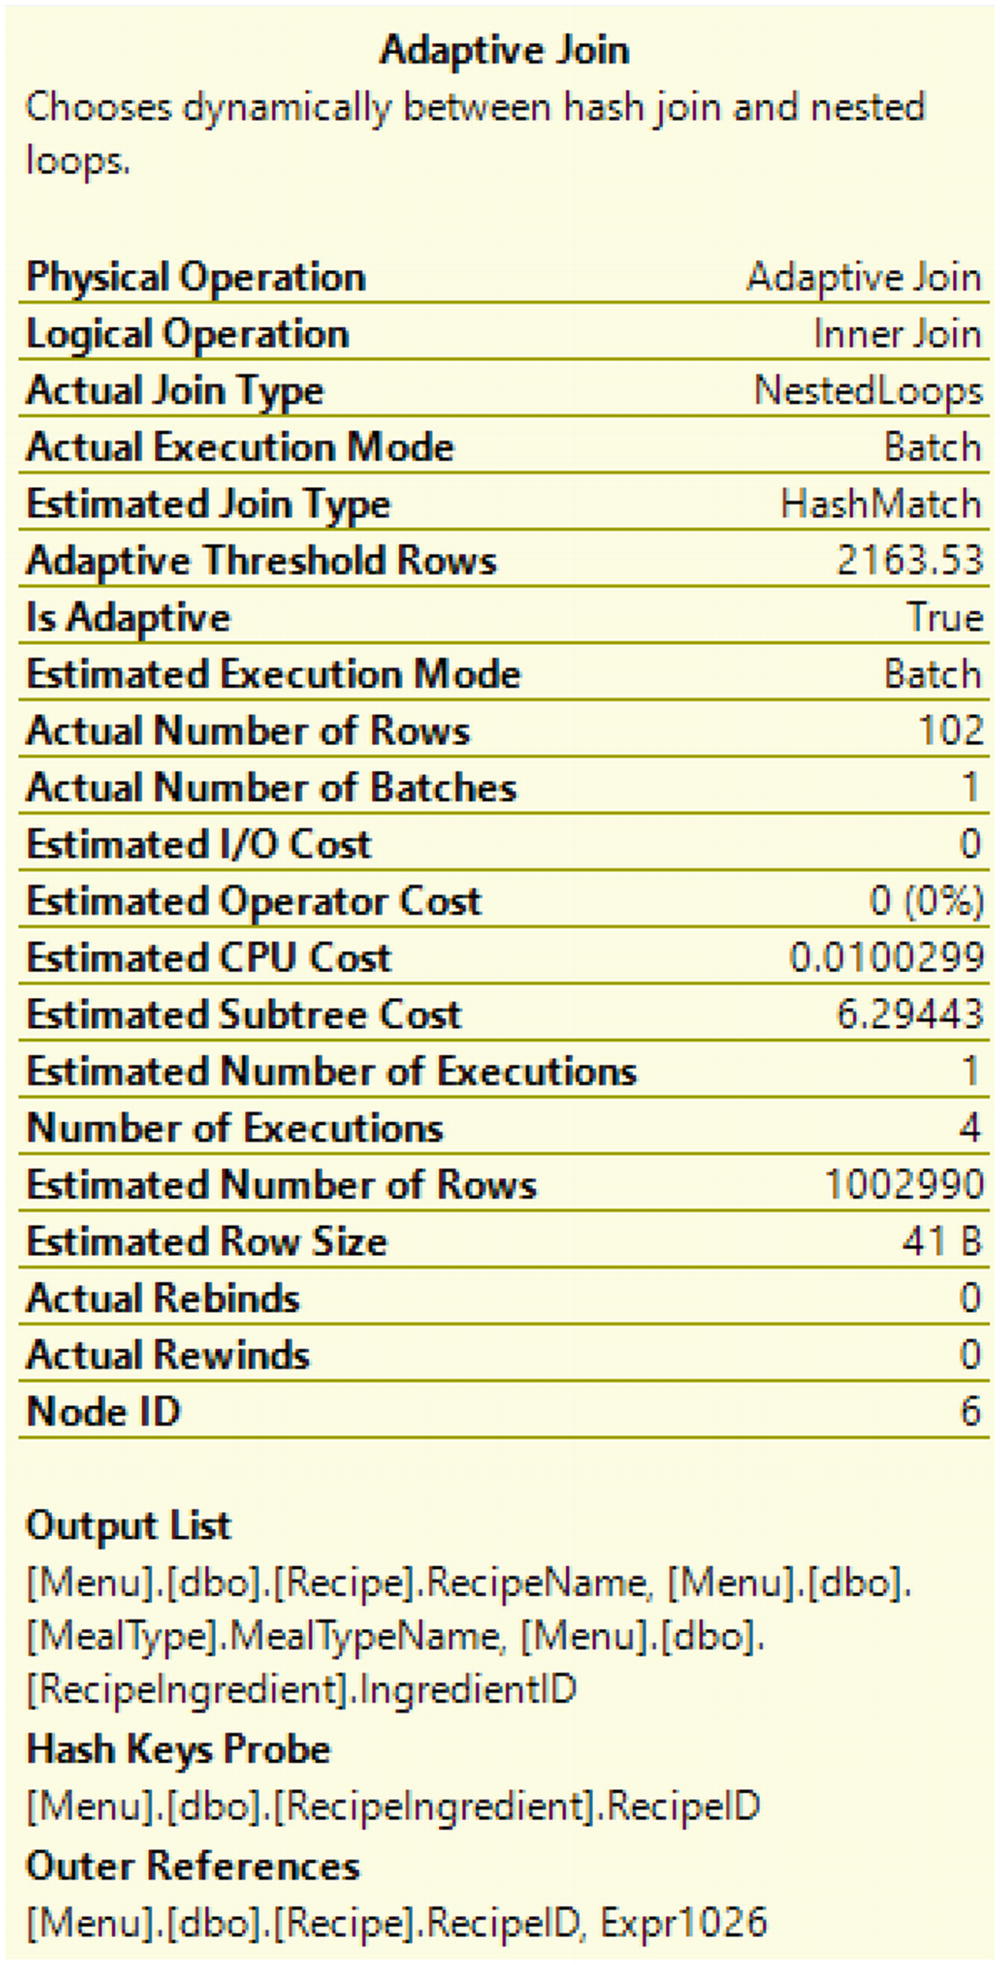
SQL Server uses statistics to help estimate the best plan. However, data is not always evenly distributed in a table. This can cause SQL Server to select an execution plan that may not be the best choice. The chance of this happening has decreased in SQL Server 2019 due to new functionality that allows SQL Server to choose between the physical join operator of a Nested Loop and a Hash Match depending on the current execution of the query. This new functionality is called an Adaptive Join.
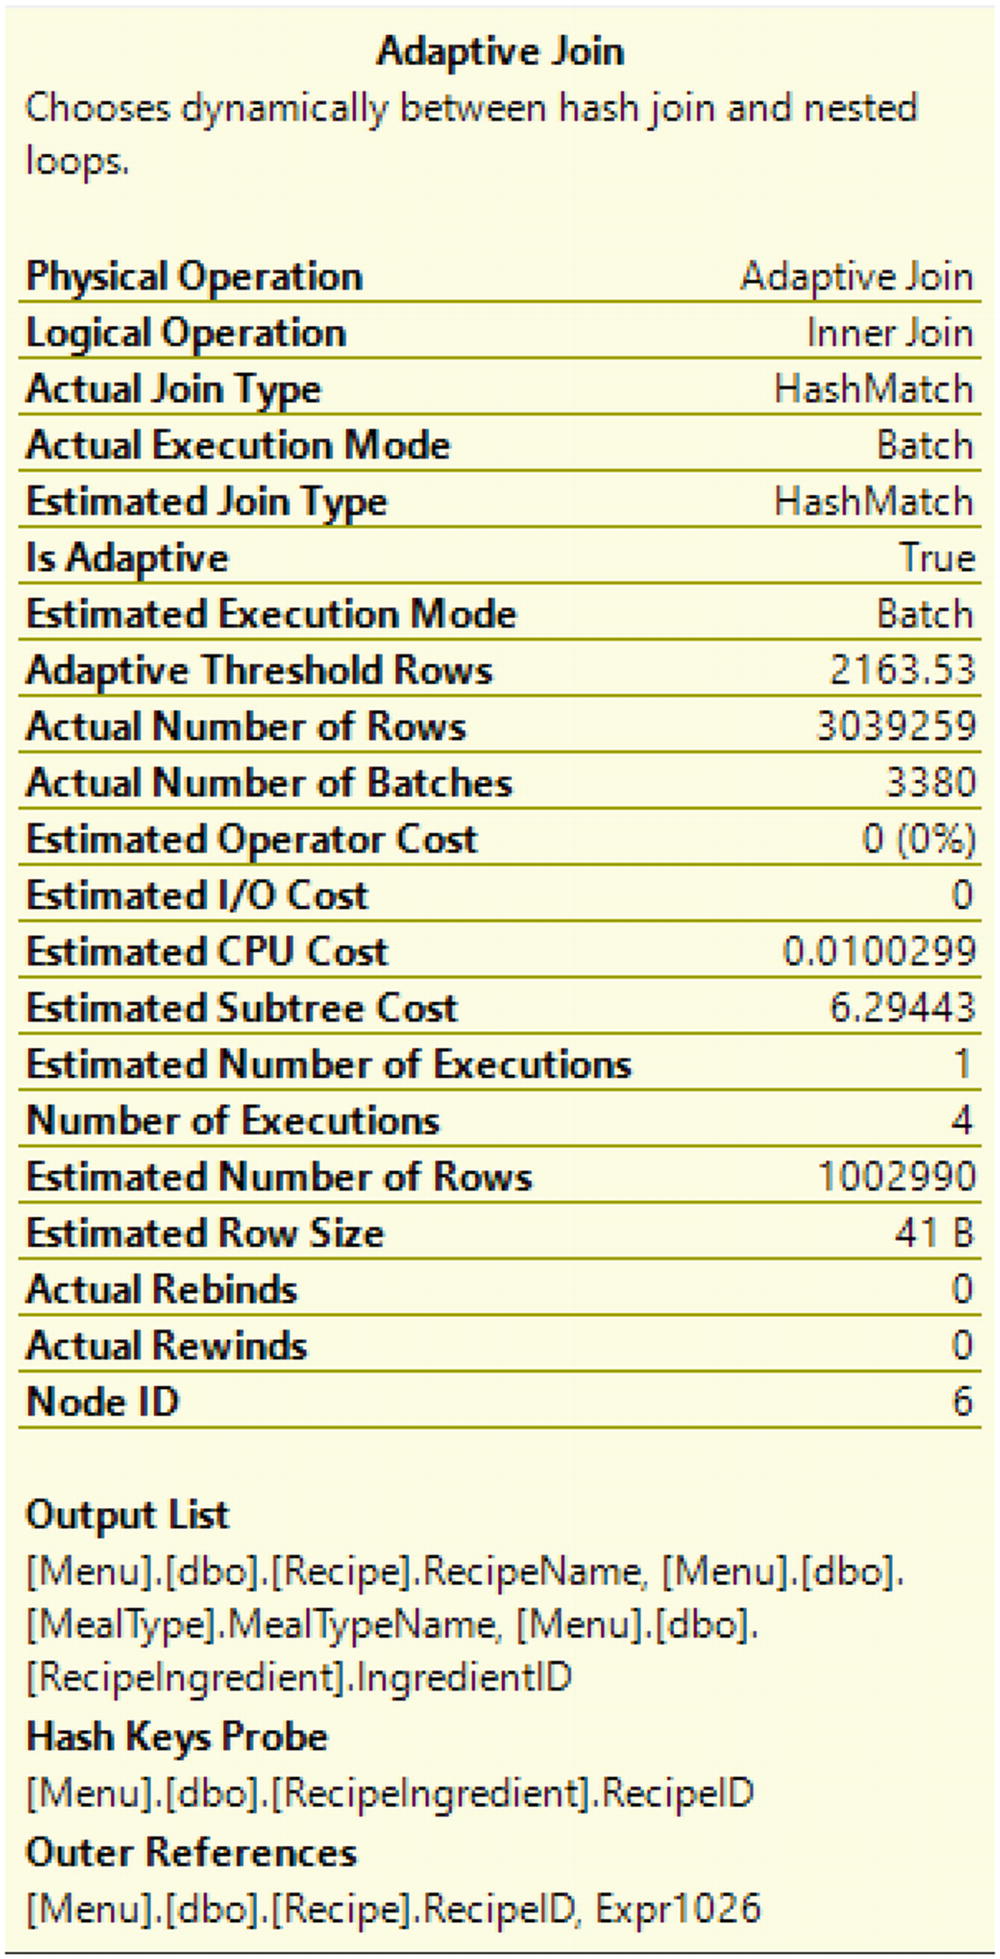
Adaptive Join Properties from Listing 8-5
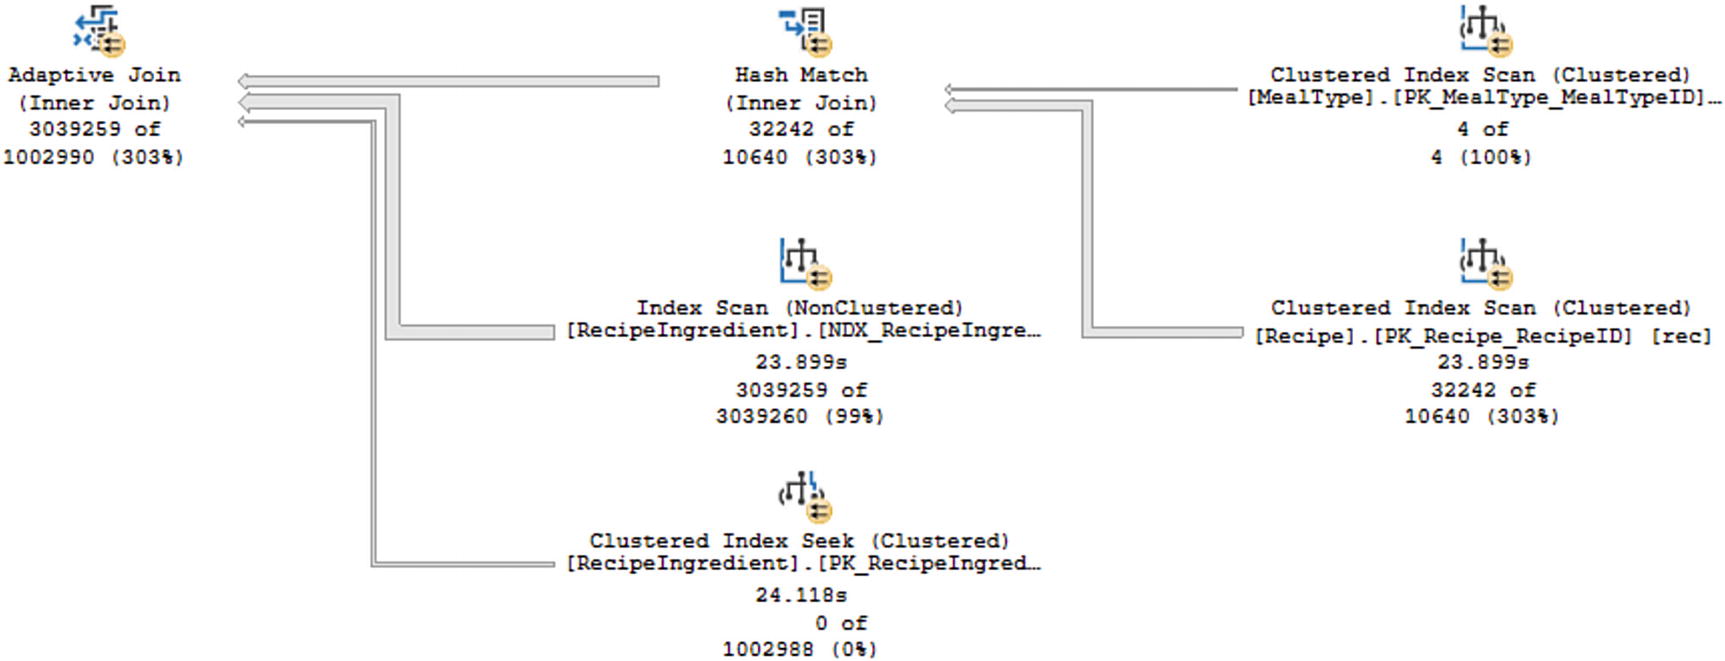
Live Query Statistics from Listing 8-5
You can see the total number of records processed by each step as the time spent on some of the steps. Looking at the live query statistics, you can see the percent of records returned vs. the estimate. In this case, some records like Clustered Index Scan on the table MealType or the Index Scan on the table RecipeIngredient were estimated correctly. While other operations like the Clustered Index Scan, Hash Match, and Adaptive Join were underestimated. While these variances may cause performance issues, the reason I am pointing these values out is to compare them to the query execution after I change the value passed to the @RecipeID variable.
Query for Recipe Information for a Specific Recipe
Adaptive Join Properties from Listing 8-8
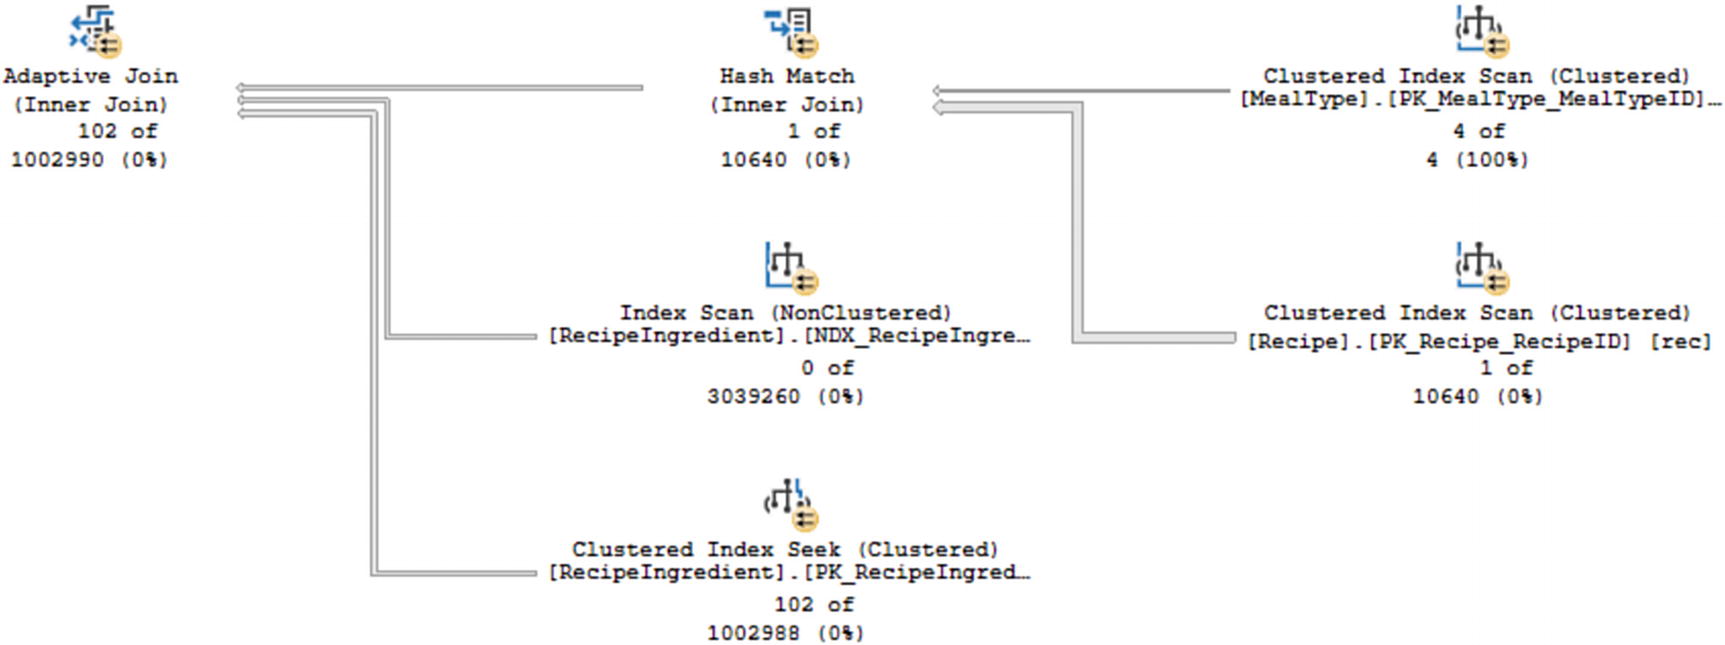
Live Query Statistics from Listing 8-8
In Figure 8-8, the same physical operators are present as in Figure 8-6. However, the actual number of rows processed vs. the estimated number of rows is significantly different. In the case of Figure 8-8, almost all the steps are severely overestimated. However, the query from Listing 8-8 will still benefit the performance due to the use of the Adaptive Join.
There are many ways that you can work toward optimizing for T-SQL code. Unless you are testing a new query, often the first step is to identify what T-SQL code needs to be optimized. After determining what query needs optimization, you may want to analyze execution plans to help determine if there is a step that stands out as needing optimization. You may also want to analyze information associated with the query such as average logical reads or average execution time. Combining this information together may help you identify what can be tuned to improve performance.
In addition, there are features in SQL Server that can help automatically make your T-SQL code perform better. This includes allowing SQL Server to analyze your new execution plans and confirm that they are performing better than the previous execution plan. If the previous execution plan is expected to perform better, SQL Server can make sure that plan is automatically selected. If you are using Azure SQL Database, you also have a similar option available when it comes to managing indexes. The use of Adaptive Joins allows SQL Server to make your execution plans more flexible. When an Adaptive Join is part of an execution plan, SQL Server can decide the correct physical operator to use depending on the values passed for that specific query execution. Whether you are manually optimizing your T-SQL code or letting SQL Server determine how to improve query execution, you have several tools available that should make your T-SQL code perform better.