
I have covered the elements of set-based design when considering how to design your queries. There are other things to take into consideration when working with SQL Server. You are working with a system that involves more than its pieces. There are many aspects to SQL Server. There is the data that is stored. There is accessing the data. There is also the process of how to access the data. SQL Server is not only software, but it’s also how that software interacts with your computer’s or server’s hardware.
When it comes to working with hardware, there are several different parts that SQL Server uses. Some of these may seem straightforward and others may be surprising at first. SQL Server is known as a relational database management system (RDBMS). As part of a relational database management system, SQL Server’s purpose is to allow for efficient storage and retrieval of data. This implies that one of the most important pieces of hardware is the memory on the system that is running SQL Server. When it comes to long-term storage of data, the hard drives become the most significant. We will refer to these as storage for the purposes of this chapter as storage is not only limited to hard disks. However, there are other elements that are less obvious such as CPU.
Considering Memory with T-SQL Design
When you first start working with data in SQL Server, it may come as a surprise that memory is one of the most important factors. Much of this has to do with what memory is used for within SQL Server. One of the reasons for this is because of the speed and versatility for memory. Another factor is related to the cost of memory vs. the cost of storage. This difference in costs increases the importance of using memory effectively. There are many different types of things that are stored in memory. The process SQL Server will use to access the data needed to meet a query’s criteria is saved in memory as an execution plan. The data retrieved for a query’s results are also stored in memory. You can also have database objects that exist in memory such as table variables or temporary tables.
First, let me consider why memory is so important when dealing with SQL Server. You often hear the term OLTP (online transaction processing) . What this really means is you want a system that can perform a high volume of write and update activity. These are the types of activities that happen frequently within our applications. When referring to write and update activity, using the database for recipes would involve each time a recipe was accessed, each change that was made to recipe, or every new ingredient that was added to the system.
While there is a significant amount of data being stored within the system, often someone only wants to deal with a very small subset of that data. The skill comes when trying to determine what data should remain readily available. This will increase the speed required to add new entries, to update existing entries, or to access pre-existing entries. This is where a better understanding of hardware can assist you.
We most commonly think of memory as the RAM available on our servers or in our machines. However, there are other types of memory available. Even closer to the CPU and faster than RAM are L2 cache and L3 cache. L2 and L3 cache exist on the processor and have a lower latency than RAM. This latency can be ten times less than RAM. However, the L2 cache or L3 cache available to SQL Server is significantly smaller the amount of data that is usually required for your applications to run effectively. The latency on the L2 cache can be half as much as the L3 cache, but the speed comes at the size of the cache. L2 cache is frequently measured in hundreds of kilobytes, and L3 cache is usually in tens of megabytes. How can we access data as quickly as possible and as cheaply as possible? This is where proper use of memory excels.
SQL Server is designed to take advantage of memory. There is a process called caching that keeps information in memory. There are two types of caching that are important when it comes to SQL Server. The first of these has to do with caching execution plans. This is where SQL Server saves directions on how it would execute a stored procedure or ad hoc query again in the future. The goal is to take advantage of the knowledge SQL Server already has calculated when it comes to the best way to execute a specific query. The second form of cache that has to do with query design can almost be more important. It has to do with how information is stored in memory. This is called the buffer pool.
While both the execution plan and the data can be saved in cache, there are certain calculations performed by SQL Server to determine how much should be allocated in memory to either the plan cache or the buffer pool. In addition, there are complex calculations that are used to determine how long to keep something in the plan cache or the buffer pool. The real goal is to make certain that stored procedures or queries that are not frequently accessed are dropped from the plan cache, so they do not take up unnecessary space. In the same way, when it comes to the buffer pool, the goal is to only keep data in the buffer pool that is being actively used and to clear out data that is no longer needed by the application. In both scenarios, items are not cleared from cache until the cache is full and space is needed for new execution plans or data. Another solution is available in SQL Server 2014 with the introduction of buffer pool extensions. The buffer pool extension allows you to extend the buffer pool to use RAM and solid state drive (SSDs). Considering that SSDs can be more cost-effective than purchasing additional RAM, this can help with I/O bottlenecks.
When it comes to the plan cache, there are some specific considerations that need to be remembered. By default, SQL Server is optimized to deal with stored procedures and prepared statements. This optimization for stored procedures is also a factor when using the plan cache. In a perfect world, your plan cache would have a significant amount of stored procedures in the cache and very few ad hoc queries. However, this is not always the case for every business. Your company may use ORM or other technologies like LINQ to write ad hoc queries inside application code. While these are convenient for the developers to write, they put an additional cost on SQL Server. This can be especially true if those queries are not converted into prepared statements.
What can happen is the plan cache can get full of ad hoc queries. This can cause stored procedures that are more critically needed by the application to be dropped from the plan cache. If there are stored procedures that are dropped out of the plan cache by the application, then when the stored procedure is called the next time, SQL Server will need to recalculate its execution plan. This will require an additional cost on the system. There are various ways to handle situations where there are a high number of ad hoc queries in your plan cache. However, that is outside the scope of this book.
One of the other issues I have seen when interacting with SQL Server has to do with the buffer pool and the data that is being held in the buffer pool. I have heard more than once that when dealing with very large tables, you will always be stuck having to deal with accessing large quantities of data. This can be true that when the table design, the indexes, the queries, or any combination of the preceding is not optimized, then this exact scenario can happen. However, there are ways to prevent this.
Query to Get Recipe Ingredients
Logical Reads when Data Table Is Small
Number of Recipes | Number of Ingredients | Number of Recipe Ingredients | Records Returned | Logical Reads |
|---|---|---|---|---|
32,242 | 4 | 3 | 4 | 351 |
Logical Reads when Data Table Is Larger
Number of Recipes | Number of Ingredients | Number of Recipe Ingredients | Records Returned | Logical Reads |
|---|---|---|---|---|
32,242 | 263,010 | 3,040,002 | 196 | 7858 |
As you can see, a query that originally seemed to perform well may start experiencing performance issues as the application matures and acquires more data.
In these situations, the data that is frequently accessed by the application may be getting cleared out of the buffer pool. When there is a stored procedure that runs that must sift through a significant amount of data, you can usually see this when you look at the logical reads associated with the query. You may be working with a query that only returns five results; however, it must go through 2 million logical reads to return the results. This is a sign that you are potentially using more of your buffer pool than you intended.
This type of behavior can cause a significant amount of data in the buffer pool to be cleared out. There is value called page life expectancy in SQL Server that shows the amount of time on average that data pages stay in the buffer pool. I have come to use page life expectancy as an indicator that there are queries that may be reading far more data in SQL Server than are returned in the result set. This can cause those same queries to use more memory than the query needs. Often when I am working with queries that are working with the application, they normally do not involve more than ten records at a time. If the query is used for some form of reports, it is still usually not more than a couple thousand records at a time. Even if I am getting results where I am looking at 200,000 records at a time, I would still not want to be handling tens of millions of logical reads in order to get those results.
Query to Get Only Recipe and Ingredients
Logical Reads with Only Necessary Columns
Number of Recipes | Number of Ingredients | Number of Recipe Ingredients | Records Returned | Logical Reads |
|---|---|---|---|---|
32,242 | 263,010 | 3,040,002 | 196 | 6990 |
Comparing the results from Table 6-2 to Table 6-3, you can see that the logical reads has decreased . As a result, SQL Server should access less data pages in the buffer pool to perform this query. This should help other applications using this instance of SQL Server perform better.
While memory could be considered the most powerful and beneficial hardware available to SQL Server, there are monetary costs associated with memory. Memory can make up for T-SQL that has not been optimized. But there often comes a point where tables are significantly large and the queries are not fully optimized, at that time it is tempting to get more memory to solve the performance issues. In many cases, this ends up being a short-term solution to a long-term problem. On top of that, the cost associated with purchasing additional memory is not always an option for the business. One way to prevent this or resolve this issue is to look at the stored procedures and prepared statements in your system and look for queries that can be improved by reducing the logical reads associated with those queries.
Considering Storage with T-SQL Design
I have covered how to interact with the data that you plan on accessing frequently; you will also want to consider how the bulk of your data is stored. When it comes to working with storage, it is important to consider what activities cause you to have to access data on disk. These are the types of activities that we want to figure out how to minimize or improve. In some cases, when I see a significant amount of disk I/O, it may be a sign that there is some other part of T-SQL design that needs to be improved. This may be the symptom instead of the cause.
In the previous section, I talked about data being stored in the buffer pool. What happens if we need data that is not in the buffer pool? This can be where things within SQL Server get a little more complex. SQL Server only interacts with data that is inside the buffer pool. Therefore, if data is needed that is not in the buffer pool, the first step will be to determine what data has been used less frequently. Then remove this data from the buffer pool. These first steps already give us a hint into the memory usage. If there is something that fills up the buffer pool unnecessarily, we now know that critical data may be cleared out of the buffer pool to make room for this new data.
Once the data has been deemed to not be a priority, SQL Server can then go to disk and get the data that it needs. This data will then be stored in the buffer pool until a future point where it is deemed that this data is no longer needed. In terms of the speed of hardware, there is already a slowness introduced with this process. If the data did not exist in the buffer pool, there is also the time associated with determining what records need to be dropped from the buffer pool. Dropping those records from the buffer pool and going to disk incurs additional cost in terms of time to retrieve that data from disk.
If this data was only needed for a job that runs once every 4 to 6 hours, most of this data may be deemed irrelevant for every other process. This introduces a high churn of data that is being removed from the buffer pool. New data can be grabbed from disk and saved to the buffer pool. Then this new data may be removed from the buffer pool and be replaced with even newer data that has been retrieved from disk.
In addition to this overhead associated with dealing with significant amount of data, there are other activities that interact with the disk or storage. When new data is being written to the system, that data will get stored in the transaction log. Data will continue to be added to the transaction log until the transaction log is cleared. Flushing the log can occur when the transaction is committed and the information is written to disk. In cases where there is a significant amount of data that is being added, updated, or deleted from the system, this can incur a significant use of storage.
Knowing how this data is stored and how SQL Server can easily find that data through indexes and other data pages is stored on disk is important. When information is added to an index or an index needs to be updated, this information will also incur storage cost. This is not only in terms of the time needed to store the data but also the time involved to go to disk and make these additions or changes.
When working with T-SQL, you want to consider how your queries are affecting your data storage. This can mean multiple things as we have seen in the previous section. You will want to make sure that you are not accessing, inserting, updating, or deleting more data than you need at a given time. That is not the only factor that comes into play when writing T-SQL. There are some things you can do to monitor storage use associated with your queries. Most of these involve looking at the number of physical reads, read-ahead reads, or the I/O cost associated with the query.
If you have confirmed that you are dealing with the minimal amount of data that you want to interact with, there may be nothing you can do to decrease the storage cost associated with your T-SQL queries. In some cases, just like with memory finding large storage usage may point to other issues. These issues can include things like how the data is saved on disk; it can also include how the indexes are designed.
In some cases, you may find that frequent index updates are causing a significant amount of storage cost. This may be due to indexes constantly needing to reorganize based on how the index is designed. There are also cases involving page splits where you may see a significant storage cost associated with this activity. The way that your tables are ordered or your indexes are designed may cause a significant amount of page splits. You may see an increase in storage costs associated with this activity as well.
For additional information regarding how storage costs work, it may help to understand how the SQL Server storage engine operates. When dealing with T-SQL queries, there is one aspect that depends on the storage engine more frequently. This has to do with accessing data that is currently not in the buffer pool.
The storage engine has several different functions. These functions involve accessing data that is not in the buffer pool. Another function of the storage engine has to do with how data is handled when locks are required. The third function of the storage engine involves commands that are not related to running T-SQL that is used by applications.
The storage engine can experience performance bottlenecks when accessing data. These bottlenecks can in turn cause performance issues when it comes to accessing the data that is stored. One example is when queries are accessing rows in data tables or interacting with indexes. At other times, the storage engine may need to handle page allocations related to retrieving data for the buffer pool. If your company has decided to implement row versioning, there may also be a possibility that this could cause performance issues with storage. While this is outside the scope of this book, if you are using row versioning and you experience issues related to storage performance, you may want to do some additional research to confirm that row versioning is not the cause.
When accessing data rows or indexes, SQL Server will utilize the storage engine. The data being accessed may be stored in the buffer pool. It is up to the storage engine to keep track of where these rows live in the B-tree. The same process happens with regard to managing, adding, updating, or removing entries from indexes within SQL Server. This is collectively called row and index operations maintenance within the storage engine.
SQL Server uses indexes to organize data and allow data to be retrieved easily and quickly. When it comes to tables that are larger than a couple of data pages, SQL Server tries to use indexes to help traverse the various data pages and find the data it needs quickly. However, there can be scenarios where the necessary indexes do not exist. This causes SQL Server to have to read more data pages, sometimes all the data in a table, to determine which rows are needed in order to satisfy the query requirements.
When writing queries to access data, SQL Server keeps track of the data that needs to be accessed by referring to that data as reads. If the data is available in memory, the act of accessing that data is referred to as a logical read. There are also times that accessing data may require SQL Server to go to disk or storage to access the data pages. If the data is accessed from disk, the data is referred to as physical reads. If the pages are moved to the buffer pool, then that action is referred to as read-ahead read. In either case, SQL Server will need to go to disk to access the requested records. When you write a query and it needs to retrieve records that do not exist in the buffer pool, SQL Server will need to access those records on disk. This can be a very normal process for SQL Server. However, in cases where the query requires more records to be read than are needed for the query results, this can cause more activity on disk than is required. One way to monitor the amount of time spent retrieving data from disk is with latch waits. This is the amount of time that SQL Server spends accessing data that does not exist in the buffer pool.
In addition to SQL Server managing data access within the storage engine, the storage engine also manages activities relating to locking data. This type of activity can be affected by the concurrency method configured on the server, application, or transaction. In many cases, the concurrency level configuration is usually managed by a different team than the people that are responsible for writing the T-SQL code. The storage engine is also responsible for handling how locks are handled in SQL Server.
Additional factors that can contribute to performance issues related to storage have to do with other areas of query design that may interact with the hard drive, for instance, database actions that require a large amount of activity to get recorded to the transaction. This can include inserting, updating, or deleting a large quantity of data. SQL Server is designed to handle recording these changes to the transaction log promptly. However, these modifications will need to be recorded to disk as well. Depending on fragmentation or other processes utilizing the hard disk, this may cause additional performance issues.
Tempdb is another part of SQL Server that can have a noticeable amount of overhead related to storage. There may be queries that are causing quite a bit of activity to happen within tempdb. In many cases, the effects to the rest of the system can be mitigated by putting tempdb on a separate drive. In those causes, any storage overhead on tempdb should only affect other queries also relying on tempdb.
Writing T-SQL queries is fundamentally linked to how SQL Server interacts with data that has been stored. There are some aspects of this interaction that can be controlled like making sure that you are accessing the least amount of data as possible. There are other factors such as how SQL Server accesses data or manages locking that may be outside of your control. Either way, it is important to be aware of how all these pieces come together and may affect your query performance.
Considering CPU with T-SQL Design
SQL Server does not only work with memory and with storage but also interacts with the server CPU. This is one of the final pieces to consider when designing your queries. When it comes to licensing SQL Server, the CPU can be a significant cost. Some of this may be due to not understanding the best CPU needed for SQL Server. This can cause servers to be purchased with a CPU that seems like it would be more beneficial than other CPUs out there. However, more cores on the CPU may not mean better performance. It may operate slower for SQL Server but have more cores. Therefore, some CPUs may be more expensive than other CPUs on the market, but they may also be less effective than other CPUs when those CPUs are used by SQL Server. There are several different places that CPUs can be used with SQL Server. There is the matter of performing calculations as part of your T-SQL code.
As we saw previously in the chapter, there are times where a significant use of memory can cause I/O issues. The same can be said when there is a significant amount of I/O activity; this can lead to CPU issues. When talking about considering memory in your overall T-SQL design, I discussed there were two types of caching. In that section, I mainly focused on buffer caching or the buffer pool. In this section, I will talk a little bit about how caching of execution plans can contribute to CPU performance issues.
When SQL Server determines how to execute a query, it creates an execution plan. For SQL Server to know how to execute a query, it must utilize the CPU. This is considered a CPU cost. The expectation is that this type of cost should not cause performance issues as frequently executed prepared statements and stored procedures will already have their plans saved in the cache and do not need to have these execution plans re-created with any amount of significant frequency.
That does lead into what causes SQL Server to determine that a new execution plan is needed. This is directly related to understanding what SQL Server does when it creates an execution plan. Part of creating an execution plan is creating a value that allows SQL Server to quickly find a previously created execution plan. In the plan cache, this value is known as the plan hash. While you may have several queries that look similar or return the same results, SQL Server may not give them the same plan hash. Only queries that look the same have the same plan hash.
This dependency on the plan hash helps determine if a new execution plan needs to be created. This causes us to become dependent on using parameters. These parameters can exist either in stored procedures or prepared statements. If the query that is being executed has the same plan hash and the plan hash in the plan cache, SQL Server will not re-create a new execution plan. This process of creating an execution plan is called compilation. This can be one of the many reasons that your queries may be using more CPU resources than you expected.
It is also possible that SQL Server may determine it needs to create a new execution plan for a query where there is already an associated plan hash in the execution cache. This scenario is generally caused when SQL Server identifies that the data involved in the query has changed significantly enough to require a new execution plan. This can be the result of frequent data changes, or it can be the result of parameter sniffing; either way, it will lead to something that SQL Server identifies as a recompilation. Just like there was a cost associated with a query compilation, there is also a cost on the CPU associated with recompilations.
If there is a significant amount of I/O being handled for a query, this may spill over into causing CPU performance issues. While it is possible that a query may be accessing more data than is necessary, it may not be due to the overall T-SQL query design. It is possible that it could be due to out-of-date statistics. While the concept of managing statistics is outside the scope of this book, you want to be aware of the effect that statistics have on your execution plans. Statistics are what give SQL Server a quick glance at the overall distribution of data within a specific data table or index. The concept is that proper statistics help SQL Server make a best guess as to how to create an execution plan. If these values are out of date or stale, then SQL Server may decide on an execution plan that would not be as efficient as it could be if SQL Server had up-to-date statistics. Due to the out-of-date statistics, you can see that there is a significant difference between the estimated and actual number of reads. This can cause a performance impact on the CPU. You can see now that the statistics have been updated and the estimated and actual number of rows returned remains relatively consistent.
There is also the possibility that SQL Server is having to traverse more of the hard disk or storage than it originally anticipated. This can be due to situations involving fragmentation. In the case of higher than normal CPU activity, it could be possible that this is due to index fragmentation. This means that SQL Server may have only estimated a certain amount of work required to retrieve data by assuming that the index was not fragmented. However, since the index is fragmented, SQL Server is having to do potentially more work than it anticipated to access the requested data.
Query with Implicit Conversion
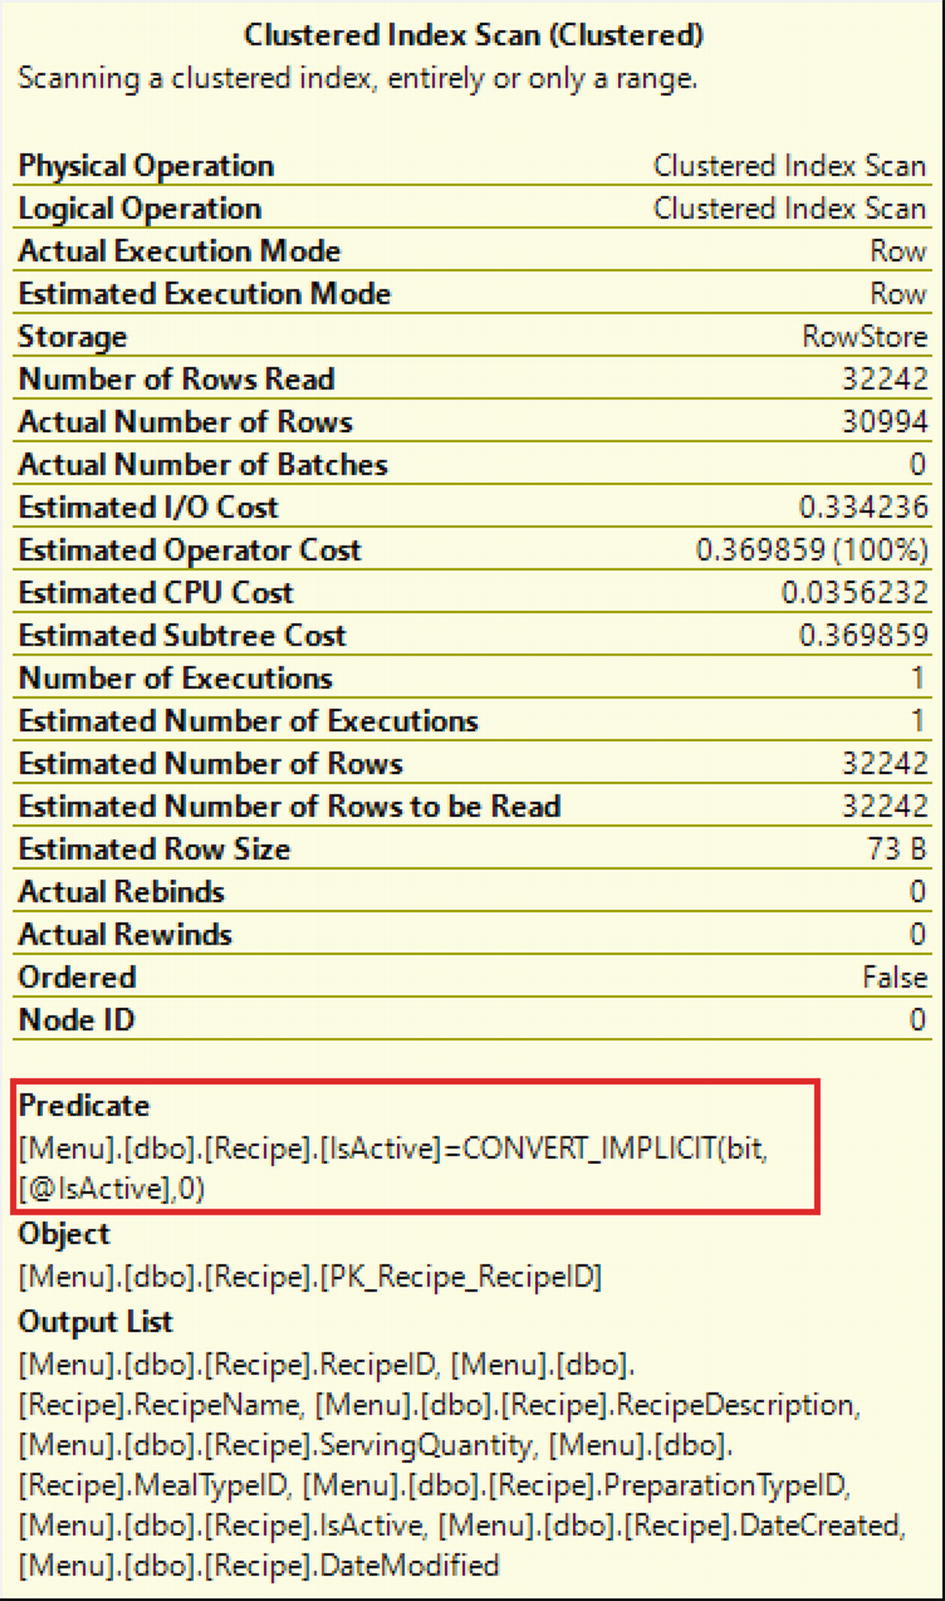
Index Scan in Execution Plan Showing Implicit Conversion
An implicit conversion can have a significant and negative overall performance impact on the query; you will want to make sure you avoid implicit conversions when writing your T-SQL queries.
Some companies may also be utilizing data compression. One of the benefits of data compression is the ability to keep more data in memory as the amount of data that is taken up by the compressed data is smaller than the uncompressed data. There are also some drawbacks to using data compression in SQL Server. One of these drawbacks has to do with the CPU cost incurred as part of the overall data compression process. This does not mean that you should not use data compression. I only mention this so that you can be aware of any potential issues should they arise.
That brings us to the overall concept of parallelism. The most common way that you can easily see CPU usage is when it comes to parallelism with your queries. Parallelism is a concept where instead of a query executing on a single thread, a query can execute on more than one thread. In this scenario, this can mean that your CPU may have four cores. Each core may have two threads. If a query were only to run on one thread, it would run on one quarter of a core of your CPU. However, if the query was running in parallelism, it may be able to run on more than one thread. For instance, if it ran on four threads, this query could then take the full number of cores in your CPU. This would cause the overall CPU process to increase.
There are many factors involved for SQL Server to determine whether parallelism should be used when executing a query. Much of this involves how SQL Server is configured. While configuring SQL Server is outside the scope of this book, I want you to be aware of how it works when SQL Server creates an execution plan. SQL Server gives the execution plan and overall cost. SQL Server also has a configured value that indicates a minimum cost that should exist before SQL Server decides to implement parallelism. This cost is referred to as the cost threshold for parallelism. If the execution plan has a cost that is greater than the cost threshold of parallelism, then SQL Server can determine if there is a better execution plan that runs in parallel.
If SQL Server does decide to create an execution plan using parallelism, SQL Server will also need to determine the maximum number of threads that are allowed for a given execution plan. There is also a configured value that indicates the maximum number of threads that can be used for parallelism. This value is referred to as the maximum degrees of parallelism. MAXDOP is the abbreviation for maximum degrees of parallelism. This does not mean that SQL Server must use the same number of threads as specified in the maximum degrees of parallelism. It only means this is the maximum amount of threads that can be allowed for an execution plan to run in parallelism.
SQL Server will determine the number of threads to use for an execution plan that will run in parallelism at the time of execution. This will be done based on the number of threads that are not utilized at the beginning of the execution of the query. One factor that can affect CPU performance when it comes to parallelism can occur if more threads come into use while the query is running in parallelism. The general idea for parallelism is that more CPU process will be used overall but for a much shorter duration. If there are more queries that come into the queue and need to be run requiring more threads to be active, it may cause the CPU to operate at a higher than normal level for a longer period.
One of the main reasons you will want to make sure your T-SQL is not negatively impacting CPU usage has to do with the monetary cost related to CPUs. Since SQL Server 2012, the licensing for SQL Server has been related to the number of cores using SQL Server. In later versions of SQL Server, that has been modified to be the number of cores available to the server even if they are not explicitly allocated to SQL Server. One of the common solutions when companies start experiencing performance issues is to add more hardware. While this may solve performance issues in the short term, it can also be a very expensive solution depending on what hardware needs to be added. As the license per core can be over $1000, it is ideal to try and minimize the need for additional CPUs by reducing performance bottlenecks related to CPU usage.
There are many aspects to consider when designing your T-SQL queries. Some of these factors include being aware of the impact T-SQL can have on the physical hardware that runs SQL Server. When writing your T-SQL queries, you will want to be mindful of the amount of data being accessed in order to make the best use of the memory available. Another added benefit to minimizing the data that is decreasing storage resources. Making sure that your statistics are up to date and that proper indexes are in place will benefit the CPU usage. Being aware of how your queries are affecting your hardware will not only minimize the need for additional hardware but also allows your current hardware to better support your applications.