
Chapter 9. Containers and Kubernetes
Container deployments are becoming more common with technologies such as Docker and Kubernetes—you may even already be using them. In this chapter I will cover exporters that you can use with containers, and explain how to use Prometheus with Kubernetes.
All Prometheus components run happily in containers, with the sole exception of the Node exporter as noted in Chapter 7.
cAdvisor
In the same way the Node exporter provides metrics about the machine, cAdvisor is an exporter that provides metrics about cgroups. Cgroups are a Linux kernel isolation feature that are usually used to implement containers on Linux, and are also used by runtime environments such as systemd.
You can run cAdvisor with Docker:
docker run
  --volume=/:/rootfs:ro
  --volume=/var/run:/var/run:rw
  --volume=/sys:/sys:ro
  --volume=/var/lib/docker/:/var/lib/docker:ro
  --volume=/dev/disk/:/dev/disk:ro
  --publish=8080:8080
  --detach=true
  --name=cadvisor
  google/cadvisor:v0.28.3
Caution
Due to issues with incorrect usage of the Prometheus Go client library, you should avoid versions of cAdvisor before 0.28.3.
If you visit http://localhost:8080/metrics you will see a long list of metrics, as Figure 9-1 shows.
The container metrics are prefixed with container_, and
you will notice that they all have an id label. The id labels starting with
/docker/ are from Docker and its containers, and if you have /user.slice/ and /system.slice/, they come from systemd running on your
machine. If you have other software using cgroups, its cgroups will also be
listed.
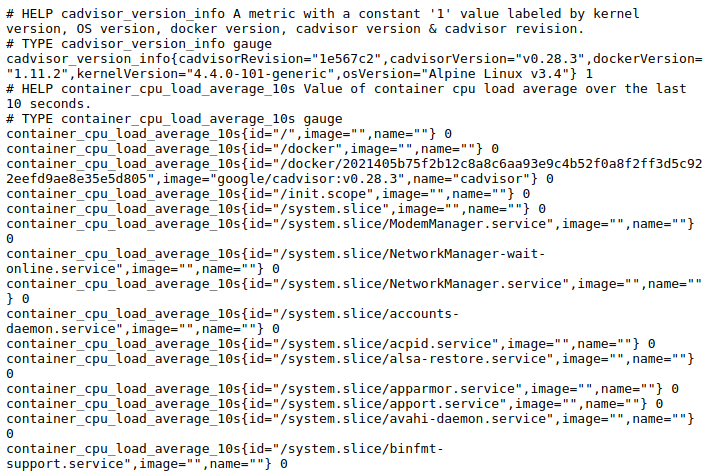
Figure 9-1. The start of a /metrics page from cAdvisor
These metrics can be scraped with a prometheus.yml such as:
scrape_configs:-job_name:cadvisorstatic_configs:-targets:-localhost:8080
CPU
You will find three metrics for container CPU:
container_cpu_usage_seconds_total, container_cpu_system_seconds_total, and
container_cpu_user_seconds_total.
container_cpu_usage_seconds_total is split out by CPU, but not by mode.
container_cpu_system_seconds_total and container_cpu_user_seconds_total are
the user and system modes, respectively, similar to the Node exporter’s
“CPU Collector”. These are all counters with which you can use the rate function.
Caution
With many containers and CPUs in one machine, you may find that the aggregate
cardinality of metrics from cAdvisor becomes a performance issue. You can use a
drop relabel action as discussed in “metric_relabel_configs” to drop less-valuable metrics at scrape time.
Memory
Similar to in the Node exporter, the memory usage metrics are less than perfectly clear and require digging through code and documentation to understand them.
container_memory_cache is the page cache used by the container, in bytes.
container_memory_rss is the resident set size (RSS), in bytes. This is not
the same RSS or physical memory used as a process would have, as it excludes
the sizes of mapped files.1
container_memory_usage_bytes is the RSS and the page cache, and is what is limited by container_spec_memory_limit_bytes if the limit is nonzero.
container_memory_working_set_bytes is calculated by subtracting the inactive
file-backed memory (total_inactive_file from the kernel) from
container_memory_usage_bytes.
In practice, container_memory_working_set_bytes is the closest to RSS that is
exposed, and you may also wish to keep an eye on container_memory_usage_bytes
as it includes page cache.
In general, I would recommend relying on metrics such as
process_resident_memory_bytes from the process itself rather than metrics
from the cgroups. If your applications do not expose Prometheus metrics, then
cAdvisor is a good stopgap, and cAdvisor metrics are still important for
debugging and profiling.
Labels
Cgroups are organised in a hierarchy, with the / cgroup at the root of the hierarchy. The metrics for each of your cgroups include the usage of the cgroups below it. This goes against the usual rule that within a metric the sum or average is meaningful, and is thus an example of the “Table Exception”.
In addition to the id label, cAdvisor adds in more labels about
containers if it has them. For Docker containers there will always be the
image and name labels, for the specific Docker image being run and Docker’s
name for the container.
Any metadata labels Docker has for a container will also be included with a
container_label_ prefix. Arbitrary labels like these from a scrape can break
your monitoring, so you may wish to remove them with a labeldrop as shown in
Example 9-1, and as I talked about in
“labeldrop and labelkeep”.2
Example 9-1. Using labeldrop to drop container_label_ labels from cAdvisor
scrape_configs:-job_name:cadvisorstatic_configs:-targets:-localhost:9090metric_relabel_configs:-regex:'container_label_.*'action:labeldrop
Kubernetes
Kubernetes is a popular platform for orchestrating containers. Like Prometheus, the Kubernetes project is part of the Cloud Native Computing Foundation (CNCF). Here I am going to cover running Prometheus on Kubernetes and working with its service discovery.
As Kubernetes is a large and fast-moving target, I am not going to cover it in exhaustive detail. If you would like more depth, I would suggest the book Kubernetes: Up and Running by Joe Beda, Brendan Burns, and Kelsey Hightower (O’Reilly).
Running in Kubernetes
To demonstrate using Prometheus with Kubernetes, I will use Minikube, a tool used to run a single-node Kubernetes cluster inside a virtual machine.
Follow the steps in Example 9-2. I’m using a Linux amd64 machine with VirtualBox already installed. If you are running in a different environment, follow the Minikube installation documentation. Here I am using Minikube 0.24.1 and Kubernetes 1.8.0.
Example 9-2. Downloading and running Minikube
hostname $ wget
    https://storage.googleapis.com/minikube/releases/v0.24.1/minikube-linux-amd64
hostname $ mv minikube-linux-amd64 minikube
hostname $ chmod +x minikube
hostname $ ./minikube start
Starting local Kubernetes v1.8.0 cluster...
Starting VM...
Getting VM IP address...
Moving files into cluster...
Setting up certs...
Connecting to cluster...
Setting up kubeconfig...
Starting cluster components...
Kubectl is now configured to use the cluster.
Loading cached images from config file.
Tip
minikube dashboard --url will provide you with a URL for the Kubernetes Dashboard,
from which you can inspect your Kubernetes cluster.
You will also need to install kubectl, which is a command-line tool used to
interact with Kubernetes clusters. Example 9-3 shows how to install it and
confirm that it can talk to your Kubernetes cluster.
Example 9-3. Downloading and tesing kubectl
hostname $ wget
    https://storage.googleapis.com/kubernetes-release/release/v1.9.2/bin/linux/amd64
    /kubectl
hostname $ chmod +x kubectl
hostname $ ./kubectl get services
NAME         TYPE        CLUSTER-IP   EXTERNAL-IP   PORT(S)   AGE
kubernetes   ClusterIP   10.96.0.1    <none>        443/TCP   44s
Example 9-4 shows how to get an example Prometheus running on
Minikube. prometheus-deployment.yml contains permissions so that your Prometheus can access
resources such as pods and nodes in the cluster, a configMap is created to hold
the Prometheus configuration file, a deployment to run Prometheus, and a
service to make it easier for you to access the Prometheus UI. The final
command, the ./minikube service, will provide you with a URL where you can access the Prometheus UI.
Example 9-4. Setting up permissions and running Prometheus on Kubernetes
hostname $./kubectl apply -f prometheus-deployment.yml
hostname $./minikube service prometheus --url
http://192.168.99.100:30114
The target status page should look like Figure 9-2. You can find prometheus-deployment.yml on GitHub.

Figure 9-2. Targets of the example Prometheus running on Kubernetes
This is a basic Kubernetes setup to demonstrate the core ideas behind monitoring on Kubernetes, and it is not intended for you to use directly in production; for example, all data is lost every time Prometheus restarts.
Service Discovery
There are currently five different types of Kubernetes service discoveries you can use with Prometheus, namely node, endpoints, service, pod, and ingress. Prometheus uses the Kubernetes API to discover targets.
Node
Node service discovery is used to discover the nodes comprising the Kubernetes cluster, and you will use it to monitor the infrastructure around Kubernetes. The Kubelet is the name of the agent that runs on each node, and you should scrape it as part of monitoring the health of the Kubernetes cluster (Example 9-5).
Example 9-5. prometheus.yml fragment to scrape the Kubelet
scrape_configs:-job_name:'kubelet'kubernetes_sd_configs:-role:nodescheme:httpstls_config:ca_file:/var/run/secrets/kubernetes.io/serviceaccount/ca.crtinsecure_skip_verify:true
Example 9-5 shows the configuration being used by Prometheus to scrape the Kubelet. I’m going to break down the scrape config:
job_name: 'kubelet'
A default job label is provided, and as there are no relabel_configs,
kubelet will be the job label:3
kubernetes_sd_configs:
- role: node
A single Kubernetes service discovery is provided with the node role. The node role discovers one target for each of your Kubelets. As Prometheus is
running inside the cluster, the defaults for the Kubernetes service discovery
are already set up to authenticate with the Kubernetes API.
scheme: https
tls_config:
  ca_file: /var/run/secrets/kubernetes.io/serviceaccount/ca.crt
  insecure_skip_verify: true
The Kubelet serves its /metrics over HTTPS, so we must specify the scheme.
Kubernetes clusters usually have their own certificate authority that are used to sign
their TLS certs, and the ca_file provides that for the scrape. Unfortunately
Minikube doesn’t get this quite right, so insecure_skip_verify is required to
bypass security checks.
The returned target points at the Kubelet, and authentication/authorisation is turned off in this Minikube setup, so no further configuration is needed.
Tip
The tls_config in the scrape config contains TLS settings for the scrape.
kubernetes_sd_configs also has a tls_config that contains TLS settings
for when service discovery talks to the Kubernetes API.
The metadata available includes node annotations and labels, as you can see in
Figure 9-3. You could use this metadata with relabel_configs to add
labels to distinguish interesting subsets of nodes, such as those with different
hardware.
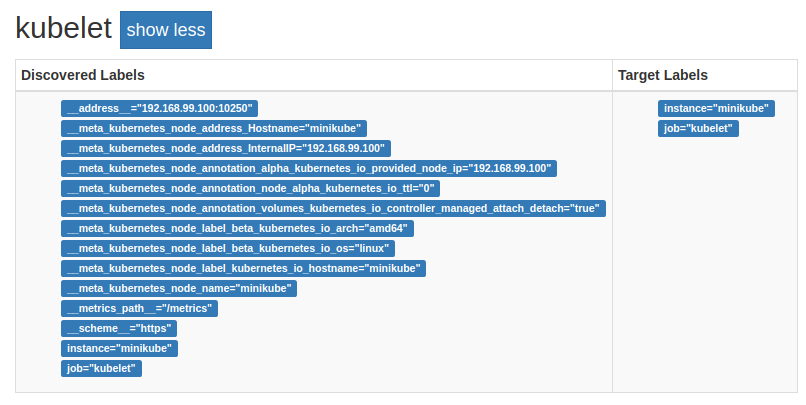
Figure 9-3. The Kubelet on the service discovery status page of Prometheus
The Kubelet’s own /metrics only contain metrics about the Kubelet itself, not container-level information. The Kubelet has an embedded cAdvisor on its
/metrics/cadvisor endpoint. Scraping the embedded cAdvisor only requires
adding a metrics_path to the scrape config used with the Kubelet, as shown in
Example 9-6. The embedded cAdvisor includes labels for
the Kubernetes namespace and pod_name.
Example 9-6. prometheus.yml fragment to scrape the Kubelet’s embedded cAdvisor
scrape_configs:-job_name:'cadvisor'kubernetes_sd_configs:-role:nodescheme:httpstls_config:ca_file:/var/run/secrets/kubernetes.io/serviceaccount/ca.crtinsecure_skip_verify:truemetrics_path:/metrics/cadvisor
Node service discovery can be used for anything you want to monitor that runs on each machine in a Kubernetes cluster. If the Node exporter was running on your Minikube node you could scrape it by relabelling the port, for example.
Service
Node service discovery is useful for monitoring the infrastructure of and under Kubernetes, but not much use for monitoring your applications running on Kubernetes.
There are several ways that you can organise your applications on Kubernetes, and no single clear standard has emerged yet. But you are likely using services, which is how applications on Kubernetes find each other.
While there is a service role, it is not what you usually want. The service
role returns a single target for each port4 of your services. Services are basically load balancers, and scraping
targets through load balancers is not wise as Prometheus can scrape a different
application instance each time. However, the service role can be useful for
blackbox monitoring, to check if the service is responding at all.
Endpoints
Prometheus should be configured to have a target for each application instance,
and the endpoints role provides just that. Services are backed by pods.
Pods are a group of tightly coupled containers that share network and storage.
For each Kubernetes service port, the endpoints service discovery role returns
a target for each pod backing that service. Additionally, any other ports
of the pods will be returned as targets.
That’s a bit of a mouthful, so let’s look at an example. One of the services
that is running in your Minikube is the kubernetes service, which are the
Kubernetes API servers. Example 9-7 is a scrape config
that will discover and scrape the API servers.
Example 9-7. prometheus.yml fragment used to scrape the Kubernetes API servers
scrape_configs:-job_name:'k8apiserver'kubernetes_sd_configs:-role:endpointsscheme:httpstls_config:ca_file:/var/run/secrets/kubernetes.io/serviceaccount/ca.crtinsecure_skip_verify:truebearer_token_file:/var/run/secrets/kubernetes.io/serviceaccount/tokenrelabel_configs:-source_labels:-__meta_kubernetes_namespace-__meta_kubernetes_service_name-__meta_kubernetes_endpoint_port_nameaction:keepregex:default;kubernetes;https
Breaking down this scrape config:
job_name: 'k8apiserver'
The job label is going to be k8apiserver, as there’s no target relabelling to change it:
kubernetes_sd_configs:
- role: endpoints
There is a single Kubernetes service discovery using the endpoints role,
which will return a target for every port of every pod backing each of your
services:
scheme: https
tls_config:
  ca_file: /var/run/secrets/kubernetes.io/serviceaccount/ca.crt
  insecure_skip_verify: true
bearer_token_file: /var/run/secrets/kubernetes.io/serviceaccount/token
As with the Kubelet, the API servers are served over HTTPS. In addition,
authentication is required, which is provided by the bearer_token_file:
relabel_configs:
- source_labels:
    - __meta_kubernetes_namespace
    - __meta_kubernetes_service_name
    - __meta_kubernetes_endpoint_port_name
  action: keep
  regex: default;kubernetes;https
This relabel configuration will only return targets that are in the default namespace,
and are part of a service called kubernetes with a port called https.
You can see the resulting target in Figure 9-4. The API server is special, so there isn’t much metadata. All the other potential targets were dropped.
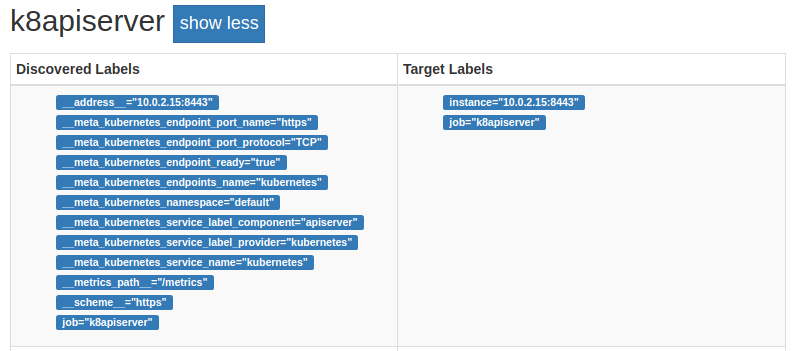
Figure 9-4. The API server on the service discovery status page of Prometheus
While you will want to scrape the API servers, most of the time you’ll be focused on your applications. Example 9-8 shows how you can automatically scrape the pods for all of your services.
Example 9-8. prometheus.yml fragment to scrape pods backing all Kubernetes services, except the API servers
scrape_configs:-job_name:'k8services'kubernetes_sd_configs:-role:endpointsrelabel_configs:-source_labels:-__meta_kubernetes_namespace-__meta_kubernetes_service_nameregex:default;kubernetesaction:drop-source_labels:-__meta_kubernetes_namespaceregex:defaultaction:keep-source_labels:[__meta_kubernetes_service_name]target_label:job
Once again I’ll break it down:
job_name: 'k8services'
kubernetes_sd_configs:
 - role: endpoints
As with the previous example, this is providing a job name and the Kubernetes endpoints role, but
this does not end up as the job label due to later relabelling.
There are no HTTPS settings, as I know the targets are all plain HTTP. There is
no bearer_token_file, as no authentication is required, and sending a bearer
token to all of your services could allow them to impersonate you:5
relabel_configs:
- source_labels:
    - __meta_kubernetes_namespace
    - __meta_kubernetes_service_name
  regex: default;kubernetes
  action: drop
- source_labels:
    - __meta_kubernetes_namespace
  regex: default
  action: keep
I excluded the API server, as there is already another scrape config handling
it. I also only looked at the default namespace, which is where I am launching
applications:6
- source_labels: [__meta_kubernetes_service_name]
  target_label: job
This relabel action takes the Kubernetes service name and uses it as the job
label. The job_name I provided for the scrape config is only a default, and
does not apply.
In this way you can have your Prometheus automatically pick up new services and
start scraping them with a useful job label. In this case that’s just
Prometheus itself, as shown in Figure 9-5.

Figure 9-5. Prometheus has automatically discovered itself using endpoint service discovery
You could go a step further and use relabelling to add additional labels from
service or pod metadata, or even set __scheme__ or
__metrics_path__ based on a Kubernetes annotation, as shown
in Example 9-9. These would look for
prometheus.io/scheme, prometheus.io/path, and prometheus.io/port service
annotations,7 and use them if present.
Example 9-9. Relabelling using Kubernetes service annotations to optionally configure the scheme, path, and port of targets
relabel_configs:-source_labels:[__meta_kubernetes_service_annotation_prometheus_io_scheme]regex:(.+)target_label:__scheme__-source_labels:[__meta_kubernetes_service_annotation_prometheus_io_path]regex:(.+)target_label:__metrics_path__-source_labels:-__address__-__meta_kubernetes_service_annotation_prometheus_io_portregex:([^:]+)(:d+)?;(d+)replacement:${1}:${3}target_label:__address__
This is limited to monitoring only one port per service. You could have another
scrape config using the prometheus.io/port2 annotation, and so on for however
many ports you need.
Pod
Discovering endpoints is great for monitoring the primary processes backing your services, but it won’t discover pods that are not part of services.
The pod role discovers pods. It will return a target for each port of
every one of your pods. As it works off pods, service metadata such as
labels and annotations are not available as pods do not know which services
they are members of. But you will have access to all pod metadata.
How you use this boils down to a question of what conventions you want to use. The
Kubernetes ecosystem is rapidly evolving, and there is no one standard yet.
You could create a convention that all pods must be part of a service, and then
use the endpoint role in service discovery. You could have a convention that
all pods have a label indicating the (single) Kubernetes service they are a part of, and use the pod role for service discovery. As all ports have names,
you could base a convention off that and have ports named with a prefix of
prom-http be scraped with HTTP, and prom-https be scraped with
HTTPS.
One of the components that comes with Minikube is kube-dns,
which provides DNS services. Its pod has multiple ports, including a port named
metrics that serves Prometheus metrics. Example 9-10 shows how you could discover this
port and use the name of the container as the job label, as
Figure 9-6 shows.
Example 9-10. prometheus.yml to discover all pod ports with the name metrics and to use the container name as the job label
scrape_configs:-job_name:'k8pods'kubernetes_sd_configs:-role:podrelabel_configs:-source_labels:[__meta_kubernetes_pod_container_port_name]regex:metricsaction:keep-source_labels:[__meta_kubernetes_pod_container_name]target_label:job

Figure 9-6. Two targets discovered using pod service discovery
Note
Another approach to managing what to monitor is the Prometheus Operator, which uses the custom resource definition feature of Kubernetes. The Operator also manages running Prometheus and the Alertmanager for you.
Ingress
An ingress is a way for a Kubernetes service to be exposed outside the
cluster. As it is a layer on top of services, similar to the service role the
ingress role is also basically a load balancer. If multiple pods backed
the service and thus ingress, this would cause you problems when scraping with
Prometheus. Accordingly, you should only use this role for blackbox monitoring.
kube-state-metrics
Using Kubernetes service discovery you can have Prometheus scrape your applications and Kubernetes infrastructure, but this will not include metrics about what Kubernetes knows about your services, pods, deployments, and other resources. This is because applications such as the Kubelet and Kubernetes API servers should expose information about their own performance, not dump their internal data structures.8
Instead, you would obtain such metrics from another endpoint,9 or if that doesn’t
exist, have an exporter that extracts the relevant information. For Kubernetes,
kube-state-metrics is that exporter.
To run kube-state-metrics you should follow the steps in Example 9-11 and then
visit the /metrics on the returned URL in your browser. You can find kube-state-metrics.yml on GitHub.
Example 9-11. Running kube-state-metrics
hostname $./kubectl apply -f kube-state-metrics.yml
hostname $./minikube service kube-state-metrics --url
http://192.168.99.100:31774
Some useful metrics include kube_deployment_spec_replicas for
the intended number of metrics in a deployment, kube_node_status_condition
for node problems, and kube_pod_container_status_restarts_total for pod
restarts.
Tip
This kube-state-metrics will be automatically scraped by Prometheus due to
the scrape config in Example 9-8.
kube-state-metrics features several examples of “Enum” and “Info” metrics,
such as kube_node_status_condition and kube_pod_info, respectively.
Now that you have an idea about how to use Prometheus in container environments, let’s look at some of the common exporters you will run into.
1 Mapped files include both mmap and any libraries used by a process. This is exposed by the kernel as file_mapped but is not used by cAdvisor, thus the standard RSS is not available from cAdvisor.
2 The behaviour of cAdvisor is the main reason the labeldrop and labelkeep relabel actions were added.
3 I don’t use node as the job label, as that’s typically used for the Node exporter.
4 A service can have multiple ports.
5 This is also the case with basic auth, but not for a challenge-response mechanism like TLS client certificate authentication.
6 And to not cause confusion with Example 9-10, as kube-dns is in the kube-system namespace.
7 Foward slashes are not valid in label names, so they are sanitised to underscores.
8 Put another way, a database exporter does not dump the contents of the database as metrics.
9 Such as the Kubelet exposing cAdvisor’s metrics on another endpoint.