
Chapter 19. Alertmanager
In Chapter 18 you saw how to define alerting rules in Prometheus, which result in alerts being sent to the Alertmanager. It is the responsibility of your Alertmanager to take in all the alerts from all of your Prometheus servers and convert them to notifications such as emails, chat messages, and pages. Chapter 2 gave you a brief introduction to using the Alertmanager, but in this chapter you will learn how to configure and use the full power of it.
Notification Pipeline
The Alertmanager does more for you than blindly convert alerts into notifications on a one-to-one basis. In an ideal world you would receive exactly one notification for each production incident. While this is a stretch, the Alertmanager tries to get you there by providing you with a controllable pipeline for how your alerts are processed as they become notifications. Just as labels are at the core of Prometheus itself, labels are also key to the Alertmanager:
- Inhibition
-
On occasion, even when using symptom-based alerting, you will want to prevent notifications for some alerts if another more severe alert is firing, such as preventing alerts for your service if a datacenter it is in is failing but is also receiving no traffic. This is the role of inhibition.
- Silencing
-
If you already know about a problem or are taking a service down for maintenance, there’s no point in paging the oncall about it. Silences allow you to ignore certain alerts for a while, and are added via the Alertmanager’s web interface.
- Routing
-
It is intended that you would run one Alertmanager per organisation, but it wouldn’t do for all of your notifications to go to one place. Different teams will want their notifications delivered to different places; and even within a team you might want alerts for production and development environments handled differently. The Alertmanager allows you to configure this with a routing tree.
- Grouping
-
You now have the production alerts for your team going to a route. Getting an individual notification for each of the machines in a rack1 that failed would be spammy, so you could have the Alertmanager group alerts and only get one notification per rack, one notification per datacenter, or even one notification globally about the uncontactable machines.
- Throttling and repetition
-
You have your group of alerts that are firing due to the rack of machines being down, and the alert for one of the machines on the rack comes in after you have already sent out the notification. If you sent a new notification every time a new alert comes in from a group, that would defect the purpose of grouping. Instead, the Alertmanager will throttle notifications for a given group so you don’t get spammed.
In an ideal world all notifications would be handled promptly, but in reality the oncall or other system might let an issue slip through the cracks. The Alertmanager will repeat notifications so that they don’t get lost for too long.
- Notification
-
Now that your alerts have been inhibited, silenced, routed, grouped, and throttled, they finally get to the stage of being sent out as notifications through a receiver. Notifications are templated, allowing you to customise their content and emphasise the details that matter to you.
Configuration File
As with all the other configurations you have seen, the Alertmanager is
configured via a YAML file often called alertmanager.yml. As with Prometheus,
the configuration file can be reloaded at runtime by sending a SIGHUP or
sending a HTTP POST to the /-/reload endpoint. To detect bad configuration files in advance, you can use the amtool check-config command to check your alertmanager.yml.2
For example, a minimal configuration that sends everything to an email address using a local SMTP server would look like:
global:smtp_smarthost:'localhost:25'smtp_from:'[email protected]'route:receiver:example-emailreceivers:-name:example-emailemail_configs:-to:'[email protected]'
You must always have at least one route and one receiver. There are various global settings, which are almost all defaults for the various types of receivers. I’ll now cover the various other parts of the configuration file. You can find a full alertmanager.yml combining the examples in this chapter on GitHub.
Routing Tree
The route field specifies the top-level, fallback, or default route.
Routes form a tree, so you can and usually will have multiple routes below
that. For example, you could have:
route:receiver:fallback-pagerroutes:-match:severity:pagereceiver:team-pager-match:severity:ticketreceiver:team-ticket
When an alert arrives it starts at the default route and tries to match against
its first child route, which is defined in the (possibly empty) routes
field. If your alert has a label that is exactly severity="page", it
matches this route and matching halts, as this route has no children to
consider.
If your alert does not have a severity="page" label, then the next child route
of the default route is checked; in this case, for a severity="ticket" label.
If this matches your alert, then matching will also halt. Otherwise, since all
the child routes have failed to match, matching goes back up the tree and
matches the default route. This is known as a post-order tree transversal,
which is to say that children are checked before their parent, and the first
match wins.
There is also a match_re field that requires that the given label match the
given regular expression. As with almost3 all other places, regular expressions are fully anchored. For a
refresher on regular expressions, see “Regular Expressions”.
You could use match_re if there were variants in what label values were used for a
given purpose, such as if some teams used ticket, others used issue, and
others had yet to be convinced that email was possibly not the best place to
send notifications:
route:receiver:fallback-pagerroutes:-match:severity:pagereceiver:team-pager-match_re:severity:(ticket|issue|email)receiver:team-ticket
Both match and match_re can be used in the same route, and alerts must satisfy all
of the match conditions.
Note
All alerts must match some route, and the top-level route is the last route
checked, so it acts as a fallback that all alerts must match. Thus it is an error
for you to use match or match_re on the default route.
Rarely will it just be one team using an Alertmanager, and different teams
will want alerts routed differently. You should have a standard label such as
team or service across your organisation that distinguishes who owns what
alerts. This label will usually but not always come from external_labels, as
discussed in “External Labels”. Using this team-like label you would have
a route per team, and then the teams would have their own routing configuration below
that:
route:receiver:fallback-pagerroutes:# Frontend team.-match:team:frontendreceiver:frontend-pagerroutes:-match:severity:pagereceiver:frontend-pager-match:severity:ticketreceiver:frontend-ticket# Backend team.-match:team:backendreceiver:backend-pagerroutes:-match:severity:pageenv:devreceiver:backend-ticket-match:severity:pagereceiver:backend-pager-match:severity:ticketreceiver:backend-ticket
The frontend team has a simple setup, with pages going to the pager, tickets
going to the ticketing system, and any pages with unexpected severity labels
going to the pager.
The backend team has customised things a little. Any pages from the development
environment will be sent to the backend-ticket receiver, which is to say that
they will be downgraded to just tickets rather than pages.4 In
this way you can have alerts from different environments routed differently in
the Alertmanager, saving you from having to customise alerting rules per
environment. This approach allows you to only have to vary the
external_labels in most cases.
Tip
It can be a little challenging to come to grips with an existing routing tree, particularly if it doesn’t follow a standard structure. There is a visual routing tree editor on the Prometheus website that can show you the tree and what routes alerts will follow on it.
As such a configuration grows as you gain more teams, you may want to write a utility to combine routing tree fragments together from smaller files. YAML is a standard format with readily available unmarshallers and marshallers, so this is not a difficult task.
There is one other setting I should mention in the context of routing—continue. Usually the first matching route wins, but if continue:
true is specified then a match will not halt the process of finding a matching
route. Instead, a matching continue route will be matched and the process of
finding a matching route will continue. In this way an alert can be part of
multiple routes. continue is primarily used to log all alerts to another system:
route:receiver:fallback-pagerroutes:# Log all alerts.-receiver:log-alertscontinue:true# Frontend team.-match:team:frontendreceiver:frontend-pager
Once your alert has a route, the grouping, throttling, repetition, and receiver
for that route will apply to that alert and all the other alerts that
match that route. All settings for child routes are inherited as defaults from
their parent route, with the exception of continue.
Grouping
Your alerts have now arrived at their route. By default, the Alertmanager will put all alerts for a route into a single group, meaning you will get one big notification. While this may be okay in some cases, usually you will want your notifications a bit more bite-sized than that.
The group_by field allows you to specify a list of labels to group alerts by;
this works in the same way as the by clause that you can use with aggregation
operators (discussed in “by”). Typically you will want to split out
your alerts by one or more of alertname, environment, and/or location.
An issue in production is unlikely to be related to an issue in development, and similarly with issues in different datacenters depending on the exact alert. When alerting on symptoms rather than causes, as encouraged by “What Are Good Alerts?”, it is likely that different alerts indicate different incidents.5
To use this in practice you might end up with a configuration such as:
route:receiver:fallback-pagergroup_by:[team]routes:# Frontend team.-match:team:frontendgroup_by:[region,env]receiver:frontend-pagerroutes:-match:severity:pagereceiver:frontend-pager-match:severity:ticketgroup_by:[region,env,alertname]receiver:frontend-ticket
Here the default route has its alerts grouped by the team label, so that any
team missing a route can be dealt with individually. The frontend team has chosen to
group alerts based on the region and env labels. This group_by will be
inherited by their child routes, so all their tickets and pages will also be grouped
by region and env.
Generally it is not a good idea to group by the instance label, since that
can get very spammy when there is an issue affecting an entire application.
However, if you were alerting on machines being down in order to create tickets
to have a human physically inspect them, grouping by instance may make sense
depending on the inspection workflow.
Note
There is no way to disable grouping in the Alertmanager, other than listing
every possible label in group_by. Grouping is a good thing, because it
reduces notification spam and allows you to perform more focused incident
response. It is far harder to miss a notification about a new incident among a
few pages than a hundred pages.6
If you want to disable grouping due to your organisation already having something that fills the Alertmanager’s role, you may be better off not using the Alertmanager and working from the alerts sent by Prometheus instead.
Throttling and repetition
When sending notifications for a group, you don’t want to get a new notification every time the set of firing alerts changes as that would be too spammy. On the other hand, neither do you only want to learn about additional alerts that started firing many hours after the fact.
There are two settings you can adjust to control how the Alertmanager throttles
notifications for a group: group_wait and group_interval.
If you have a group with no alerts and then a new set of alerts starts firing, it
is likely that all these new alerts will not all start firing at exactly the
same time. For example, as scrapes are spread across the scrape interval, if a
rack of machines fails you will usually spot some machines as down one
interval before the others. It’d be good if you could delay the initial
notification for the group a little to see if more alerts are going to come in.
This is exactly what group_wait does. By default, the Alertmanager will wait 30 seconds before sending the first notification. You may worry this
will delay reponse to incidents, but keep in mind that if 30 seconds matter, you should be aiming for an automated rather than a human response.
Now that the first notification has been sent for the group, some additional
alerts might start firing for your group. When should the Alertmanager send you
another notification for the group, now including these new alerts? This is
controlled by group_interval, which defaults to 5 minutes. Every group interval after the first notification,
a new notification will be sent if there are new firing alerts. If there are no
new alerts for a group then you will not receive an additional notification.
Once all alerts stop firing for your group and an interval has passed, the
state is reset and group_wait will apply once again. The throttling for each
group is independent, so if you were grouping by region, then alerts firing
for one region wouldn’t make new alerts in another region wait for a
group_interval, just a group_wait.
Let’s take an example, where there are four alerts firing at different times:
t=  0  Alert firing {x="foo"}
t= 25  Alert firing {x="bar"}
t= 30  Notification for {x="foo"} and {x="bar"}
t=120  Alert firing {x="baz"}
t=330  Notification for {x="foo"}, {x="bar"} and {x="baz"}
t=400  Alert resolved {x="foo"}
t=700  Alert firing {x="quu"}
t=930  Notification for {x="bar"}, {x="baz"}, {x="quu"}
After the first alert the group_wait countdown starts, and a second alert
comes in while you are waiting. Both these foo and bar alerts will be in a
notification sent 30 seconds in. Now the group_interval timer kicks in. In
the first interval there is a new baz alert, so 300 seconds (one group interval) after the first notification there is a second notification containing all
three alerts that are currently firing. At the next interval one alert has been
resolved, but there are no new alerts so there is no notification at t=630.
A fourth alert for quu fires, and at the next interval there is a third
notification containing all three alerts currently firing.
Note
If an alert fires, resolves, and fires again within a group interval, then it is treated in the same way as if the alert never stopped firing. Similarly if an alert resolves, fires, and resolves again within a group interval, it is the same as if the alert never fired in that interval. This is not something to worry about in practice.
Neither humans nor machines are fully reliable; even if a page got through to the oncall and they acknowledged it, they might forget about the alert if more pressing incidents occur. For ticketing systems, you may have closed off an issue as resolved, but you will want it reopened if the alert is still firing.
For this you can take advantage of the repeat_interval, which defaults to 4
hours. If it has been a repeat interval since a notification was sent for a
group with firing alerts, a new notification will be sent. That is to say
that a notification sent due to the group interval will reset the timer for
the repeat interval. A repeat_interval shorter than the group_interval does
not make sense.
Tip
If you are getting notifications too often, you probably want to tweak
group_interval rather than repeat_interval because the issue is more
likely alerts flapping rather than hitting the (usually rather long) repeat
interval.
The defaults for these settings are all generally sane, although you may wish to
tweak them a little. For example, even a complex outage tends to be under
control within 4 hours, so if an alert is still firing after that long it is a
good bet that either the oncall forgot to put in a silence or forgot about the
issue and the repeated notification is unlikely to be spammy. For a ticketing system, once a day is
generally frequent enough to create and poke tickets, so you could set
group_interval and repeat_interval to a day. The Alertmanager will retry
failed attempts at notification a few times so there’s no need to reduce
repeat_interval for that reason alone. Depending on your setup you might
increase group_wait and group_interval to reduce the number of pages you
receive.
All these settings can be provided on a per-route basis, and are inherited as defaults by child routes. An example configuration using these might look like:
route:receiver:fallback-pagergroup_by:[team]routes:# Frontend team.-match:team:frontendgroup_by:[region,env]group_interval:10mreceiver:frontend-pagerroutes:-match:severity:pagereceiver:frontend-pagergroup_wait:1m-match:severity:ticketreceiver:frontend-ticketgroup_by:[region,env,alertname]group_interval:1drepeat_interval:1d
Receivers
Receivers are what take your grouped alerts and produce notifications. A receiver contains notifiers, which do the actual notifications. As of Alertmanager 0.15.0, the supported notifiers are email, HipChat, PagerDuty, Pushover, Slack, OpsGenie, VictorOps, WeChat, and the webhook. Just as file SD is a generic mechanism for service discovery, the webhook is the generic notifier that allows you to hook in systems that are not supported out of the box.
The layout of receivers is similar to service discovery within a scrape config. All receivers must have a unique name, and then may contain any number of notifiers. In the simplest cases you will have a single notifier in a receiver:
receivers:
 - name: fallback-pager
   pagerduty_configs:
    - service_key: XXXXXXXX
PagerDuty is one of the simpler notifiers to get going with, since it only requires a service key to work. All notifiers need to be told where to send the notification, whether that’s the name of a chat channel, an email address, or whatever other identifiers a system may use. Most notifiers are for commercial Software as a Service (SaaS) offerings, and you will need to use their UI and documentation to obtain the various keys, identifiers, URLs, and tokens that are specific to you and where exactly you want the notification sent to. I’m not going to attempt to give full instructions here, because the notifiers and SaaS UIs are constantly changing.
You might also have one receiver going to multiple notifiers, such as having
the frontend-pager receiver sending notifications both to your PagerDuty
service and your Slack channel:7
receivers:-name:frontend-pagerpagerduty_configs:-service_key:XXXXXXXXslack_configs:-api_url:https://hooks.slack.com/services/XXXXXXXXchannel:'#pages'
Some of the notifiers have settings that you will want to be the same across all your uses of that notifier, such as the VictorOps API key. You could specify that in each receiver, but the Alertmanager also has a globals section for these so you only need to specify in the case of VictorOps a routing key in the notifier itself:
global:victorops_api_key:XXXX-XXXX-XXXX-XXXX-XXXXXXXXXXXXreceivers:-name:backend-pagervictorops_configs:-routing_key:a_route_name
Since each field like victorops_configs is a list, you can send notifications
to multiple different notifiers of one type at once, such as sending to multiple
HipChat rooms:8
global:opsgenie_api_key:XXXXXXXXhipchat_auth_token:XXXXXXXXreceivers:-name:backend-pageropsgenie_configs:-teams:backendTeam# This is a comma separated list.hipchat_configs:-room_id:XXX-room_id:YYY
It is also possible for you to specify no receivers at all, which will not result in any notifications:
receivers:-name:null
It’d be better where possible for you not to send alerts to the Alertmanager in the first place, rather than spending Alertmanager resources on processing alerts just to throw them away.
The webhook notifier is unique in that it doesn’t directly notify an existing paging or
messaging system that you might already have in place. Instead, it sends all the
information the Alertmanager has about a group of alerts as a JSON HTTP
message and allows you to do what you like with it. You could use this to log
your alerts, to perform an automated action of some form, or to send a
notification via some system that the Alertmanager doesn’t support directly. A HTTP endpoint that accepts a HTTP POST from a webhook notification is known
as a webhook receiver.
Tip
While it may be tempting to use webhooks liberally to execute code, it would be wise to keep your control loops as small as possible. For example, rather than going from an exporter to Prometheus to the Alertmanager to a webhook receiver to restart a stuck process, keeping it all on one machine with a supervisor such as Supervisord or Monit is a better idea. This will provide a faster response time, and generally be more robust due to fewer moving parts.
The webhook notifier is similar to the others; it takes a URL to which
notifications are sent. If you were logging all alerts you would use continue
on the first route, which would go to a webhook:
route:receiver:fallback-pagerroutes:-receiver:log-alertscontinue:true# Rest of routing config goes here.receivers:-name:log-alertswebhook_configs:-url:http://localhost:1234/log
You could use a Python 3 script such as Example 19-1 to take in these notifications and process the alerts within.
Example 19-1. A simple webhook receiver written in Python 3
importjsonfromhttp.serverimportBaseHTTPRequestHandlerfromhttp.serverimportHTTPServerclassLogHandler(BaseHTTPRequestHandler):defdo_POST(self):self.send_response(200)self.end_headers()length=int(self.headers['Content-Length'])data=json.loads(self.rfile.read(length).decode('utf-8'))foralertindata["alerts"]:(alert)if__name__=='__main__':httpd=HTTPServer(('',1234),LogHandler)httpd.serve_forever()
All HTTP-based receivers have a field called http_config which, similar to
the settings in a scrape config as discussed in “How to Scrape”, allows
setting a proxy_url, HTTP Basic Authentication, TLS settings, and other
HTTP-related configuration.
Notification templates
The layout of messages from the various notifiers are fine to use when starting out, but you will probably want to customise them as your setup matures. All notifiers except the webhook9 permit templating using the same Go templating system as you used for alerting rules in “Annotations and Templates”. However, the data and functions you have access to are slightly different, as you are dealing with a group of alerts rather than a single alert.
As an example, you might always want the region and env labels in your
Slack notification:
receivers:-name:frontend-pagerslack_configs:-api_url:https://hooks.slack.com/services/XXXXXXXXchannel:'#pages'title:'Alertsin{{.GroupLabels.region}}{{.GroupLabels.env}}!'
This will produce a notification like the one you see in Figure 19-1.
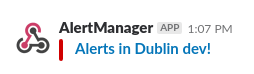
Figure 19-1. A message in Slack with the region and environment
GroupLabels is one of the top-level fields you can access in templating, but there are several others:
GroupLabels-
GroupLabelscontains the group labels of the notification, so will be all the labels listed in thegroup_byfor the route that this group came from. CommonLabels-
CommonLabelsis all the labels that are common across all the alerts in your notification. This will always include all the labels inGroupLabels, and also any other labels that happen to be common. This is useful for opportunistically listing similarities in alerts. For example, if you were grouping by region and a rack of machines failed, the alerts for all the down instances might all have a commonracklabel that you could access inCommonLabels. However, if a single other machine in another rack failed, theracklabel would no longer be in yourCommonLabels. CommonAnnotations-
CommonAnnotationsis likeCommonLabels, but for annotations. This is of very limted use. As your annotations tend to be templated, it is unlikely that there will be any common values. However, if you had a simple string as an annotation, it might show up here. ExternalURL-
ExternalURLwill contain the external URL of this Alertmanager, which can make it easier to get to the Alertmanger to create a silence. You can also use it to figure out which of your Alertmangers sent a notification in a clustered setup. There is more discussion of external URLs in “Networks and Authentication”. Status-
Statuswill befiringif at least one alert in the notification is firing; if all alerts are resolved, it will be resolved. Resolved notifications are covered in “Resolved notifications”. Receiver-
The name of the receiver, which is
frontend-pagerin the preceding example. GroupKey-
An opaque string with a unique identifier for the group. This is of no use to humans, but it helps ticketing and paging systems tie notifications from a group to previous notifications. This could be useful to prevent opening a new ticket in your ticketing system if there was already one open from the same group.
Alerts-
Alertsis the actual meat of the notification, a list of all the alerts in your notification.
Within each alert in the Alerts list there are also several fields:
Labels-
As you would expect, this contains the labels of your alert.
Annotations-
No prizes for guessing that this contains the annotations of your alert.
Status-
firingif the alert is firing; otherwise, it’ll beresolved. StartsAt-
This is the time the alert started firing as a Go
time.Timeobject. Due to how Prometheus and the alerting protocol work, this is not necessarily when the alert condition was first satisfied. This is of little use in practice. EndsAt-
This is when the alert will stop or has stopped firing. This is of no use for firing alerts, but will tell you when a resolved alert resolved.
GeneratorURL-
For alerts from Prometheus,10 this is a link to the alerting rule on Prometheus’s web interface, which can be handy for debugging. To me the real reason this field exists is for a future Alertmanager feature that will allow you to drop alerts coming from a particular source, such as if there’s a broken Prometheus that you can’t shut down sending bad alerts to the Alertmanager.
You can use these fields as you see fit in your templates. For example, you may wish to include all the labels, a link to your wiki, and a link to a dashboard in all of your notifications:
receivers:-name:frontend-pagerslack_configs:-api_url:https://hooks.slack.com/services/XXXXXXXXchannel:'#pages'title:'Alertsin{{.GroupLabels.region}}{{.GroupLabels.env}}!'text:>{{ .Alerts | len }} alerts:{{ range .Alerts }}{{ range .Labels.SortedPairs }}{{ .Name }}={{ .Value }} {{ end }}{{ if eq .Annotations.wiki "" -}}Wiki: http://wiki.mycompany/{{ .Labels.alertname }}{{- else -}}Wiki: http://wiki.mycompany/{{ .Annotations.wiki }}{{- end }}{{ if ne .Annotations.dashboard "" -}}Dashboard: {{ .Annotations.dashboard }}®ion={{ .Labels.region }}{{- end }}{{ end }}
I’ll break this down:
{{ .Alerts | len }} alerts:
.Alerts is a list, and the in-built len function of Go templates counts how
many alerts you have in the list. This is about the most math you can
do in Go templates as there are no math operators, so you should use alerting
templates in Prometheus as discussed in “Annotations and Templates” to calculate any
numbers and render them nicely:
{{ range .Alerts }}
{{ range .Labels.SortedPairs }}{{ .Name }}={{ .Value }} {{ end }}
This iterates over the alerts and then the sorted labels of each alert.
range in Go templates reuses . as the iterator, so the original . is
shadowed or hidden while you are inside the iteration.11 While you could iterate over the label key value pairs in the usual Go
fashion, they will not be in a consistent order. The SortedPairs method of the various
label and annotation fields sorts the label names and provides a list that you
can iterate over.
{{ if eq .Annotations.wiki "" -}}
Wiki: http://wiki.mycompany/{{ .Labels.alertname }}
{{- else -}}
Wiki: http://wiki.mycompany/{{ .Annotations.wiki }}
{{- end }}
Empty labels are the same as no labels, so this checks if the wiki annotation
exists. If it does it is used as the name of the wiki page to link; otherwise,
the name of the alert is used. In this way you can have a sensible default that avoids
you having to add a wiki annotation to every single alerting rule, while
still allowing customisation if you want to override it for one or two alerts.
The {{- and -}} tell Go templates to ignore whitespace before or after
the curly braces, allowing you to spread templates across multiple lines for
readability without introducing extraneous whitespace in the output.
{{ if ne .Annotations.dashboard "" -}}
Dashboard: {{ .Annotations.dashboard }}®ion={{ .Labels.region }}
{{- end }}
If a dashboard annotation is present, it will be added to your notification,
and in addition, the region added as a URL parameter. If you have a Grafana
template variable with this name, you will have it set to point to the right
value. As discussed in “External Labels”, alerting rules do not have access to
the external labels that usually contain things such as region, so this is
how you can add architectural details to your notifications
without your alerting rules having to be aware of how your applications are
deployed.
The end result of this is a notification like the one shown in Figure 19-2. When using chat-like notifiers and paging systems, it is wise for you to keep notifications brief. This reduces the chances of your computer or mobile phone screen being overcome with lengthy alert details, making it hard to get a basic idea of what is going on. Notifications such as these should get you going on debugging by pointing to a potentially useful dashboard and playbook that have further information, not try to info dump everything that might be useful in the notification itself.

Figure 19-2. A customised Slack message
In addition to templating text fields, the destination of notifications can also be templated. Usually each of your teams has their own part of the routing tree and associated receivers. If another team wanted to send your team alerts they would set labels accordingly to use your team’s routing tree. For cases where you are offering a service, particularly to external customers, having to define a receiver for every potential destination could be a little tedious.12
Combining the power of PromQL, labels, and notification templating for alert destinations, you can go so far as to define a per-customer threshold and notification destination in a metric and have the Alertmanager deliver to that destination. The first step is to have alerts that include their destination as a label:
groups:
 - name: example
   rules:
    - record: latency_too_high_threshold
      expr: 0.5
      labels:
        email_to: [email protected]
        owner: foo
    - record: latency_too_high_threshold
      expr: 0.7
      labels:
        email_to: [email protected]
        owner: bar
    - alert: LatencyTooHigh
      expr: |
        # Alert based on per-owner thresholds.
          owner:latency:mean5m
        > on (owner) group_left(email_to)
          latency_too_high_threshold
Here the different owners have different thresholds coming from a metric,
which also provides an email_to label. This is fine for internal customers who
can add their own latency_too_high_threshold to your rule file; for external
customers you may have an exporter exposing these thresholds and destinations
from a database.
Then in the Alertmanager you can set the destination of the notifications based
on this email_to label:
global:smtp_smarthost:'localhost:25'smtp_from:'[email protected]'route:group_by:[email_to,alertname]receiver:customer_emailreceivers:-name:customer_emailemail_configs:-to:'{{.GroupLabels.email_to}}'headers:subject:'Alert:{{.GroupLabels.alertname}}'
The group_by must include the email_to label that you are using to specify
the destination, because each destination needs its own alert group. The same
approach can be used with other notifiers. Note that
anyone with access to Prometheus or the Alertmanager will be able to see
the destinations since labels are visible to everyone. This may be a concern if
some destination fields are potentially sensitive.
Resolved notifications
All notifiers have a send_resolved field, with varying defaults. If it is set
to true then in addition to receiving notifications about when alerts fire,
your notifications will also include alerts that are no longer firing and are
now resolved. The practical effect of this is that when Prometheus informs the
Alertmanager that an alert is now resolved,13 that a notifier
with send_resolved enabled will include this alert in the next notification
and will even send a notification with only resolved alerts if no other alerts
are firing.
While it may seem handy to know that an alert is now resolved, I advise quite a bit of caution with this feature as an alert no longer firing does not mean that the original issue is handled. In “What Are Good Alerts?” I mentioned that responding to alerts with “it went away” was a sign that the alert should probably not have fired in the first place. Getting a resolved notification may be an indication that a situation is improving, but you as the oncall still need to dig into the issue and verify that it is fixed, and not likely to come back. Halting your handling of an incident because the alert stopped firing is essentially the same as saying “it went away.” Because the Alertmanager works with alerts rather than incidents, it is inappropriate to consider an incident resolved just because the alerts stopped firing.
For example, machine down alerts being resolved might only mean that the machine running Prometheus has now also gone down. So while your outage is getting worse, you are no longer getting alerts about it.14
Another issue with resolved notifications is that they can be a bit spammy. If they were enabled for a notifier such as email or Slack, you could be looking at doubling the message volume, thus halving your signal to noise ratio. As discussed in “Alerts Need Owners”, using email for notifications is often problematic and more noise will not help with that.
If you have a notifier with send_resolved enabled, then in notification
templating, .Alerts can contain a mix of firing and resolved alerts. While you
could filter the alerts yourself using the Status field of an alert,
.Alert.Firing will give you a list of just the firing alerts, and
.Alert.Resolved the resolved alerts.
Inhibitions
Inhibitions are a feature that allows you to treat some alerts as not firing if other alerts are firing. For example, if an entire datacenter was having issues but user traffic had been diverted elsewhere, there’s not much point in sending alerts for that datacenter.
Inhibitions currently15 live at the top level of alertmanager.yml. You must specify what alerts to look for, what alerts they will suppress, and which labels must match between the two:
inhibit_rules:
 - source_match:
     severity: 'page-regionfail'
   target_match:
     severity: 'page'
   equal: ['region']
Here, if an alert with a severity label of page-regionfail is firing, it will
supress all your alerts with the same region label that have a severity label
of page.16
Overlap between the source_match and target_match should be avoided since
it can be tricky to understand and maintain otherwise. Having different
severity labels is one way to avoid a overlap. If there is overlap, any alerts matching the source_match will not be suppressed.
I recommend using this feature sparingly. With symptom-based alerting (as discussed in “What Are Good Alerts?”) there should be little need for dependency chains between your alerts. Reserve inhibition rules for large-scale issues such as datacenter outages.
Alertmanager Web Interface
As you saw in “Alerting”, the Alertmanager allows
you to view what alerts are currently firing and to group and filter them.
Figure 19-3 shows several alerts in an Alertmanager grouped by
alertname; you can also see all of the alerts’ other labels.
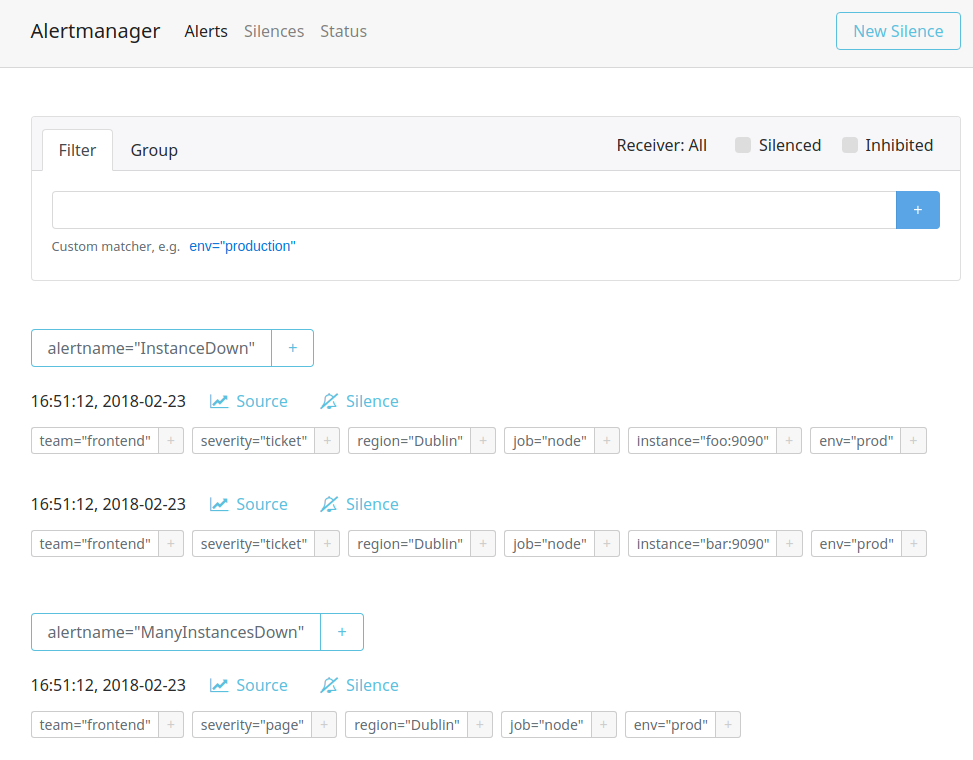
Figure 19-3. Several alerts showing on the Alertmanager status page
From the status page you can click on New Silence to create a silence from scratch, or click on the Silence link to prepopulate the silence form with the labels of that alert. From there you can tweak the labels you want your silence to have. When working with an existing alert you will usually want to remove some labels to cover more than just that one alert. To help track silences you must also enter your name and a comment for the silence. Finally, you should preview the silence to ensure it is not too broad, as you can see in Figure 19-4, before creating the silence.
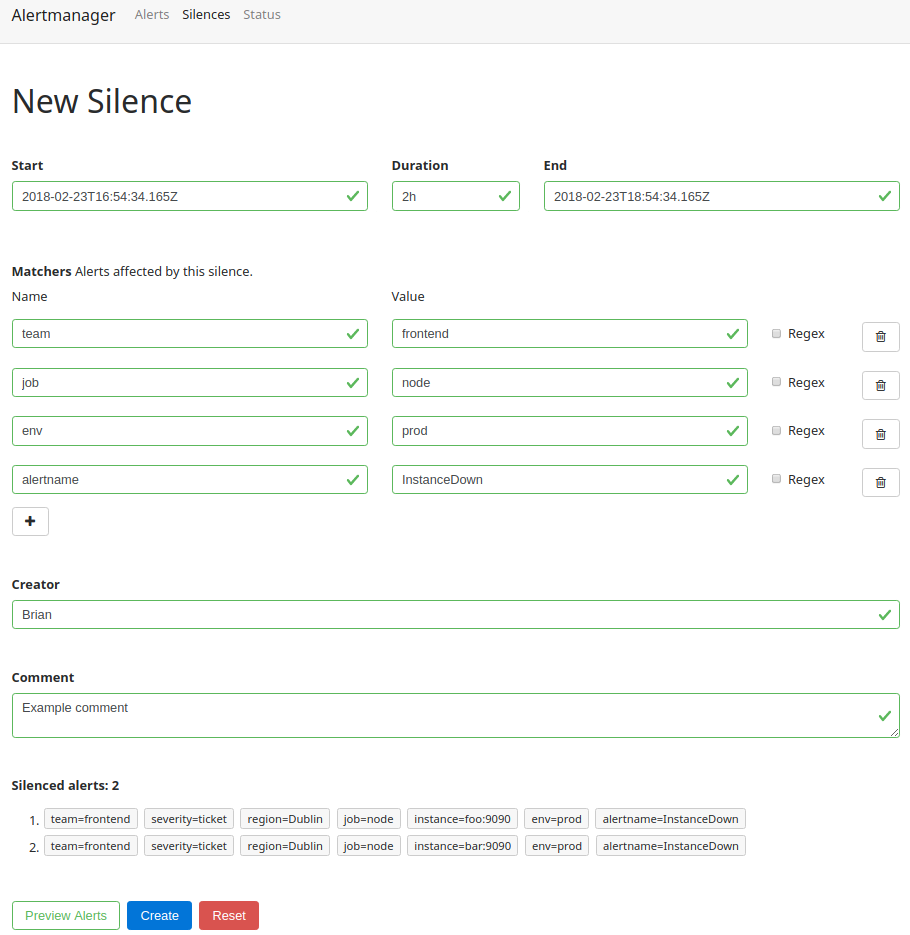
Figure 19-4. Previewing a silence before creating it
If you visit the Silences page you can see all silences that are currently active, the ones that have yet to apply, and the silences that have expired and no longer apply (as shown in Figure 19-5). From here you can also expire silences that no longer apply and recreate silences that have expired.
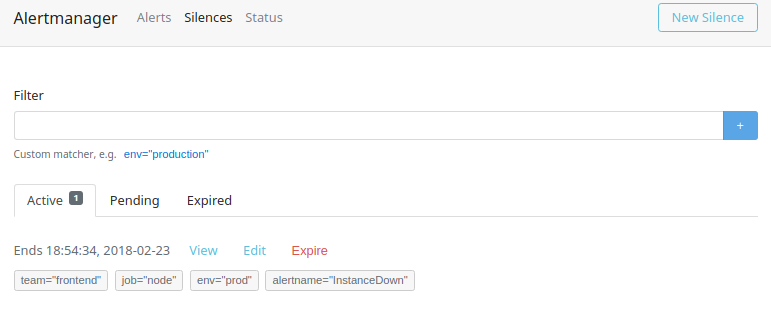
Figure 19-5. The Alertmanager Silences page showing the active silences
Silences stop alerts with the given labels from being considered as alerting for the purposes of notification. Silences can be created in advance, if you know that maintenance is going to happen and don’t want to pointlessly page the oncall, for example. As the oncall you will also use silences to suppress alerts that you’ve already known about for a while, so you are not disturbed while investigating. You can think of a silence like the snooze button on an alarm clock.
If you want to stop alerts at a set time every day you should not do so with
silences, rather add a condition to your alerts that the hour function
returns the desired value, as shown in “Alerting Rules”.
Now that you have seen all the key components of Prometheus, it is time to consider how they all fit together at a higher level. In the next chapter you will learn how to plan a deployment of Prometheus.
1 In datacenters, machines are typically organised in vertical racks, with each rack usually having its own power setup and a network switch. It is thus not uncommon for an entire rack to disappear at once due to a power or switch issue.
2 amtool can also be used to query alerts, and work with silences.
3 The reReplaceAll function in alert and notification templates is not anchored, as that would defeat its purpose.
4 Receiver naming is just a convention, but if your configuration does not result in the backend-ticket receiver creating a ticket, it would be quite misleading.
5 On the other hand, if you are following the RED method, a high failure ratio and high latency can occur together. In practice, one usually happens a good bit before the other, leaving you plenty of time to mitigate the issue or put in a silence.
6 A hundred pages would be a good-sized pagerstorm.
7 PagerDuty also has a Slack integration, which permits acknowledging alerts directly from Slack. This sort of integration is quite handy, and can also cover pages coming from sources other than the Alertmanager that are going to PagerDuty.
8 This is preferable to using continue as it is less fragile, and you don’t have to keep multiple routes in sync.
9 For the webhook it is expected that the webhook receiver was specifically designed to work with the JSON message that is sent, so no templating of the webhook message sent is required. In fact, the JSON message is the exact same data structure that notification templates use under the covers.
10 For other systems it should be a link to whatever is generating the alert.
11 To work around this you can set a variable such as {{ $dot := . }} and then access $dot.
12 Alertmanager configuration is expected to change relatively rarely, as your label structure shouldn’t change that often. Alerting rules, on the other hand, tend to have ongoing churn and tweaks.
13 Resolved alerts will have the annotations from the last firing evaluation of that alert.
14 Alerting approaches to detect this are covered in “Meta- and Cross-Monitoring”, but the salient point here is that you should be in a place where once an alert starts firing, it will get investigated.
15 They may move to per-route at some point (having them as a global setting increases the chances for an inhibition to accidentally supress more than was intended).
16 Using match_re in your routes makes it easier to have more specific severity labels like these, while still handling all pages in one route. If the source alerts are not meant to result in notifications, that would be a good use of a null receiver, as shown in “Receivers”.