
Chapter 18. Alerting
Back in “What Is Monitoring?” I stated that alerting was one of the components of monitoring, allowing you to notify a human when there is a problem. Prometheus allows you to define conditions in the form of PromQL expressions that are continuously evaluated, and any resulting time series become alerts. This chapter will show you how to configure alerts in Prometheus.
As you saw from the example in “Alerting”, Prometheus is not responsible for sending out notifications such as emails, chat messages, or pages. That role is handled by the Alertmanager.
Prometheus is where your logic to determine what is or isn’t alerting is defined. Once an alert is firing in Prometheus, it is sent to an Alertmanager, which can take in alerts from many Prometheus servers. The Alertmanager then groups alerts together and sends you throttled notifications (Figure 18-1).
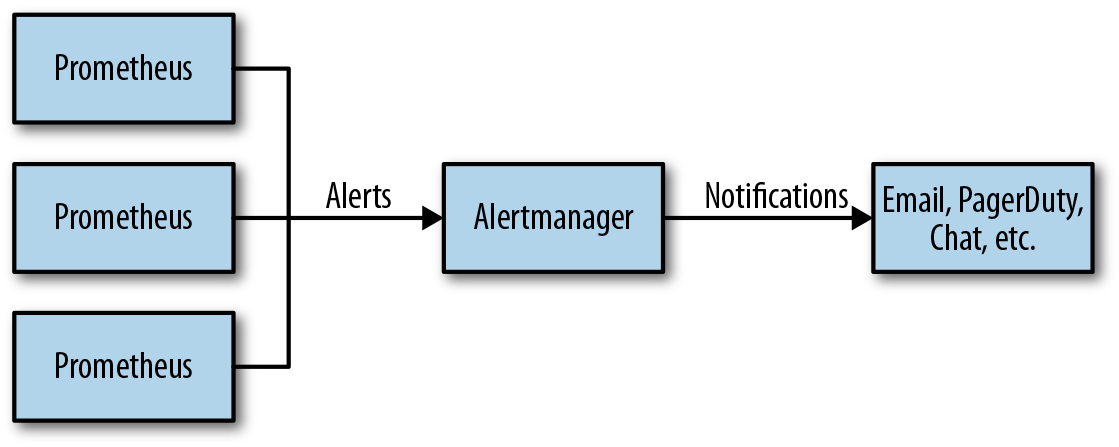
Figure 18-1. Prometheus and Alertmanager architecture
This architecture shown in Figure 18-1 allows you not only flexibility, but also the ability to have a single notification based on alerts from multiple different Prometheus servers. For example, if you had an issue propagating serving data to all of your datacenters, you could configure your alert grouping so that you got only a single notification rather than being spammed by a notification for each datacenter you have.
Alerting Rules
Alerting rules are similar to recording rules, which were covered in Chapter 17. You place alerting rules in the same rule groups as recording rules, and can mix and match as you see fit. For example, it is normal to have all the rules and alerts for a job in one group:1
groups:
 - name: node_rules
   rules:
    - record: job:up:avg
      expr: avg without(instance)(up{job="node"})
    - alert: ManyInstancesDown
      expr: job:up:avg{job="node"} < 0.5
This defines an alert with the name ManyInstancesDown that will fire if more
than half of your Node exporters are down. You can tell that it is an alerting
rule because it has an alert field rather than a record field.
In this example I am careful to use without rather than by so that any
other labels the time series have are preserved and will be passed on to the
Alertmanager. Knowing details such as the job, environment, and cluster of your
alert is rather useful when you get the eventual notification.
For recording rules, you should avoid filtering in your expressions, as time series appearing and disappearing are challenging to deal with. For alerting rules, filtering is essential. If evaluating your alert expression results in an empty instant vector, then no alerts will fire, but if there are any samples returned, each of them will become an alert.
Due to this, a single alerting rule like:
- alert: InstanceDown
  expr: up{job="node"} == 0
automatically applies to every instance in the node job that service
discovery returns, and if you had a hundred down instances you would get a
hundred firing alerts. If on the next evaluation cycle some of those instances
are back up, those alerts are considered resolved.
An alert is identified across evaluation cycles by its labels and does not
include the metric name label __name__, but which does
include an alertname label with the name of the alert.
In addition to sending alerts to the Alertmanager, your alerting rules will also populate a metric called ALERTS. In addition to all
the labels of your alert, an alertstate label is also added. The alertstate
label will have a value of firing for firing alerts and pending for
pending alerts as discussed in “for”. Resolved alerts do not have
samples added to ALERTS. While you can use ALERTS in your alerting rules as
you would any other metric, I would advise caution as it may indicate that you
are overcomplicating your setup.
Note
Correct staleness handling for resolved alerts in ALERTS depends on alerts
always firing from the same alerting rule. If you have multiple alerts with the
same name in a rule group, and a given alert can come from more than one of
those alerting rules, then you may see odd behaviour from
ALERTS.2
If you want notifications for an alert to be sent only at certain times of the day, the Alertmanager does not support routing based on time. But you can use the date functions “minute, hour, day_of_week, day_of_month, days_in_month, month, and year”. For example:
- alert: ManyInstancesDown
  expr: >
    (
        avg without(instance)(up{job="node"}) < 0.5
      and on()
        hour() > 9 < 17
    )
This alert will only fire from 9 a.m. to 5 p.m. UTC. It is common to use the “and operator”
to combine alerting conditions together. Here I used on() as there were no
shared labels between the two sides of the and, which is not usually the
case.
For batch jobs, you will want to alert on the job not having succeeded recently:
- alert: BatchJobNoRecentSuccess
  expr: >
    time() - my_batch_job_last_success_time_seconds{job="batch"} > 86400*2
As discussed in “Idempotency for Batch Jobs”, with idempotent batch jobs you can avoid having to care about or be notified by a single failure of a batch job.
for
Metrics-based monitoring involves many race conditions—a scrape may timeout due to a lost network packet, a rule evaluation could be a little delayed due to process scheduling, and the systems you are monitoring could have a brief blip.
You don’t want to be woken up in the middle of the night for every artifact or
oddity in your systems; you want to save your energy for real problems that
affect users. Accordingly, firing alerts based on the result of a single rule
evaluation is rarely a good idea. This is where the for field of alerting
rules comes in:
groups:
- name: node_rules
  rules:
  - record: job:up:avg
    expr: avg without(instance)(up{job="node"})
  - alert: ManyInstancesDown
    expr: avg without(instance)(up{job="node"}) < 0.5
    for: 5m
The for field says that a given alert must be returned for at least this long
before it starts firing. Until the for condition is met, an alert is
considered to be pending. An alert in the pending state but that
has not yet fired is not sent to the Alertmanager. You can view the current
pending and firing alerts at http://localhost:9090/alerts, which will look like
Figure 18-2 after you click on an alert name.

Figure 18-2. The Alert status page displays firing and pending alerts
Prometheus has no notion of hysteresis or flapping detection for alerting. You should choose your alert thresholds so that the problem is sufficiently bad that it is worth calling in a human, even if the problem subsequently subsides.
I generally recommend using a for of at least 5 minutes for all of
your alerts. This will eliminate false positives from the majority of
artifacts, including from brief flaps. You may worry that this will prevent you
from jumping immediately on an issue, but keep in mind that it will likely
take you the guts of 5 minutes to wake up, boot up your laptop, login,
connect to the corporate network, and start debugging. Even if you are sitting
in front of your computer all ready to go, it is my experience that once your
system is well developed, the alerts you will handle will be nontrivial and
it will take you at least 20–30 minutes just to get an idea of what is going on.
While wanting to immediately jump on every problem is commendable, a high rate of alerts will burn you and your team out and greatly reduce your effectiveness. If you have an alert that requires a human to take an action in less than 5 minutes, then you should work toward automating that action as such a response time comes at a high human cost if you can even reliably react in less than 5 minutes.
You may have some alerts that are less critical or a bit more noisy, with
which you would use a longer duration in the for field. As with other
durations and intervals, try to keep things simple. For example, across all of
your alerts a 5m, 10m, 30m, and 1h for are probably sufficient in practice
and there’s not much point in micro-optimising by adding a 12m or 20m on top of
that.
Note
The state of for is not
currently persisted across restarts of Prometheus, so I advise avoiding for
durations of over an hour. If you need a longer duration, you must currently
handle that via the expression.
Because for requires that your alerting rule return the same time series for a
period of time, your for state can be reset if a single rule
evaluation does not contain a given time series. For example, if you are using
a gauge metric that comes directly from a target, if one of the scrapes fails,
then the for state will be reset if you had an alerting rule such as:
- alert: FDsNearLimit
  expr: >
    process_open_fds > process_max_fds * .8
  for: 5m
To protect against this gotcha you can use the _over_time functions discussed in “Aggregation Over Time”. Usually you will want to use either avg_over_time or
max_over_time:
- alert: FDsNearLimit
  expr:
    (
        max_over_time(process_open_fds[5m])
      >
        max_over_time(process_max_fds[5m]) * 0.9
    )
  for: 5m
The up metric is special in that it is always present even if a scrape fails,
so you do not need to use an _over_time function. So if you were running
the Blackbox exporter, as covered in “Blackbox”, and wanted to catch both
failed scrapes or failed probes3 you could use:
- alert: ProbeFailing
  expr: up{job="blackbox"} == 0 or probe_success{job="blackbox"} == 0
  for: 5m
Alert Labels
Just like with recording rules, you can specify labels for an alerting rule. Using labels with recording rules is quite rare, but it is standard practice with alerting rules.
When routing alerts in the Alertmanager, as covered in “Routing Tree”, you do not want to have to mention the name of every single alert you have individually in the Alertmanager’s configuration file. Instead, you should take advantage of labels to indicate intent.
It is usual for you to have a severity label indicating whether an alert is
intended to page someone, and potentially wake them up, or that it is a ticket
that can be handled less urgently.
For example, a single machine being down should not be an emergency, but half your machines going down requires urgent investigation:
- alert: InstanceDown
  expr: up{job="node"} == 0
  for: 1h
  labels:
    severity: ticket
- alert: ManyInstancesDown
  expr: job:up:avg{job="node"} < 0.5
  for: 5m
  labels:
    severity: page
The severity label here does not have any special semantic meaning; it’s
merely a label added to the alert that will be available for your use when
you configure the Alertmanger. As you add alerts in Prometheus you should set
things up so you only need to add a severity label to get the alert
routed appropriately, and rarely have to adjust your Alertmanager
configuration.
In addition to the severity label, if a Prometheus can send alerts to
different teams it’s not unusual to have a team or service label. If an
entire Prometheus was only sending alerts to one team, you would use
external labels (as discussed in “External Labels”). There should be no need to mention labels like env or
region in alerting rules; they should already either be on the alert due to
being target labels that end up in the output of the alerting expression, or
will be added subsequently by external_labels.
Because all the labels of an alert, from both the expression and the labels,
define the identity of an alert, it is important that they do not vary from
evaluation cycle to evaluation cycle. Aside from such alerts never satisfying
the for field, they will spam the time series database within Prometheus, the
Alertmanager, and you.
Prometheus does not permit an alert to have multiple thresholds, but you can define multiple alerts with different thresholds and labels:
- alert: FDsNearLimit
  expr: >
    process_open_fds > process_max_fds * .95
  for: 5m
  labels:
    severity: page
- alert: FDsNearLimit
  expr: >
    process_open_fds > process_max_fds * .8
  for: 5m
  labels:
    severity: ticket
Note that if you are over 95% of the file descriptor limit then both of these alerts will fire. Attempting to make only one of them fire would be dangerous, as if the value was oscillating around 95% then neither alert would ever fire. In addition, an alert firing should be a situation where you have already decided it is worth demanding a human take a look at an issue. If you feel this may be spammy then you should try and adjust the alerts themselves and consider if they are worth having in the first place, rather than trying to put the genie back in the bottle when the alert is already firing.
Annotations and Templates
Alert labels define the identity of the alert, so you can’t use them to provide additional information about the alert such as its current value as that can vary from evaluation cycle to evaluation cycle. Instead, you can use alert annotations, which are similar to labels and can be used in notifications. However, annotations are not part of an alert’s identity, so they cannot be used for grouping and routing in the Alertmanager.
The annotations field allows you to provide additional information about an
alert, such as a brief description of what is going wrong. In addition, the values
of the annotations field are templated using
Go’s templating system. This allows you
to format the value of the query to be more readable, or even perform
additional PromQL queries to add additional context to alerts.
Prometheus does not send the value of your alerts to the Alertmanager. Because Prometheus allows you to use the full power of PromQL in alerting rules, there is no guarantee that the value of an alert is in any way useful or even meaningful. Labels define an alert rather than a value, and alerts can be more than a simple threshold on a single time series.
For example, you may wish to present the number of instances that are up as a percentage in an annotation. It’s not easy to do math in Go’s templating system, but you can prepare the value in the alert expression:6
groups:
 - name: node_rules
   rules:
    - alert: ManyInstancesDown
      for: 5m
      expr: avg without(instance)(up{job="node"}) * 100 < 50
      labels:
        severity: page
      annotations:
        summary: 'Only {{printf "%.2f" $value}}% of instances are up.'
Here $value is the value of your alert. It is being passed to the printf
function,7 which formats it nicely.
Curly braces indicate template expressions.
In addition to $value, there is $labels with the labels of the alert.
For example, $labels.job would return the value of the job label.
You can evaluate queries in annotation templates by using the query function.
Usually you will want to then range over the result of the query, which is a for loop:
- alert: ManyInstancesDown
  for: 5m
  expr: avg without(instance)(up{job="node"}) < 0.5
  labels:
    severity: page
  annotations:
    summary: 'More than half of instances are down.'
    description: >
      Down instances: {{ range query "up{job="node"} == 0" }}
        {{ .Labels.instance }}
      {{ end }}
The value of the element will be in ., which is a single period or full stop
character. So .Labels is the labels of the current sample from the instant
vector, and .Labels.instance is the instance label of that sample. .Value
contains the value of the sample within the range loop.
Note
Every alert that results from an alerting rule has its templates evaluated independently on every evaluation cycle. If you had an expensive template for a rule producing hundreds of alerts, it could cause you performance issues.
You can also use annotations with static values, such as links to useful dashboards or documentation:
- alert: InstanceDown
  for: 5m
  expr: up{job="prometheus"} == 0
  labels:
    severity: page
  annotations:
    summary: 'Instance {{$labels.instance}} of {{$labels.job}} is down.'
    dashboard: http://some.grafana:3000/dashboard/db/prometheus
In a mature system, attempting to provide all possible debug information in an alert would not only be slow and confuse the oncall, but would likely also be of minimal use for anything but the simplest of issues. You should consider alert annotations and notifications primarily as a signpost to point you in the right direction for initial debugging. You can gain far more detailed and up-to-date information in a dashboard than you can in a few lines of an alert notification.
Notification templating (covered in “Notification templates”) is another layer of templating performed in the Alertmanager. In terms of what to put where, think of notification templating as being an email with several blanks that need to be filled in. Alert templates in Prometheus provide values for those blanks.
For example, you may wish to have a playbook for each of your alerts linked from
the notification, and you will probably name the wiki pages after the alerts.
You could add a wiki annotation to every alert, but any time you find
yourself adding the same annotation to every alerting rule, you should probably
be using notification templating in the Alertmanager instead. The Alertmanager
already knows the alert’s name so it can default to wiki.mycompany/Alertname,
saving you from having to repeat yourself in alerting rules. As with many things in
configuration management and monitoring, having consistent conventions across
your team and company make life easier.
Note
Alerting rule labels are also templated in the same fashion as annotations,
but this is only useful in advanced use cases, and you will almost always
have simple static values for labels. If you do use templating on labels, it
is important that the label values do not vary from evaluation cycle to
evaluation cycle.
What Are Good Alerts?
In Nagios-style monitoring, it would be typical to alert on potential issues such as high load average, high CPU usage, or a process not running. These are all potential causes of problems, but they do not necessarily indicate a problem that requires the urgent intervention by a human that paging the oncall implies.
As systems grow ever more complex and dynamic, having alerts on every possible thing that can go wrong is not tractable. Even if you could manage to do so, the volume of false positives would be so high that you and your team would get burnt out and end up missing real problems buried among the noise.
A better approach is to instead alert on symptoms. Your users do not care whether your load average is high; they care if their cat videos aren’t loading quickly enough. By having alerts on metrics such as latency and failures experienced by users,8 you will spot problems that really matter, rather than things that maybe might possibly indicate an issue.
For example, nightly cronjobs may cause CPU usage to spike, but with few users at that time of day you probably will have no problems serving them. Conversely, intermittent packet loss can be tricky to alert on directly, but will be fairly clearly exposed by latency metrics. If you have Service-Level Agreements (SLAs) with your users, then those provide good metrics to alert on and good starting points for your thresholds. You should also have alerts to catch resource utilisation issues, such as running out of quota or disk space, and alerts to ensure that your monitoring is working.
The ideal to aim for is that every page to the oncall, and every alert ticket filed, requires intelligent human action. If an alert doesn’t require intelligence to resolve, then it is a prime candidate for you to automate. As a nontrivial oncall incident can take a few hours to resolve, you should aim for less than two incidents per day. For nonurgent alerts going to your ticketing system you don’t have to be as strict, but you wouldn’t want too many more than you have pages.
If you find yourself responding to pages with “it went away,” that is an indication that the alert should not have fired in the first place. You should consider bumping the threshold of the alert to make it less sensitive, or potentially deleting the alert.
For further discussion of how to approach alerting on and managing systems I would recommend reading “My Philsophy on Alerting” by Rob Ewaschuk. Rob also wrote Chapter 6 of Site Reliability Engineering (O’Reilly), which also has more general advice on how to manage systems.
Configuring Alertmanagers
You configure Prometheus with a list of Alertmanagers to talk to using the same service discovery configuration covered in Chapter 8. For example, to configure a single local Alertmanager you might have a prometheus.yml that looks like:
global:
  scrape_interval: 10s
  evaluation_interval: 10s
alerting:
  alertmanagers:
   - static_configs:
      - targets: ['localhost:9093']
rule_files:
 - rules.yml
scrape_configs:
 - job_name: node
   static_configs:
    - targets:
      - localhost:9100
 - job_name: prometheus
   static_configs:
    - targets:
      - localhost:9090
Here the alertmanagers field works similarly to a scrape config, but
there is no job_name and labels output from relabelling have no impact since
there is no notion of target labels when discovering the Alertmanagers to send
alerts to. Accordingly, any relabelling will typically only involve drop and
keep actions.
You can have more than one Alertmanager, which will be further covered in “Alertmanager Clustering”. Prometheus will send all alerts to all the configured alertmanagers.
The alerting field also has alert_relabel_configs, which is relabelling as
covered in “Relabelling” but applied to alert labels. You can adjust alert
labels, or even drop alerts. For example, you may wish to have informational
alerts that never make it outside your Prometheus:
alerting:
  alertmanagers:
   - static_configs:
      - targets: ['localhost:9093']
  alert_relabel_configs:
   - source_labels: [severity]
     regex: info
     action: drop
You could use this to add env and region labels to all your alerts, saving
you hassle elsewhere, but there is a better way to do this using
external_labels.
External Labels
External labels are labels applied as defaults when your Prometheus
talks to other systems, such as the Alertmanager, federation, remote read,
and remote write,9
but not the HTTP query APIs. External labels are the identity of Prometheus, and every single Prometheus in your organisation should have unique external labels. external_labels is part of the global section of
prometheus.yml:
global:
  scrape_interval: 10s
  evaluation_interval: 10s
  external_labels:
    region: eu-west-1
    env: prod
    team: frontend
alerting:
  alertmanagers:
   - static_configs:
      - targets: ['localhost:9093']
It is easiest to have labels such as region in your external_labels as you don’t have to
apply them to every single target that is scraped, keep them in mind when
writing PromQL, or add them to every single alerting rule within a Prometheus.
This saves you time and effort, and also makes it easier to share recording and
alerting rules across different Prometheus servers as they aren’t tied to one
environment or even to one organisation. If a potential external label varies
within a Prometheus, then it should probably be a target label instead.
Since external labels are applied after alerting rules are evaluated,10 they are not available in alert templating. Alerts should not care which of your Prometheus servers they are being evaluated in, so this is okay. The Alertmanager will have access to the external labels just like any other label in its notification templates, and that is the appropriate place to work with them.
External labels are only defaults; if one of your time series already has a label with the same name then that external label will not apply. Accordingly, I advise not having targets whose label names overlap with your external labels.
Now that you know how to have Prometheus evaluate and fire useful alerts, the next step is to configure the Alertmanager to convert them into notifications, the topic of the next chapter.
1 If a group gets too large to be calculated in one interval, you may have to split it up if trimming it down is not an option.
2 This also applies to recording rules, but it is quite rare to have multiple recording rules with the same metric name in a group.
3 While the Blackbox exporter should return a response before it times out, things can always go wrong, such as the network being slow or the Blackbox exporter being down.
4 I am also strongly against any form of email that was not written by hand by a human going to team mailing lists, including from alerts, pull requests, and bug/issue trackers.
5 Invariably among the thousands of spam alerts that everyone ignored there was one alert that foreshadowed the outage. Hindsight is 20/20, but to spot that email you would have had to also investigate the thousands of irrelevant notifications.
6 For more advanced cases than this, you can consider using the and operator with the value for templating usage on the left-hand side and the alerting expression on the right-hand side.
7 Despite the name, this is actually a sprintf as it returns the output rather than writing it out. This allows you to build up a query that is passed to the query function using printf.
8 Users don’t have to be customers of your company, such as if you are running an internal service within a company.
9 Covered in “Going Global with Federation” and “Long-Term Storage”.
10 alert_relabel_configs happens after external_labels.