
Before we can begin exploring which features make content shareable, we need to get our hands on a fair amount of content, as well as data on how often it's shared. Unfortunately, securing this type of data has gotten more difficult in the last few years. In fact, when the first edition of this book came out in 2016, this data was easily obtainable. But today, there appears to be no free sources of this type of data, though if you are willing to pay, you can still find it.
Fortunately for us, I have a dataset that was collected from a now defunct website, ruzzit.com. This site, when it was active, tracked the most shared content over time, which is exactly what we require for this project:

We'll begin by loading our imports into our notebook, as we always do, and then load in the data. This particular data is in the form of a JSON file. We can read it in using the pandas read_json() method, as demonstrated in the following code block:
import numpy as np
import pandas as pd
import matplotlib.pyplot as plt
%matplotlib inline
dfc = pd.read_json('viral_dataset.json')
dfc.reset_index(drop=True, inplace=True)
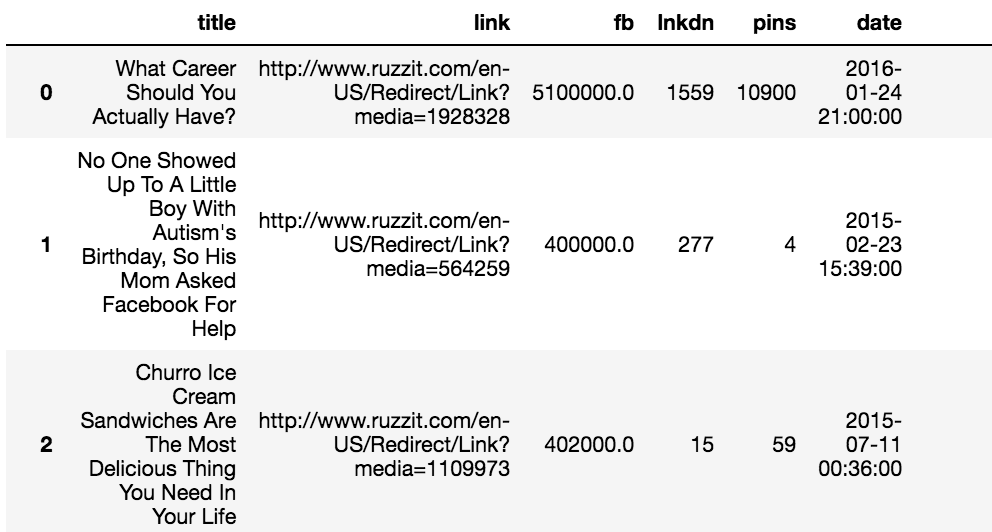
dfc
The preceding code generates the following output:
Let's take a look at the columns of this dataset to better understand what we'll be working with:
dfc.columns
The preceding code generates the following output:

Now, let's walk through what each of these columns represents:
- title: The title of the article
- link: The ruzzit.com link
- bb: The number of Facebook likes
- lnkdn: The number of LinkedIn shares
- pins: The number of Pinterest pins
- date: The date of the article
- redirect: The link to the original article
- pg_missing: A field that describes whether that page is available
- img_link: The link to the image for the article
- json_data: Additional data pertaining to the article
- site: The domain the article is hosted on
- img_count: The number of images contained in the article
- entities: Person-, place-, and thing-related features of the article
- html: The body of the article
- text: The text of the body of the article
Another feature that will be instructive is the word count of each article. We don't have that in our data currently, so let's go ahead and create a function that will provide this for us:
def get_word_count(x):
    if not x is None:
        return len(x.split(' '))
    else:
        return None

dfc['word_count'] = dfc['text'].map(get_word_count)
dfc
The preceding code generates the following output:

Let's add more features. We'll add the most prominent color of the first image on the page. The colors for each image are listed by RGB value in the JSON data, so we can extract it from there:
import matplotlib.colors as mpc

def get_rgb(x):
    try:
        if x.get('images'):
            main_color = x.get('images')[0].get('colors')[0].get('color')
            return main_color
    except:
        return None

def get_hex(x):
    try:
        if x.get('images'):
            main_color = x.get('images')[0].get('colors')[0].get('color')
            return mpc.rgb2hex([(x/255) for x in main_color])
    except:
        return None

dfc['main_hex'] = dfc['json_data'].map(get_hex)
dfc['main_rgb'] = dfc['json_data'].map(get_rgb)

dfc
The preceding code generates the following output:

We've pulled the most prominent color from the first image as an RGB value, but we have also transformed that into a hex value. We'll use that later when we examine the image colors.
With our data now ready, we can begin to perform our analysis. We're going to attempt to find what makes content highly shareable.