
In order to remove the bias of the first week, which we have seen previously, we will subset that dataframe to get only the data that appears after 2013-11-15:
dx = df[df.index > '2013-11-15']

ax = dx.groupby(dx.index.weekday)['comments'].count().plot(kind = 'bar', title = 'Number of comments per day')

ax.set_xticklabels(['Monday', 'Tuesday', 'Wednesday', 'Thursday', 'Friday', 'Saturday', 'Sunday'])

plt.show()
Then we print a bar chart that shows the number of comments per day:
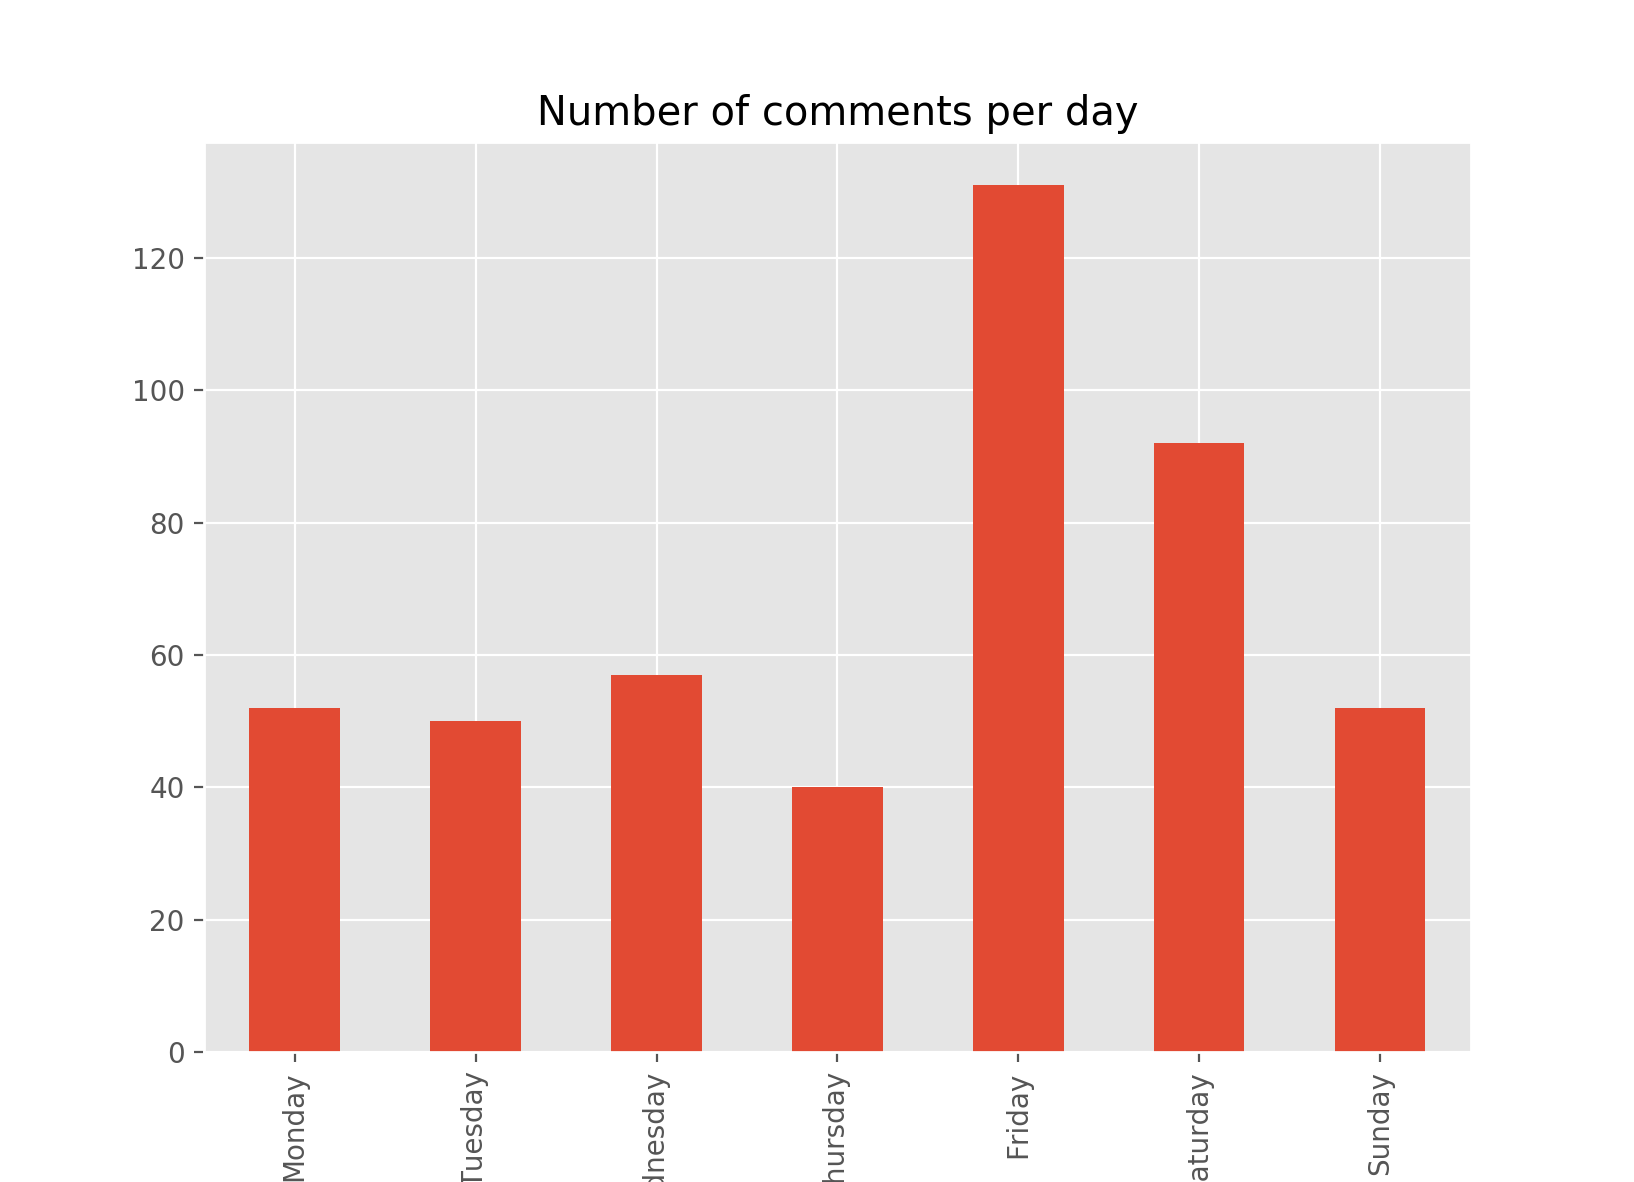
The result of the visualization shows us that the video we chose has a stable rate of engagement with respect to the days of weeks, though the weekend days of Friday and Saturday gather the most engagement. This phenomenon could be explained by the fact that the audience of this video of Sony PlayStation has more time to check out and give opinions on videos at the weekend. It could be an interesting exercise to make the same analysis of more videos of the channel and see if the trend can be generalized for the whole channel. Such insights on time-series are great inputs for marketing teams of companies that need to prioritize the publication of content and interaction with its audience. If certain days of the week generate more activity from the audience, it's efficient to reserve those days to interact and exchange with your audience. This phenomenon could be different for the individual audiences of each social media asset (YouTube, Twitter, Facebook, Instagram, and others).