
Chapter 1. Why Python for Excel?
Usually, Excel users start to look for alternatives when they hit one of Excel’s limitations. A classic example is when Excel workbooks contain so much data or formulas that they become slow and crash in the worst case. It really makes sense though to look into alternatives before the crash happens: if you work on mission-critical workbooks where errors may result in disaster or if you spend hours every day updating Excel workbooks manually, you should learn how to automate your processes with a programming language. Automation takes out the risk of human error and allows you to spend your time on more productive tasks than copy/pasting data into an Excel spreadsheet.
This chapter shows you why Python is an excellent choice in combination with Excel and what the advantages are compared to Excel’s built-in automation language VBA. It starts by viewing Excel as a programming language to explain some of the issues that Excel is often blamed for. To prevent such issues, it looks into best practices that have emerged in the software development community. The chapter moves on with a brief introduction to Power Query and Power Pivot, two modern Excel tools whose functionality is similar to what will will do in Chapter 4 with pandas. I will conclude this chapter by pointing out the specific features that make Python so much stronger in comparison with VBA. Before anything else, let’s start with a quick history lesson!
Introduction
This section starts by looking back at the origins of both, Excel and Python. It then introduces Excel as a programming language which will help you to understand why Excel is often causing troubles when used for serious work.
How it All Began
Excel and Python are both relatively old (in terms of computer technology): Excel was first launched in 1985 by Microsoft—and this may come to a surprise to many: it was only available for Apple Macintosh. It wasn’t until 1987 when Microsoft Windows got its first version in the form of Excel 2.0 that was released for both platforms, Apple Macintosh and Microsoft Windows. Microsoft wasn’t the first player in the market for spreadsheets though: the first was VisiCorp in 1979 with VisiCalc followed by Lotus Software in 1983 with Lotus 1-2-3. And Microsoft didn’t lead with Excel: Their first spreadsheet program was called Multiplan, came out three years before Excel and ran amongst other systems on MS-DOS.
Python was first released in 1991, only six years after Excel. While Excel became popular early on, it took Python a bit longer until it got popular in certain areas like web development or system administration. 2005 marked the beginning of Python becoming a serious alternative for scientific computing with the introduction of NumPy, a package that adds support for array-based computing and linear algebra. NumPy combined two predecessor packages and therefore streamlined all development efforts around scientific computing into a single project. Today, it forms the basis of countless scientific packages including pandas, which was first released in 2008 and which is largely responsible for the widespread adoption of Python in the world of data science and finance that started to happen after 2010. Pandas will accompany us throughout this book so for now let me just mention that pandas’ main data structure is called DataFrame which looks similar to an Excel spreadsheet and thus makes both a great replacement for spreadsheets but also a great interface to exchange data with spreadsheets. The foundations built by NumPy and pandas has led Python, alongside R, to become one of the most common languages used for data science tasks like data analysis, statistics and machine learning.
The fact that Python and Excel were both invented a long time ago isn’t the only thing they have in common though: Excel and Python are also both a programming language. While you certainly aren’t surprised to hear that about Python, it may need an explanation in the context of Excel which I will give you next.
Excel Is a Programming Language
If you are using Excel for more than just managing your grocery list, you are definitely using formulas like =SUM(A1:A4) to sum up a range of cells. If you think for a moment about how this works, you will notice that the value of a formula usually depends on one or more other cells which again depend on one or more other cells and so on until you reach a cell that doesn’t depend on another cell. Such chained cells are called dependency trees in Excel. In a typical Excel workbook you will have multiple dependency trees, one for each independent chain of cells.
Combining functions in such a way is a core principle of functional programming, one of many programming paradigms. You can think of a programming paradigm as how you structure your code and use certain language features. For example, this book will mostly follow the object oriented paradigm—more about that in Chapter 3. While the opinions probably diverge whether Excel checks all the boxes to be officially called a functional programming language, I claim that if you write Excel formulas you can definitely call yourself a programmer!
There is a special thing though about Excel programmers: most of them are business users or domain experts without a formal education in computer science. They are traders, accountants or engineers to mention just a few examples. Their spreadsheet tools are designed to solve a business problem and not to follow best practices in software development. As a consequence, these spreadsheet tools often mix inputs, calculations and outputs on the same sheets, there may be specific and non-obvious steps to be performed in order for them to work properly and critical changes are done without any safety net. In other words, the spreadsheet tools are lacking a solid application architecture and are often undocumented and untested. Sometimes, these issues cause the Excel tool to blow up: for example, if you forget to click the infamous update all button before trading stocks, you may lose a lot of money. And if it isn’t just your own money that is affected by the wrong numbers in Excel, we can sometimes read about it in the news, which we’ll discuss next.
Excel in the News
Two of the biggest “Excel incidents” that made it into the news are most commonly referred to as the London Whale and the Reinhart-Rogoff paper.
The London Whale was a trading incident at JP Morgan in 2012 which forced them to announce a staggering USD 6 billion loss. The source of the blowup was an Excel based value-at-risk model which was substantially underestimating the true risk of losing money in one of their portfolios. The Report of JPMorgan Chase & Co. Management Task Force Regarding 2012 CIO Losses1 (2013) mentions that “the model operated through a series of Excel spreadsheets, which had to be completed manually, by a process of copying and pasting data from one spreadsheet to another”. On top of these operational issues, they had a logical error in one of the calculations as in one occasion they were dividing by a sum instead of an average.
Our next example, the Reinhart-Rogoff paper, is called Growth in a Time of Debt2 and was published in 2010 by Carmen Reinhard and Kenneth Rogoff, two Harvard economists. The main finding of the paper is that once government debt is higher than 90% of gross domestic product, economic growth would fall considerably. However, the paper Does High Public Debt Consistently Stifle Economic Growth? A Critique of Reinhart and Rogoff3 by Herndon et al. (2013) found that Reinhart and Rogoff committed a “spreadsheet coding error” as an average calculation was omitting 5 cells at the bottom of a cell range. Corrected for this and other issues, they found that the economic growth rate would not decline sharply above the 90% threshold but rather be at a positive 2.2%. Paul Krugman, also an economist, wrote a column in the New York Times about the case with the title The Excel Depression4. He claims that the paper played a critical role in the Greek crisis5 that occurred around the same time as the paper was published. In his opinion, it was mainly the paper that made Greece switch from stimulus to austerity measures which caused them to go into a long recession, causing tremendous poverty among the population. The case became so big that it even made it into The Colbert Report, Stephen Colbert’s late-night talk show at the time.
These are just two of many more cases where Excel errors lead to a disastrous outcome. If you want to see more, have a look at the web page Horror Stories, maintained by the European Spreadsheet Risks Interest Group (EuSpRIG). Looking at these examples and understanding why they happened will allow you to be able to take precautionary measures to avoid your company turning up in the news with a similar case. Since we’ve already discussed how using Excel with formulas makes you a programmer, it makes sense that following programming best practices will make your Excel tools massively safer. The practices I recommend you to adopt is the topic of the next section.
Programming Best Practices
This section will introduce you to the most important programming best practices, including separation of concerns, writing readable code, the DRY principle, testing and version control. It will also show you that these best practices are easier to follow when you start using Python together with Excel.
Separation of Concerns
One of the most important design principles in programming is separation of concerns, sometimes also referred to as modularity. It means that a related set of functionality should be taken care of by an independent part of the program so it can be easily replaced without affecting the rest of the application. Separation of concerns can happen on various levels of a program, but at the highest level you usually divide a program into the following layers:
-
Presentation layer
-
Business logic layer
-
Data access layer
-
Data persistence layer
To explain these layers in the context of a spreadsheet, consider a simple currency converter as shown in Figure 1-1.
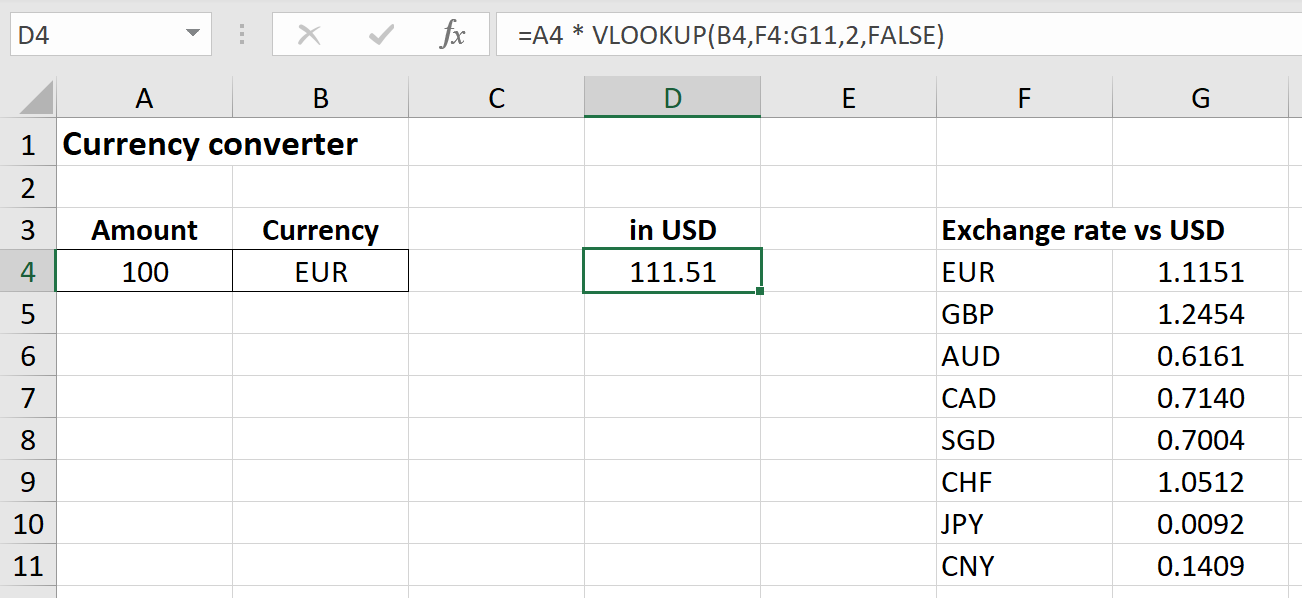
Figure 1-1. A simple Excel application
The application is simple to explain: Type in the Amount and Currency into cells A4 and B4 and Excel will convert this into US Dollars in cell D4. There are many spreadsheet applications that follow such a design and are used by businesses every day. Let me break the application down into its layers:
- Presentation layer
-
The values of cells
A4,B4andD4together with their labels build the presentation layer. - Business logic layer
-
The formula in cell
D4defines how the amount is converted into USD:=A4 * VLOOKUP(B4,F4:G11,2,FALSE)which translates toAmount x Exchange rate. - Data access layer
-
The
VLOOKUPpart of cellD4is the data access layer. - Data persistence layer
-
The exchange rates table starting in cell
F3acts as the database.
If you paid close attention, you probably noticed that cell D4 appears in practically all layers: that is, this simple application mixes the presentation, business logic and data access layers in a single cell. This isn’t necessarily an issue for this easy sample app, but often, what starts off as a small Excel file turns soon enough into a much bigger application. How can this situation be improved? Most professional Excel developer resources advise you to use a separate sheet for each layer, in Excel terminology usually called inputs, calculations and outputs. Often, this is combined with defining a certain color code for each layer, e.g. a blue background for all input cells. In [Link to Come] of this book I will show you how you can use Excel as a pure application frontend, i.e. as the presentation layer only, while the other layers will be handled in Python where it’s much easier to structure your code properly.
Now that you know what separation of concerns means, let’s dig into the next best practice which is about code readability.
Readability
If your code is readable, it means that it is easy to follow and understand—especially for outsiders who haven’t written the code themselves. This makes it easier to spot errors and maintain the code going forward. If you program in VBA, it’s easy to properly organize your code: You can write functions and classes, you can split up your code into different modules and you can use indentation to logically structure code blocks. On the other hand, if you build all your logic in Excel cells using formulas, it’s quite common to see formulas like this (in Excel, it would be a single line):
=SUM(SUMIFS('This Year''s Matches'!M:M,'This Year''s Matches'!E:E,
 'Round Robin Predictions'!D13), SUMIFS('This Year''s Matches'!F:F,
 'This Year''s Matches'!L:L, 'Round Robin Predictions'!D13))
This is one of the easier and shorter formulas taken from Microsoft’s Soccer tournament predictor, an Excel template available for download from their blog post How We Built our Soccer Tournament Predictor in Excel. It’s an interesting template, so you might want to go ahead and download it. By looking at this formula, you will have a very hard time to understand what it is doing. First of all, you’ll need to match the parentheses in your head to see where a function starts and ends. There is, however, an easy way to improve the readability of an Excel formula that you may not be aware of: You can structure your formula by introducing new lines via Alt-Enter. You can also expand the formula bar down to almost the bottom of the screen to be able to see the whole multiline formula. There are also online Excel formula beautifiers available that do the formatting work for you and allow you to copy/paste the nicely indented formula back into Excel. Properly indented, the formula from before is now much easier to read:
=SUM(
    SUMIFS(
        'This Year's Matches'!M:M,
        'This Year's Matches'!E:E,
        'Round Robin Predictions'!D13
    ),
    SUMIFS(
        'This Year's Matches'!F:F,
        'This Year's Matches'!L:L,
        'Round Robin Predictions'!D13
    )
)
In reality, however, even if the formula is now properly formatted, it’s still difficult to understand what the formula is doing as the arguments use references like M:M. A way to improve this is to use named ranges or Excel tables with structured references. Another trick to make a spreadsheet easier to read would be to break up long formulas in either different cells/columns or cover some of the logic in a user defined function. Or—as we will learn in [Link to Come] of this book—remove the formulas altogether and handle the business logic with well structured Python code and meaningful variable names instead of using references like M:M.
Now that you know how to improve code readability with Excel formulas, let’s move on with the next topic on our list of best practices: the DRY principle.
DRY Principle
The Pragmatic Programmer by Hunt and Thomas (Pearson Education) popularized the DRY principle: don’t repeat yourself. No duplicated code means fewer lines of code and fewer errors. Source code that follows the DRY principle therefore tends to be easier to maintain. If your business logic sits in your cell formulas it’s practically impossible to apply the DRY principle as there is no mechanism that allows you to reuse it in another workbook or even in another sheet in the same workbook. This, unfortunately, means that a common way to start a new Excel project is to copy the workbook from the previous project or from a template.
If you write VBA, the most common piece of reusable code is a function. A function allows you to access the same code block from multiple macros, for example. If you have multiple functions that you use all the time, you might want to share them between workbooks. The standard instrument to share VBA code across workbooks are add-ins, but VBA add-ins lack a robust way of distributing and updating them. While Microsoft has introduced an Excel internal add-in store to solve that issue, this only works with JavaScript based add-ins, so it’s not an option for classic VBA add-ins. This means that it is still very common to use the copy/paste approach with VBA: let’s assume that you need a cubic spline function in Excel. The cubic spline function is a popular way to interpolate a curve based on a few given points in a coordinate system: it is often used by fixed income traders to derive an interest rate curve over all maturities based on a few known maturity/interest rate combinations. If you search for “Cubic Spline Excel” on the internet, it won’t take too long until you have a page of VBA code that does what you want. The issue with that is that most commonly these functions have been written by a single person with probably good intentions but without formal documentation or testing. Maybe they work for the majority of inputs but what about some uncommon edge cases? If you are trading a multimillion fixed income portfolio, you want to have something you know you can trust. At least that is what you will hear from your internal auditors when they find out where the code is coming from.
Python makes it easy to distribute code by using a package manager as I will show you later in this chapter. Before we get there, however, let’s continue with automated testing, one of the corner stones of solid software development.
Testing
When you tell the developer of an Excel tool to test their workbooks, they will most likely perform a few random checks: click a button and see if the macro still does what it is supposed to do or change a few inputs and check if the output looks reasonable. This is, however, a risky strategy: Excel makes it very easy to introduce errors that are hard to spot. For example, you can overwrite a formula with a hard coded value. Or you forget to adjust a formula in a hidden column.
When you tell a professional software developer to test their code, they will write unit tests. As the name suggests, it’s a mechanism to test individual components of your program. For example, unit tests make sure that a single function of a program works properly. Most programming languages make it easy to run unit tests automatically. Running automated tests will increase the reliability of your code base dramatically and make reasonably sure that you won’t break anything that currently works when you introduce changes to your code.
If you look at the currency conversion tool from earlier on, you could write a test that checks if the formula in cell D4 correctly returns USD 105 with the following inputs: 100 EUR as amount and 1.05 as the EURUSD exchange rate. Why does this help? Assume that you accidentally delete cell D4 with the conversion formula and have to rewrite it: instead of multiplying with the exchange rate you divide by it—after all, working with currencies can be confusing. When you run the above test, you will get a test failure as 100 EUR / 1.05 will not result in 105 USD anymore as the test expects. This allows you to detect and fix the formula before you hand the spreadsheet over to your users.
Pretty much all of the traditional programming languages offer one or more test frameworks to write unit tests without much effort—but not Excel. Fortunately, the concept of unit tests is simple enough and the combination of Excel and Python will give you access to Python’s powerful unit testing frameworks. In [Link to Come] I will show you everything you need to know to start testing your workbooks with Python. Unit tests are often set up to be run automatically when you commit your code to your version control system. What that is and why it’s hard to do with Excel files, I will explain next.
Version Control
Another fundamental tool used by professional programmers is version control or source control. A version control system (VCS) tracks changes to your source code over time, allowing you to see who changed what, when and why and allows you to revert to old versions at any point in time. The most popular version control system nowadays is Git. It was originally created to manage the Linux source code and since then has conquered the programming world—even Microsoft adopted Git in 2017 to manage the Windows source code. In the Excel world, by contrast, the by far most popular version control system comes in the form of a folder where files are archived like this:
currency_converter_v1.xlsx
currency_converter_v2_2021_04_21.xlsx
currency_converter_final_edits_Bob.xlsx
currency_converter_final_final.xlsx
If, unlike in this sample, the Excel developer sticks to a certain convention in the file name, there’s nothing inherently wrong with that. But keeping a version history of your files locally locks you out of important aspects of source control in the form of easier collaboration, peer reviews, sign-off processes and audit logs. And if you want to make your workbooks more secure and stable, you don’t want to miss out on these things. Most commonly, professional programmers use Git in connection with a web-based platform like GitHub, GitLab, Bitbucket or Azure DevOps. These platforms allow you to work with so called pull requests. Pull requests are a formal way for developers to ask that their changes get merged into the main code base. A pull requests offers the following information:
-
who is the author of the changes
-
when were the changes made
-
what is the purpose of the changes as described in the commit message
-
what are the details of the changes as shown by the diff view, i.e. a view that highlights changes in green for new code and red for deleted code
This allows a co-worker or a team head to review the changes and spot irregularities. Many times, an extra pair of eyes will be able to spot a glitch or two or give otherwise valuable feedback to the programmer. For example, if the developer is violating the DRY principle. With all these advantages, why do Excel developers prefer to use the local file system and their own naming convention instead of a professional system like Git? Here are some of the reasons:
-
Many Excel users simply don’t know about Git or give up early on as Git has a relatively steep learning curve.
-
Git proposes several users to work on local copies of the same file in parallel. After all of them committed their work, Git can usually merge all the changes together without any manual intervention. This doesn’t work for Excel files: if they are being changed in parallel on separate copies, Git does not know how to merge all these changes back into a single file.
-
Even if you manage to deal with the previous issues, Git simply doesn’t deliver as much value with Excel files as it does with text files: Git isn’t able to show changes between Excel files, preventing any peer review process.
Because of all these issues, my company has come up with xltrail, a version control system that knows how to deal with Excel files. While it is based on Git, it hides away its complexity so that business users feel comfortable using it—you can still connect it with an external Git provider if you like. xltrail tracks the different components of a workbook including cell formulas, VBA code, named ranges and Power Queries, providing you with the classic benefits of version control to be able to spot unintended changes and perform peer reviews.
Another option to make version control easier with Excel is to move your business logic from Excel into Python files, something we will do in [Link to Come] of this book. As Python files are easy to track with Git, you will have the most important part of your spreadsheet tool under control.
While this section was called programming best practices, it was mainly pointing out why Excel makes them hard to follow. Before we turn our attention to Python, I would like to say a few words about Power Query and Power Pivot in the next section, Microsoft’s attempt at modernizing Excel.
Modern Excel
Modern Excel has become a bit of a buzz word in the Excel community. The modern era of Excel started with Excel 2007 when the ribbon menu and the new file formats were introduced. However, modern Excel usually refers to the tools that were added with Excel 2010: most importantly Power Query and Power Pivot. They allow you to connect to external data sources and to deal with data that doesn’t fit into a spreadsheet anymore. As their functionality is similar to what we will do with pandas in Chapter 4, I will briefly introduce them in the first part of this section: they may help you getting the job done in cases where you can’t use Python and you have to deal with big datasets from external sources. The second part of this section is about Power BI. Put simply, you could describe Power BI as a standalone business intelligence application that combines Power Query, Power Pivot and visualization capabilities—with native support for Python!
Power Query and Power Pivot
With Excel 2010, Microsoft introduced an add-in called Power Query. Power Query allows you to connect to a multitude of data sources including other Excel workbooks, CSV files or SQL databases. It also offers connections to services like Salesforce and is even extensible so you can write your own data connectors using Power Query’s M language. Power Query’s key feature is that it can deal with large datasets, i.e. datasets that don’t fit into a spreadsheet anymore. After loading the data, you can perform additional steps to clean and manipulate it so it arrives in a usable form in Excel. For example, you can split a column into two, merge two tables or filter and group your data. Since Excel 2016, Power Query is not an add-in anymore but can be accessed directly via the Get Data button on the Data tab on the Excel ribbon. Get & Transform is only partially available on macOS—however, it is being actively developed so you can expect full support to arrive in the future. After all, it’s the most upvoted feature on the macOS specific UserVoice.
Power Pivot is the sibling of Power Query. Conceptually, it’s the second step after acquiring and cleaning your data with Power Query: Power Pivot allows you to analyze and present your data in an appealing way directly in Excel. Think of it as a traditional pivot table that, like Power Query, can deal with large datasets. Power Pivot allows you to define formal data models with relationships and hierarchies and allows you to add calculated columns via the DAX formula language. Power Pivot was also introduced with Excel 2010 but remains and add-in and is so far not available on macOS. If you ever find yourself in a situation where you would like to use Python but can’t, it’s definitely worth having a look at both Power Query and Power Pivot.
If you like the functionality of Power Query and Power Pivot and are looking for a way to build dashboards on top of your data, Power BI is worth a look, as I we will see next.
Power BI
Now that you know about Power Query and Power Pivot, I’d like to take you on a short excursion to meet Power BI. Power BI is not yet another Excel add-in but a standalone application that was released in 2015. It is Microsoft’s answer to business intelligence tools like Tableau or Qlik Sense. Power BI Desktop is free so if you want to play around with it, go to the Power BI homepage and download it—note, however, that Power BI Desktop is only available for Windows. Power BI wants to make sense of large datasets by visualizing them in interactive dashboards. At its core, it is relying on the same Power Query and Power Pivot functionality like Excel. Commercial plans allow you to collaborate and share dashboards online, but these are separate from the desktop version. The main reason why Power BI is exciting in the context of this book is that Microsoft added support for Python scripts in 2018. Python can be used for the query part as well as the visualization part by using Python plotting libraries. While I personally find that using Python in Power BI feels a bit clunky, the important part here is that Microsoft has recognized the importance of Python with regards to data analysis. Accordingly, the hopes are high that one day Python will find an official way into Excel, too. If you don’t use any of the Power tools today, they may be an interesting alternative in cases where you can’t use external tools like Python. Otherwise they cover functionality that this book covers in Chapter 4 with pandas.
So what’s so great about Python that even Microsoft has added support for it in Power BI? This is the topic of the next section.
Python for Excel
Excel is all about storing, analyzing and visualizing data. Python is particularly strong in the area of scientific computing which makes it a natural fit in combination with Excel. Python is also one of the very few languages that is appealing to both the professional programmer as well as the beginner user who writes a few lines of code every few weeks. Professional programmers one the one hand like to work with Python as it is a general purpose programming language and therefore allows you to achieve pretty much anything without jumping through hoops. Beginners, on the other hand, like Python as its syntax and concepts are easier to learn than other languages. As a consequence, Python is used both for ad hoc data analysis and smaller automation tasks as well as in huge production code bases like Instagram’s backend. When your Python-powered Excel tool becomes really popular, it’s easy to add a web developer to the project who will turn your Excel-Python prototype into a fully fledged web application. The unique advantage of Python is that the part with the business logic most likely doesn’t need to be rewritten but can be moved as-is from the Excel prototype to the production web environment.
This section introduces Python’s core concepts and compares them to Excel and VBA. It will touch on code readability, Python’s standard library and package manager, the scientific computing stack, modern language features and cross-platform compatibility. Let’s dive into readability first!
Sample code
This section will use a few Python code samples. Even if I haven’t introduced Python formally yet, you will most likely be able to grasp the idea. At this point, you don’t need to understand them completely: in this chapter, they are here for illustrative purposes and to whet your appetite.
Readability
One line in The Zen of Python is “readability counts”. The Zen of Python is a concise summary of Python’s core design principles. You can read the full Zen of Python by running import this in an interactive Python session—you will learn how to do this in Chapter 2. Python tries to force you to write readable code by using indentation to denote code blocks as used for example in if statements or for loops. Instead of indentation, the majority of the other languages use curly braces and VBA uses keywords. As an example, compare the following two code extracts in VBA and Python. Both samples do exactly the same, but the VBA sample has been messed up so that the ElseIf and Else statements don’t align with the logic of the code. Still, the code works perfectly fine as indentation in VBA is optional and purely used for formatting:
i=20Ifi<5ThenDebug.("i is smaller than 5")ElseIfi<=10ThenDebug.("i is between 5 and 10")ElseDebug.("i is bigger than 10")EndIf
In Python, the indentation itself is used to define the end of the if statement. That is, since elif and else start again at the beginning of the line, they implicitly end the previous logical block. There is no End If statement required like in VBA. If you would you use the same wrong indentation in the Python code, you would get syntax errors: this is how Python forces you to align the visual indentation with the logic of the code:
i=20ifi<5:("i is smaller than 5")elifi<=10:("i is between 5 and 10")else:("i is bigger than 10")
The reason behind using indentation for code blocks is the following: when you write code, most of the time is actually not spent writing it but rather maintaining it. Having readable code helps new programmers (or yourself a few months after writing the code) to go back and understand what’s going on. If the VBA part would be part of a large code base, it will probably require somebody new to the code to read the code multiple times. Otherwise it’s hard to understand that the VBA code also handles the case where i >= 5: if you just glance over it once, your eyes are most likely being mislead by the visual indentation and don’t notice the ElseIf and Else parts, especially if the code blocks are longer.
Knowing a bit more about Python’s syntax, let’s move on to Python’s standard library: the functionality that Python delivers without any additional dependencies.
Standard Library
Python comes with a wide range of functionality out of the box which is delivered by its standard library. The Python community likes to refer to it by saying that Python comes with “batteries included”. Imagine that you need to read a CSV file with Python. CSV stands for comma-separated values and is a text file that uses commas or some other character to delimit fields. Here is a sample of how a CSV file looks like:
First Names,Last Name,Age
François,Petit,32
"John, Mark",Doe,40
If you save this text as sample.csv and want to read this with Python, you can use Python’s csv module that is part of the standard library:
importcsvwithopen('sample.csv')asf:reader=csv.reader(f,delimiter=',',quotechar='"')forrowinreader:(row)
This will print the content of the file as follows:
['First Names', 'Last Name', 'Age']
['François', 'Petit', '32']
['John, Mark', 'Doe', '40']
Even if you don’t follow the Python code yet, you can probably see that it takes no more than two lines for the actual read operation. Because of the quotes it correctly recognizes that the comma in John, Mark is part of the field and not a delimiter. If you wanted to read this CSV file with VBA, you would need to do everything manually: read the file, parse the fields and assign them to an array. This is really hard work in VBA as you need to distinguish between those commas that are delimiters and those that are part of the field.
CSV files and Excel
Excel very aggressively wants to be the default application for opening CSV files. If you have Excel installed, you will probably see the Excel icon on files with the .csv extension. Don’t let yourself be fooled by that! CSV files are really just text files and Excel does not even do a good job if you open a CSV file via double-click: It will not apply the correct character encoding and therefore scrambles up non-ASCII characters like ç.
While this section was about the functionality that comes with Python out of the box, the next section will show you how you can make Python even more powerful with additional packages.
Package Manager
While Python’s standard library covers an impressive amount of functionality, many tasks are still cumbersome to program or slow when you are only relying on the standard library. This is where PyPI comes in. PyPI stands for Python Package Index and is a giant repository where everybody (including you!) can upload open-source Python packages that add additional functionality to Python.
PyPI vs. PyPy
PyPI is pronounced “pie pea eye”. This is to differentiate PyPI from PyPy which is pronounced “pie pie” and which is a fast alternative implementation of Python.
For example, if you need to fetch data from sources on the internet, you would want to install the requests package that makes your work much easier by giving you a set of commands that are powerful yet easy to use. To install the requests package, you can use Python’s package manager pip on your command prompt: pip install requests. pip is Python’s standard package manager and the name is a recursive acronym for pip installs packages. Don’t worry if this sounds a bit abstract right now, I will go into details in Chapter 2 where you will also meet conda, an alternative package manager. Why are package managers so important? One of the main reasons is that any reasonable package will not just depend on Python’s standard library but again on other open-source packages that are also hosted on PyPI. These dependencies might again depend on sub-dependencies and so on and so forth. pip recursively checks the dependencies and sub dependencies of a package and downloads and installs them. pip also makes it easy to update your packages so you can keep your dependencies up-to-date. This allows you to adhere to the DRY principle much easier as you don’t need to reinvent or copy/paste what’s already available on PyPI. With pip and PyPI you also have a solid mechanism to distribute and install these dependencies, something that Excel hasn’t really solved with their traditional add-ins.
With pip, you can install packages for just about anything, but when you look for an alternative for Excel, the most important ones are the packages used for scientific computing. Therefore, the next section gives you a brief introduction to scientific computing with Python.
Scientific Computing
An important reason for Python’s success is that it was created as a general purpose programming language. The capabilities for scientific computing were added later on in the form of third-party packages. This has the unique advantage that a data scientist can use the same language for experiments and research as a web developer, who will eventually build a production ready application around the computational core. Being able to build scientific applications out of one language reduces friction, implementation time and costs. The scientific packages like NumPy, SciPy and pandas give us access to a very concise way of formulating mathematical problems. As an example, compare how you would multiply a matrix with its transpose in VBA, assuming a is a 2-dimensional array:
Application.MMult(a,Application.Transpose(a))
Compare this to the almost mathematical notation in Python, assuming that a is a pandas DataFrame or a 2-dimensional NumPy array:
a@a.T
But it’s not just about aesthetics and readability: NumPy and pandas use compiled C and Fortran code under the hood which allows you to perform these operations very efficiently on big matrices so your program will run much faster than if you try to do the same in VBA.
Remember the cubic spline curve interpolation sample I was mentioning when presenting the DRY principle? With Python, you are able to use the CubicSpline class that comes with SciPy and that is properly documented and unit tested. As a quick example, let’s assume that you have a given set of points in an area given by their (x, y) coordinates: (1, 2), (3, 5), (4, 7). To interpolate y for x = 1.5, you would do the following:
fromscipy.interpolateimportCubicSplinecs=CubicSpline(x=[1,3,4],y=[2,5,7])cs(x=1.5)
As you can see, all it takes is a few lines of code to be able to interpolate your curve based on the few given coordinates. No need to copy/paste code from an untrusted source on the internet.
Missing support for scientific computing are an obvious limitation in VBA. But even when you look at the core language features, VBA has fallen behind, as I will point out in the next section.
Modern Language Features
Since Excel 97, the VBA language hasn’t had any major changes in terms of language features. That, however, doesn’t mean that VBA isn’t supported anymore: Microsoft is shipping updates with every new release of Excel to be able to automate the new Excel features introduced with that release. For example, Excel 2016 added support to automate queries created by Power Query. A language that stopped evolving more than 20 years ago is missing out on modern language concepts that were introduced in all major programming languages over the years. As an example, error handling in VBA has come of age. If you’d like to handle an error gracefully in VBA, it goes something like this:
SubErrorHandling()OnErrorGoToErrorHandlera=1/0OnErrorGoTo0Finally:a="N/A"Debug.aExitSubErrorHandler:Debug."There was an error: "&Err.DescriptionResumeFinallyEndSub
VBA error handling involves the use of labels like Finally and ErrorHandler in the example. Labels are markers where you instruct the code to jump to via the GoTo or Resume statements. Labels were early on recognized to be responsible for what many programmers would call spaghetti code: A nice way of saying that the flow of the code is hard to follow and therefore difficult to maintain. That’s why pretty much all of the actively developed languages including Python have introduced the try/catch mechanism—in Python called try/except. I will introduce it in details in Chapter 3. Another feature that senior VBA developers might enjoy when switching to Python is the fact that Python supports object inheritance, one of the limits of VBA with regards to object-oriented programming.
This section was covering the modern language features of Python. These days, another requirement for a modern programming language is cross-platform compatibility. Why this is important, is the topic of the next section.
Cross-Platform Compatibility
Even if you develop your code on a local computer that runs on Windows or macOS, it’s very likely that at some point you want to run your program on a server. Servers allow your code to be executed on a schedule and make your application accessible from everywhere you want, with the computing power you need. In fact, I will show you how to run Python code on a server in Chapter 2, by introducing you to hosted Jupyter notebooks. The vast majority of servers run on Linux as it has proven to be the most stable, secure and cost effective system for server applications. The fact that Python programs run unchanged on all major operation systems like Windows, macOS and Linux will therefore take away much of the pain when you transition from your local machine to a production setup on a server.
When it comes to cross-platform compatibility, a notoriously annoying area is file path handling. In VBA, you will need to write special logic that can deal with forward and backward slashes if you want your workbook to run on Windows and macOS. Python solves these issues by offering dedicated methods to deal with file paths that work across all supported platforms. For example, to get the absolute path of a data directory that is in your current working directory (denoted as .), you can do:
frompathlibimportPathdata_dir=Path('.').resolve()/'data'
On macOS, data_dir will resolve to something like /Users/felix/python-for-excel/ch01/data whereas on Windows it would be C:Usersfelixpython-for-excelch01data.
In contrast, even though Excel VBA runs on Windows and macOS, it’s easy to introduce functionality that only runs on Windows. In the official VBA documentation or on forums you will often see code like this:
Setfso=CreateObject("Scripting.FileSystemObject")
Whenever you have a CreateObject call or are being told to go to Tools > References in the VBA editor to add a reference, you are almost always dealing with code that will only run on Windows. Another prominent area where you need to take care if you want your Excel files to work across Windows and macOS are ActiveX controls. ActiveX controls are elements like buttons and dropdown controls that you can place on your sheets and use to trigger VBA macros. If you’d like to have a cross-platform workbook, make sure to use form controls instead.
Conclusion
In this chapter, we have seen that Python and Excel are two impressively popular technologies that have both been around for multiple decades—a very long time compared to many other technologies that we use today. I started this chapter with a few “Excel catastrophes” to show you what can go wrong when you don’t use Excel properly with critical workbooks. I then explained you what I understand as proper usage of Excel: applying separation of concerns, following the DRY principle and using automated testing and version control. We then had a look at Power Query and Power Pivot, the tools that Microsoft gave Excel users in order to deal with external data that doesn’t necessarily fit into a spreadsheet anymore. However, I feel that they are not the right solution most of the time: they tie you to the desktop-only world of Excel and prevent you from taking advantage of the flexibility and power of modern cloud-based solutions outside of the Microsoft world. I therefore showed you some of the reasons why Python can a better choice to extend Excel beyond its limits. These reasons include the standard library, the package manager, the libraries for scientific computing and its cross-platform compatibility.
By learning how to combine Excel with Python, you will save a lot of time through automation, commit less errors as programming best practices are easier to apply and you will be able to take your application and scale it up outside of Excel, if you ever need to. Now that you know why Python is such a powerful companion for Excel, it’s time to setup our development environment so you can start writing your first lines of Python code.
1 Wikipedia links to the document in one of the footnotes in their article about the case.
2 The paper can be downloaded from the National Bureau of Economic Research.
3 The paper can be downloaded from the Political Economy Research Institute.
4 The column is available online at The New York Times.
5 For more background on this, see for example Greek government-debt crisis on Wikipedia.