
Chapter 5. Reading and Writing Excel Files
After three chapters of intense introductions to tools, Python and pandas, I will give you a break and start this chapter with a practical case study that allows you to put your newly acquired skills to good use: with only ten lines of Python code, you will consolidate dozens of Excel files into an Excel report, ready to be sent to your managers. In the case study you’ll use pandas to read and write Excel files, which is why the rest of the first section will explore pandas’ Excel functionality in more detail. As easy as it is to use pandas with Excel, there are limitations: if you want to produce Excel files with charts and custom formatting or if you need more fine-grained control to handle big Excel files, you will need to directly work with the Excel reader and writer packages that are used by pandas under the hood. The second section shows you when to use which package and how their syntax works. The third and last section will look at a few advanced topics, namely how to work with big Excel files and how to combine pandas with the reader and writer packages, which allows us to improve the default formatting of DataFrames when writing them to Excel files. At the end of this chapter, we will get back to the initial case study and enhance the Excel report by applying the knowledge from the entire chapter. All packages in this chapter do not rely on the Excel application as they read and write Excel files directly. This means that all code samples run everywhere where Python runs, including Linux.
Using pandas with Excel Files
This section starts with the reporting case study before giving you a more in-depth introduction to the tools that pandas offers to work with Excel files: the ExcelFile class and the read_excel function for reading, and the ExcelWriter class and the to_excel method for writing Excel files.
Case Study: Excel Reporting
This case study is inspired by a few real-world reporting projects that I was involved in over the last few years. Even though the projects took place in completely different industries including telecommunication, digital marketing and finance, they were still remarkably similar: the starting point is usually a directory with Excel files that need to be processed into an Excel report—often on a monthly, weekly or daily basis. In the companion repository, in the directory of this chapter, you will find a folder called sales_data. It contains fictitious sales transactions for a telecommunication provider selling different plans (Bronze, Silver, Gold) in a few stores throughout the United States. For every month, there are two files, one in the new subfolder for new contracts and one in the existing subfolder for existing customers. As the reports come from different systems, they come in different formats: the new customers are delivered as xlsx files, while the existing customers are delivered in the older xls format. Each of the files has up to 10,000 transactions and our goal is to produce an Excel report that shows the total sales per store and month. To get started, let’s have a look at the January.xlsx file in the new subfolder: Figure 5-1 shows you the first few rows.
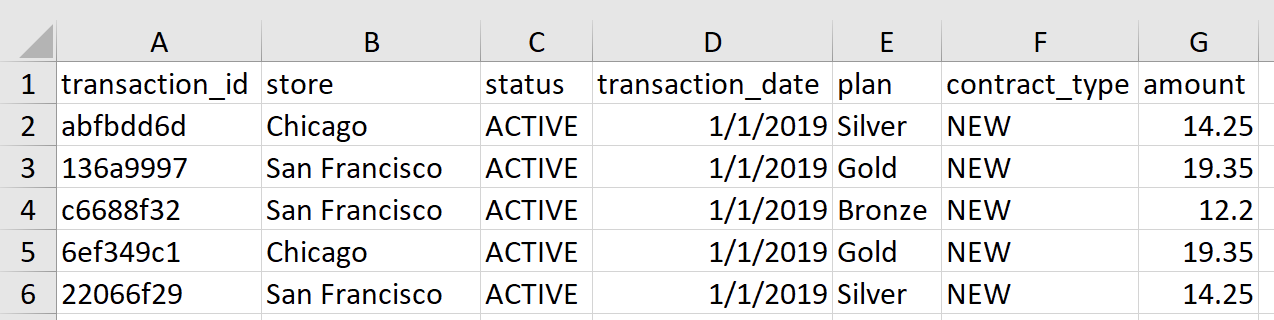
Figure 5-1. The first few sales transactions of new clients (January.xlsx)
The Excel files for the existing contracts look practically the same, except that they are missing the status column and are stored in the xls format. As a first step, let’s read the new transactions from January with pandas’ read_excel function. This function is very similar to the read_csv function that we met in the last chapter. The code samples in this chapter assume that the Jupyter notebook is stored next to the sales_data directory—otherwise you would have to adjust the paths to the sample files.
In[1]:importpandasaspddf=pd.read_excel('sales_data/new/January.xlsx')df.info()
<class 'pandas.core.frame.DataFrame'>
RangeIndex: 9493 entries, 0 to 9492
Data columns (total 7 columns):
 #   Column            Non-Null Count  Dtype
---  ------            --------------  -----
 0   transaction_id    9493 non-null   object
 1   store             9493 non-null   object
 2   status            9493 non-null   object
 3   transaction_date  9493 non-null   datetime64[ns]
 4   plan              9493 non-null   object
 5   contract_type     9493 non-null   object
 6   amount            9493 non-null   float64
dtypes: datetime64[ns](1), float64(1), object(5)
memory usage: 519.3+ KB
As you can see, pandas has properly recognized all the data types of the different columns, including the date format of transaction_date. This allows us to work with the data without further preparation. As this sample is deliberately simple, we can move on with creating a short script called sales_report.py as shown in Example 5-1. This simple script will read in all Excel files from both directories, aggregate the data and write the summary table into an new Excel file. Use VS Code to write the script yourself or open it from the companion repository. If you create it yourself, make sure to place it next to the sales_data folder—this will allow you to run the script without having to adjust any file paths.
Example 5-1. sales_report.py
frompathlibimportPathimportpandasaspd# Directory of this filethis_dir=Path(__file__).parent# Read in all Excel files from all subfolders of sales_dataparts=[]forpathin(this_dir/'sales_data').rglob('*.xls*'):part=pd.read_excel(path,index_col='transaction_id')parts.append(part)# Combine the DataFrames from each file into a single DataFrame# pandas takes care of properly aligning the columnsdf=pd.concat(parts)# Pivot each store into a column and sum up all transaction per datepivot=pd.pivot_table(df,index='transaction_date',columns='store',values='amount',aggfunc='sum')# Resample to end of month and assign an index namesummary=pivot.resample('M').sum()summary.index.name='Month'# Write summary report to Excel filesummary.to_excel(this_dir/'sales_report.xlsx')

Up to this chapter, I was using strings to specify file paths. By using the
Pathclass from the standard library’spathlibmodule instead, you get access to a powerful set of tools: with a path object, you can easily construct paths by concatenating individual parts via forward slashes, as it’s done four lines below withthis_dir / 'sales_data'. These paths work across platforms and allow you to apply filters likerglobas explained under the next point.__file__resolves to the path of the source code file when you run it—using its parent will give you therefore the name of the directory of this file. If you would run this from a Jupyter notebook instead, you would have to replace__file__with.to denote the current directory. In most cases, functions and classes that accept a path in the form of a string also accept a path object.
The easiest way to read in all Excel files recursively from within a certain directory is to use the
rglobmethod of the path object.globis short for globbing which refers to pathname expansion using wildcards.?represents exactly one character while*stands for any number of characters including none. Therinrglobmeans recursive globbing, i.e. it will look for matching files across all subdirectories—accordingly,globwould ignore subdirectories. Using*.xls*as the globbing expression makes sure that the old and new Excel files are found as it matches both.xlsand.xlsx. It’s usually a good idea to slightly enhance the expression like this:[!~$]*.xls*. This makes sure that temporary Excel files (their file name starts with~$) are ignored. For more background on how to use globbing in Python, see the Python docs.
Run the script, for example by clicking the play button at the top right of VS Code. The script will take a moment to complete and once done, the Excel workbook sales_report.xlsx will show up in the same directory as the script. The content of Sheet1 should look like in Figure 5-2.
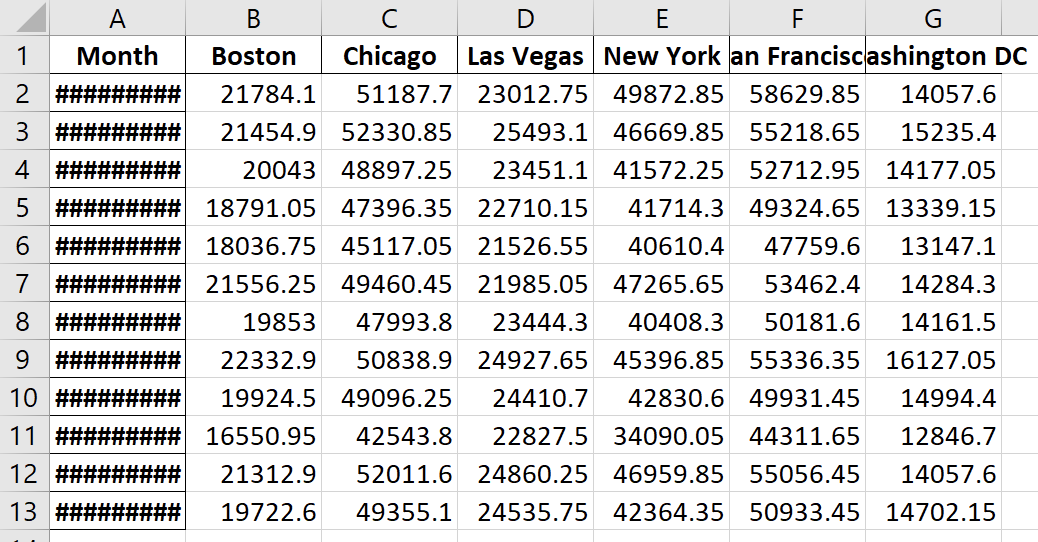
Figure 5-2. The Excel report produced by pandas (sales_report.xlsx)
That’s quite an impressive result for only ten lines of code—even if you will need to adjust the width of the first column to be able to see the dates! For simple cases like this one, pandas offers a really simple solution to work with Excel files. However, we can do much better—after all, a title, some formatting (including the width of the columns) and a chart wouldn’t hurt. That’s exactly what we will get back to at the end of this chapter. First, however, we will need to learn a few more things: the next two sections go into the details of how we can read and write Excel files with pandas. Let’s dive into reading first!
Reading Excel Files with pandas
The case study used Excel workbooks where the data was conveniently in the first sheet and starting in cell A1. In reality, your Excel files are probably not so well organized. In this case, pandas offers parameters to fine-tune the reading process. For the next few samples, we’re going to use the stores.xlsx file. It can be found in the companion repository under the xl subfolder in the directory of this chapter. The first sheet is shown in Figure 5-3.

Figure 5-3. The first sheet of stores.xlsx
By using the sheet_name, skiprows and usecols parameters, we can tell pandas about the range that we want to read in. As usual, it’s a good idea to have a look at the data types of the returned DataFrame by running the info method:
In[2]:df=pd.read_excel('xl/stores.xlsx',sheet_name='2019',skiprows=1,usecols='B:F')df
Out[2]:StoreEmployeesManagerSinceFlagship0NewYork10Sarah2018-07-20False1SanFrancisco12Neriah2019-11-02MISSING2Chicago4Katelin2020-01-31NaN3Boston5Georgiana2017-04-01True4WashingtonDC3EvanNaTFalse5LasVegas11Paul2020-01-06False
In[3]:df.info()
<class 'pandas.core.frame.DataFrame'>
RangeIndex: 6 entries, 0 to 5
Data columns (total 5 columns):
 #   Column     Non-Null Count  Dtype
---  ------     --------------  -----
 0   Store      6 non-null      object
 1   Employees  6 non-null      int64
 2   Manager    6 non-null      object
 3   Since      5 non-null      datetime64[ns]
 4   Flagship   5 non-null      object
dtypes: datetime64[ns](1), int64(1), object(3)
memory usage: 368.0+ bytes
Everything looks good except for the Flagship column—its data type should be bool rather than object. To fix this, we can provide a converter function that deals with the offensive cells in that column. This fixes our issue:
In[4]:df=pd.read_excel('xl/stores.xlsx',sheet_name='2019',skiprows=1,usecols='B:F',converters={'Flagship':lambdax:Falseifxin['','MISSING']elsex})df
Out[4]:StoreEmployeesManagerSinceFlagship0NewYork10Sarah2018-07-20False1SanFrancisco12Neriah2019-11-02False2Chicago4Katelin2020-01-31False3Boston5Georgiana2017-04-01True4WashingtonDC3EvanNaTFalse5LasVegas11Paul2020-01-06False
In[5]:df.info()
<class 'pandas.core.frame.DataFrame'>
RangeIndex: 6 entries, 0 to 5
Data columns (total 5 columns):
 #   Column     Non-Null Count  Dtype
---  ------     --------------  -----
 0   Store      6 non-null      object
 1   Employees  6 non-null      int64
 2   Manager    6 non-null      object
 3   Since      5 non-null      datetime64[ns]
 4   Flagship   6 non-null      bool
dtypes: bool(1), datetime64[ns](1), int64(1), object(2)
memory usage: 326.0+ bytes
read_excel also accepts a list of sheet names. In this case, it returns a dictionary with the DataFrame as value and the name of the sheet as key. To read in all sheets with pandas, you would need to provide sheet_name=None. Also note the slight variation of how I am using usecols by providing the column names of the table:
In[6]:sheets=pd.read_excel('xl/stores.xlsx',sheet_name=['2019','2020'],skiprows=1,usecols=['Store','Employees'])sheets['2019'].head(2)
Out[6]:StoreEmployees0NewYork101SanFrancisco12
If the source file doesn’t have column headers, you can set header=None and provide them via names. Note that sheet_name also accepts sheet indices:
In[7]:df=pd.read_excel('xl/stores.xlsx',sheet_name=0,skiprows=2,usecols='B:C,F',skipfooter=3,header=None,names=['Branch','Employee_Count','Is_Flagship'])df
Out[7]:BranchEmployee_CountIs_Flagship0NewYork10False1SanFrancisco12MISSING2Chicago4NaN
To handle NaN values, you can use a combination of na_values and keep_default_na. The next sample tells pandas to only interpret cells with the word MISSING as NaN and nothing else.
In[8]:df=pd.read_excel('xl/stores.xlsx',sheet_name='2019',skiprows=1,usecols='B,C,F',skipfooter=2,na_values='MISSING',keep_default_na=False)df
Out[8]:StoreEmployeesFlagship0NewYork10False1SanFrancisco12NaN2Chicago43Boston5True
pandas offers an alternative way to read Excel files by using the ExcelFile class. This mostly makes a difference if you want to read in multiple sheets from a file in the legacy xls format: in this case, using ExcelFile will be faster as it prevents pandas from reading in the whole file multiple times. ExcelFile can be used as a context manager so the file is properly closed again:
In[9]:withpd.ExcelFile('xl/stores.xls')asf:df1=pd.read_excel(f,'2019',skiprows=1,usecols='B:F',nrows=2)df2=pd.read_excel(f,'2020',skiprows=1,usecols='B:F',nrows=2)df1
Out[9]:StoreEmployeesManagerSinceFlagship0NewYork10Sarah2018-07-20False1SanFrancisco12Neriah2019-11-02MISSING
You can also use ExcelFile to list the names of all sheets like so:
In[10]:stores=pd.ExcelFile('xl/stores.xlsx')stores.sheet_names
Out[10]:['2019','2020','2019-2020']
Finally, pandas allows you to read Excel files from a URL, similar to how we did it with CSV files in Chapter 4. Let’s read it directly from the companion repo:
In[11]:url=('https://github.com/fzumstein/python-for-excel/''blob/master/ch05/xl/stores.xlsx?raw=true')pd.read_excel(url,skiprows=1,usecols='B:E',nrows=2)
Out[11]:StoreEmployeesManagerSince0NewYork10Sarah2018-07-201SanFrancisco12Neriah2019-11-02
To summarize, Table 5-1 shows you the most commonly used read_excel parameters. You will find the complete list in the official docs.
| Parameter | Description |
|---|---|
|
Instead of providing a sheet name, you could also provide the index of the sheet (zero-based), e.g. |
|
This allows you to skip over the indicated number of rows. |
|
If the Excel file includes the names of the column headers, you can use them to select the columns. Alternatively, it can also be a list of column indices (e.g. |
|
Number of rows you want to read. |
|
Indicates which column should be the index, accepts the name according to the header or as index, e.g. |
|
If you set |
|
Provide the desired names of your columns as list. |
|
Pandas interprets the following cell values as |
|
If you’d like to ignore the default values that pandas interprets as |
|
Excel stores all numbers internally as floats. pandas, therefore, transforms numbers without meaningful decimals to integers. If you want to change that behavior, you can set |
|
Allows you to provide a function per column to convert its values. For example, to make the text in a certain column uppercase, you can use |
Now that we are done with the reading part, let’s see how pandas handles the writing part in the next section!
Writing Excel Files with pandas
When using to_excel, you can tell pandas in which cell of which sheet you want the DataFrame to be placed. You can also decide whether or not to include the column headers and the index of the DataFrame and how to treat data types like np.nan and np.inf that don’t have an equivalent representation in Excel. Let’s start by creating a DataFrame so that we can use its to_excel method:
In[12]:importnumpyasnpimportdatetimeasdtdata=[[dt.datetime(2020,1,1,10,13),2.222,1,True],[dt.datetime(2020,1,2),np.nan,2,False],[dt.datetime(2020,1,2),np.inf,3,True]]df=pd.DataFrame(data=data,columns=['A','B','C','D'])df.index.name='index'df
Out[12]:ABCDindex02020-01-0110:13:002.2221True12020-01-0200:00:00NaN2False22020-01-0200:00:00inf3True
In[13]:df.to_excel('written_with_pandas.xlsx',sheet_name='Output',startrow=1,startcol=1,index=True,header=True,na_rep='<NA>',inf_rep='<INF>')
Running the to_excel command will create the Excel file as shown in Figure 5-4 (you will need to make column C wider to make the dates visible):
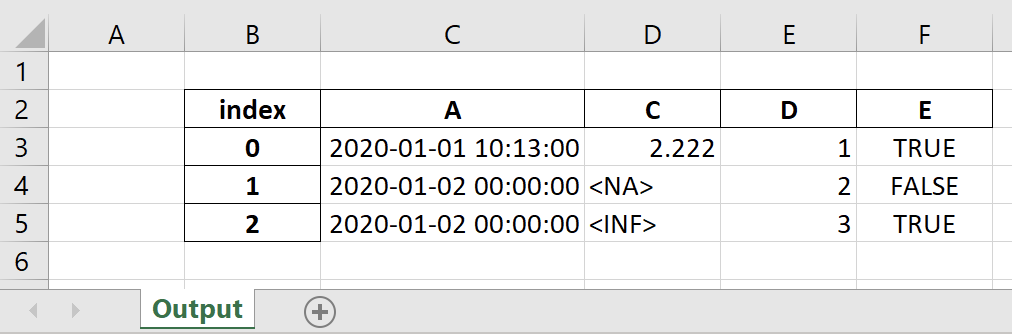
Figure 5-4. A DataFrame written to Excel (written_with_pandas.xlsx)
If you want to write multiple DataFrames to the same or different sheets, you will need to use the ExcelWriter class. The following sample writes the same DataFrame to two different locations on Sheet1 and one more time to Sheet2:
In[14]:withpd.ExcelWriter('written_with_pandas2.xlsx')aswriter:df.to_excel(writer,sheet_name='Sheet1',startrow=1,startcol=1)df.to_excel(writer,sheet_name='Sheet1',startrow=10,startcol=1)df.to_excel(writer,sheet_name='Sheet2')
Since we’re using the ExcelWriter class as a context manager, the file is automatically written to disk when exiting the context manager, without having to save or close the file explicitly. For a summary of the most important parameters that you can use with to_excel, have a look at Table 5-2. You will find the full list of parameters in the official docs.
| Parameter | Description |
|---|---|
|
Name of the sheet to write to. |
|
|
|
If you want to hide the index and/or header, set them to |
|
By default, |
|
You can freeze the first couple of rows and columns by supplying a tuple: for example |
As you could see, reading and writing simple Excel files with pandas is easy. There are limitations though with that approach: the next section shows you which ones.
Limitations when using pandas with Excel Files
The nice thing about pandas is that it offers a consistent interface to work with all supported Excel file formats, whether that’s xls, xlsx, xlsm or xlsb. Pandas, however, doesn’t do the heavy lifting itself: under the hood, it selects one of the reader and writer packages to do the job. Using pandas to read and write Excel files works great for simple cases but there are limits:
-
Writing DataFrames to files doesn’t allow you to include charts or advanced features like conditional formatting.
-
When reading files, pandas automatically transforms cells with errors like
#REF!or#NUM!intoNaN, making it impossible to search for specific errors in your spreadsheets. -
Working with big Excel files may require extra settings that are easier to control when using the reader and writer packages directly, see “Working with Big Excel Files”.
In the next section, I’ll introduce you to all of the reader and writer packages that pandas uses and I will show you how to use them directly without pandas.
Reader and Writer Packages
In this section, we will look at the packages that pandas relies upon when we call the read_excel and to_excel functions. Using these packages directly gives you the power to control everything the way you want and use functionality that isn’t available through pandas, like writing charts or using conditional formatting. Also, should you ever work on a project where you only need to read and write Excel files without the need for the rest of the pandas functionality, installing the full NumPy/pandas stack would probably be overkill. Unfortunately, the reader and writer landscape can be a bit overwhelming: we are going to look at no less than six packages in this section as almost every Excel file type requires a different package. Each package uses a different syntax which often deviates substantially from the original Excel object model—I’ll say more about the Excel object model in the next chapter. This means that you will likely have to look up a lot of commands, even if you are a seasoned VBA developer. This section starts by telling you when you need which package before introducing a helper module that makes working with these packages a little easier. After that, it presents each of the packages in a cookbook style where you can look up how the most popular commands work.
When to Use which Package
This section introduces six packages that we will use to read and write Excel files directly. Let me start with the links to their documentations:
To understand which package can do what, have a look at Table 5-3. For example, if you need to read the old xls file format, you will have to use the xlrd package:
| Excel File Format | Read | Write | Edit |
|---|---|---|---|
|
xlrd |
xlwt |
xlutils |
|
OpenPyXL, xlrd |
XlsxWriter, OpenPyXL |
OpenPyXL |
|
OpenPyXL, xlrd |
OpenPyXL, XlsxWriter |
OpenPyXL |
|
OpenPyXL, xlrd |
OpenPyXL |
OpenPyXL |
|
pyxlsb |
- |
- |
If you end up in a cell with only one package: congratulations, you know which package to use. If your task offers more than one package—like reading or writing xlsx files—you will need to make a decision. Here are a few hints to help you with that:
- Read xlsx and xlsm files (OpenPyXL vs. xlrd)
-
-
xlrd isn’t officially maintained anymore so it should mostly be used for the legacy
xlsformat—still, having a package that can read bothxlsandxlsxformats can sometimes be useful. -
OpenPyXL can read the cell formulas or values while xlrd can only read the values.
-
Which package will be faster depends on the size of your Excel file, the number of sheets and how many sheets you want to read: in case of the
xlsxformat, xlrd always loads the full file into memory which can make it much slower if your file is big and you only need to read a fraction of the sheets. OpenPyXL on the other hand can read single rows from single sheets, see “Working with Big Excel Files” which can make it much faster in this case. If, however, you need to read all sheets that are in your workbook, xlrd can be faster, but for smaller workbooks, the difference may not be significant. OpenPyXL is also undergoing development to improve the performance, so I can only recommend to give both libraries a try if speed is essential.
-
- Write xlsx files (OpenPyXL vs. XlsxWriter)
-
Both packages cover similar functionality, but each package may have a few unique features that the other one doesn’t have. As both libraries are actively being developed, this is changing over time. Here is where they differ:
-
XlsxWriter can only write, OpenPyXL can additionally read and edit.
-
XlsxWriter has a more extensive documentation.
-
OpenPyXL makes it easier to produce Excel files with VBA macros.
-
XlsxWriter tends to be faster than OpenPyXL, but again, depending on the size of the workbook you’re writing, the differences may not be significant.
-
The package that gets listed first in Table 5-3 corresponds to the default package that pandas uses1. To specify the package that pandas should use, use the engine parameter in the read_excel or to_excel functions or the ExcelFile and ExcelWriter classes, respectively. Reading xlsb files via pandas requires to explicitly specify the engine:
pd.read_excel('filename.xlsb',engine='pyxlsb')
After having picked the correct package for your task, there is a second challenge waiting for you: most of these packages are relatively low-level and require quite a bit of code to read or write a range of cells. To make your life easier, I created a helper module that I’ll introduce next.
The excel.py Module
The reader and writer packages are low-level packages: this means that they lack convenience functions that would allow you to tackle common tasks in possibly one line of code. For example, most of the packages require you to loop through all the cells that you are going to read or write. To make your life easier and to be able to switch from one package to another without having to rewrite everything, I have created the excel.py module, allowing you to easily read and write nested lists to and from Excel ranges. You will find the module in the companion repository in the directory of this chapter as well as in Appendix B. You will see the module in action in the upcoming sections, but as a preview, here is how it works:
importexcelvalues=excel.read(sheet_object,first_cell='A1',last_cell=None)excel.write(sheet_object,values,first_cell='A1')
The read function accepts a sheet object of the respective package together with the optional arguments first_cell and last_cell. They can be provided in either the A1 notation or as row-column-tuple with Excel’s one-based indices: (1, 1). The default value for the first_cell is A1 whereas the default value for last_cell is the bottom right corner of the used range. Hence, if you only provide the sheet name, it will read the whole sheet. The write function works similarly: it expects the sheet object along with the values as nested list and an optional first_cell which marks the upper left corner of where the nested list will be written to. The module also harmonizes the data type conversion as shown in Table 5-4.
| Excel representation | Python data type |
|---|---|
Empty cell |
|
Cell with a date format |
|
Cell with a boolean |
|
Cell with an error |
|
String |
|
Float |
|
Equipped with the helper module, we’re now ready to dive into the packages: the next four sections are about OpenPyXL, XlsxWriter, pyxlsb and xlrd/xlwt/xlutils. They follow a cookbook style that allows you to get started quickly with each package. Instead of reading through it sequentially, I would recommend you to pick the package that you need based on Table 5-3, then jump directly to the corresponding section.
OpenPyXL
OpenPyXL is the only package in this section that can do both, read and write Excel files. It can even be used to edit simple Excel files. Let’s start by looking at how reading works!
Reading with OpenPyXL
The following sample code shows you how to to read the values from an Excel workbook with OpenPyXL. To get the cell values, you need to open the workbook with data_only=True. The default is on False which will return the formulas of the cells instead.
In[15]:importopenpyxlimportexcel
In[16]:# Open the workbook to read cell values.# The file is automatically closed again after loading the data.book=openpyxl.load_workbook('xl/stores.xlsx',data_only=True)
In[17]:# Get a worksheet object by name or index (0-based)sheet=book['2019']sheet=book.worksheets[0]
In[18]:# Get a list with all sheet namesbook.sheetnames
Out[18]:['2019','2020','2019-2020']
In[19]:# Loop through the sheet objects.# Instead of 'name', openpyxl uses 'title'.foriinbook.worksheets:(i.title)
2019
2020
2019-2020
In[20]:# Getting the dimensions,# i.e. the used range of the sheetsheet.max_row,sheet.max_column
Out[20]:(8,6)
In[21]:# Read the value of a single cell# using 'A1' notation and using cell indices (1-based)sheet['B6'].valuesheet.cell(row=6,column=2).value
Out[21]:'Boston'
In[22]:# Read in a range of cell values by using our excel moduledata=excel.read(book['2019'],(2,2),(8,6))data[:2]
Out[22]:[['Store','Employees','Manager','Since','Flagship'],['New York',10,'Sarah',datetime.datetime(2018,7,20,0,0),False]]
Writing with OpenPyXL
OpenPyXL builds the Excel file in memory and writes out the file once you call the save method. The following code produces the file as shown in Figure 5-5.
In[23]:importopenpyxlfromopenpyxl.drawing.imageimportImagefromopenpyxl.stylesimportFont,colorsfromopenpyxl.chartimportBarChart,Referenceimportexcel# Instantiate a workbookbook=openpyxl.Workbook()# Get the first sheet and give it namesheet=book.activesheet.title='Sheet1'# Writing individual cells using A1 notation# and cell indices (1-based)sheet['A1'].value='Hello 1'sheet.cell(row=2,column=1,value='Hello 2')# Font formattingfont_format=Font(color='FF0000',bold=True)sheet['A3'].value='Hello 3'sheet['A3'].font=font_format# Number formattingsheet['A4'].value=3.3333sheet['A4'].number_format='0.00'# Date formatting (using Excel's formatting strings)sheet['A5'].value=dt.date(2016,10,13)sheet['A5'].number_format='mm/dd/yy'# Formula: You must use the English name of the formula# with commas as delimiterssheet['A6'].value='=SUM(A4, 2)'# Imagesheet.add_image(Image('python.png'),'C1')# 2-dimensional listdata=[[None,'Last Year','This Year'],['North',2,3],['South',5,6]]excel.write(sheet,data,'A10')# Chartchart=BarChart()chart.type='col'chart.title='Sales Per Region'chart.x_axis.title='Regions'chart.y_axis.title='Sales'data=Reference(sheet,min_col=2,min_row=10,max_row=12,max_col=3)categories=Reference(sheet,min_row=11,min_col=1,max_row=12,max_col=1)chart.add_data(data,titles_from_data=True)chart.set_categories(categories)sheet.add_chart(chart,"A15")# Saving the workbook creates the physical filebook.save('openpyxl.xlsx')
If you want to write an Excel template file, you’ll need to set the template attribute to True before saving it:
In[24]:book=openpyxl.Workbook()book.template=Truebook.save('template.xltx')
As you could see in the code, OpenPyXL is setting the font color by providing the color='FF0000' argument. FF0000 is made up of three hex values (FF, 00 and 00) that correspond to the red/green/blue values of the desired color. Hex stands for hexadecimal and represents numbers using a base of 16 instead of a base of 10 like our standard decimal system.
Finding the hex value of a color
To find the desired hex value of a color in Excel, click on the paint dropdown that you would use to change the background color of a cell, then select More Colors. You can now select your color and read off its hex value from the menu.

Figure 5-5. The file written by OpenPyXL (openpyxl.xlsx)
Editing with OpenPyXL
There is no reader/writer package that can truly edit Excel files: in reality, OpenPyXL reads the file with everything it understands, then writes the file again from scratch—including any changes you make in between. This can be very powerful for simple Excel files that contain mainly formatted cells with data and formulas, but it’s limited when you have charts and other more advanced content in your spreadsheet as OpenPyXL will either be changing them or dropping them altogether. For example, it will rename charts and drop their title. Here is a simple editing example:
In[25]:# Read the stores.xlsx file, change a cell# and store it under a new location/name.book=openpyxl.load_workbook('xl/stores.xlsx')book['2019']['A1'].value='modified'book.save('stores_edited.xlsx')
If you want to write an xlsm file, OpenPyXL has to work off an existing xlsm file that you need to load with the keep_vba parameter set to True:
In[26]:book=openpyxl.load_workbook('xl/macro.xlsm',keep_vba=True)book['Sheet1']['A1'].value='Click the button!'book.save('macro_openpyxl.xlsm')
The button in the example file is calling a macro that shows a message box. OpenPyXL covers a lot more functionality than I was able to cover in this section. It is therefore a good idea to have a look at the official docs.
XlsxWriter
As the name suggests, XlsxWriter can only write Excel files. The following code produces the same workbook as the corresponding part under “Writing with OpenPyXL”. Note that XlsxWriter uses zero-based cell indices, while OpenPyXL uses one-based cell indices—make sure to take this into account if you switch from one package the to the other!
In[27]:importdatetimeasdtimportxlsxwriterimportexcel# Instantiate a workbookbook=xlsxwriter.Workbook('xlxswriter.xlsx')# Add a sheet and give it a namesheet=book.add_worksheet('Sheet1')# Writing individual cells using A1 notation# and cell indices (0-based)sheet.write('A1','Hello 1')sheet.write(1,0,'Hello 2')# Font formattingfont_format=book.add_format({'font_color':'#FF0000','bold':True})sheet.write('A3','Hello 3',font_format)# Number formattingnumber_format=book.add_format({'num_format':'0.00'})sheet.write('A4',3.3333,number_format)# Date formatting (using Excel's formatting strings)date_format=book.add_format({'num_format':'mm/dd/yy'})sheet.write('A5',dt.date(2016,10,13),date_format)# Formula: You must use the English name of the formula# with commas as delimiterssheet.write('A6','=SUM(A4, 2)')# Imagesheet.insert_image(0,2,'python.png')# 2-dimensional listdata=[[None,'old','new'],['one',2,3],['two',5,6]]excel.write(sheet,data,'A10')# Chartchart=book.add_chart({'type':'column'})chart.set_title({'name':'Sales per Region'})chart.add_series({'name':'=Sheet1!B10','categories':'=Sheet1!A11:A12','values':'=Sheet1!B11:B12'})chart.add_series({'name':'=Sheet1!C10','categories':'=Sheet1!A11:A12','values':'=Sheet1!C11:C12'})chart.set_x_axis({'name':'Regions'})chart.set_y_axis({'name':'Sales'})sheet.insert_chart('A15',chart)# Closing the workbook creates the physical filebook.close()
Being a pure writer package, XlsxWriter has to take a more complicated approach to write xlsm files than OpenPyXL. First, you need to extract the macro code from an existing Excel file on the command line (the example uses the macro.xlsm file which is included in the companion repo):
- Windows
-
Start by changing into the
xlsubdirectory of this chapter’s folder, then find the path to the Python script:$ cd C:Usersusernamepython-for-excelch05xl $ where vba_extract.py C:UsersusernameAnaconda3Scriptsvba_extract.py
Then use the returned path like this:
$ python C:UsersusernameAnaconda3Scriptsvba_extract.py macro.xlsm
- macOS
-
On macOS, the command is available as executable script and can be run like this:
$ cd /Users/username/python-for-excel/ch05/xl
$ vba_extract.py macro.xlsm
This will save the file vbaProject.bin in the directory where you are running the command. I have also included the extracted file in the companion repo. You can use it when writing the workbook and attach it to a macro button as follows:
In[28]:book=xlsxwriter.Workbook('macro_xlxswriter.xlsm')sheet=book.add_worksheet('Sheet1')sheet.write('A1','Click the button!')book.add_vba_project('xl/vbaProject.bin')sheet.insert_button('A3',{'macro':'Hello','caption':'Button 1','width':130,'height':35})book.close()
pyxlsb
pyxlsb is in an early stage but it’s your only option when it comes to reading Excel files in the binary xlsb format. pyxlsb is not part of Anaconda, so you will need to install it if you want to read xlsb files. It is currently not available via conda either, so use pip to install it:
$ pip install pyxlsb
You can read sheets and cell values as follows:
In[29]:importpyxlsbimportexcel# Loop through sheets. With pyxlsb, the workbook# and sheet objects can be used as context managers.# book.sheets returns a list of sheet names, not objects.withpyxlsb.open_workbook('xl/stores.xlsb')asbook:forsheet_nameinbook.sheets:withbook.get_sheet(sheet_name)assheet:dim=sheet.dimension(f'Sheet "{sheet_name}" has 'f'{dim.h} rows and {dim.w} cols')
Sheet "2019" has 7 rows and 5 cols
Sheet "2020" has 7 rows and 5 cols
Sheet "2019-2020" has 20 rows and 5 cols
In[30]:# Read in the values of a range of cells by using our excel module.# Instead of '2019', you could also use its index (1-based).withpyxlsb.open_workbook('xl/stores.xlsb')asbook:withbook.get_sheet('2019')assheet:data=excel.read(sheet,'D2','E3')data
Out[30]:[['Manager','Since'],['Sarah',43301.0]]
There is currently no way of telling the type of a cell, so you will have to manually convert cells with datetime format like so:
In[31]:frompyxlsbimportconvert_dateconvert_date(data[1][1])
Out[31]:datetime.datetime(2018,7,20,0,0)
Remember that you need to specify the engine explicitly if you want to use pyxlsb via pandas:
In[32]:df=pd.read_excel('xl/stores.xlsb',engine='pyxlsb')
xlrd, xlwt and xlutils
The combination of xlrd, xlwt and xlutils offers roughly the same functionality for the xls format that OpenPyXL offers for the xlsx format: xlrd reads, xlwt writes and xlutils edits xls files. Additionally, xlrd can also read the xlsx format. These packages are currently not actively maintained anymore, but my feeling is that they are still going to be relevant for quite some time because there are no other packages that can handle the old xls format. xlutils is not part of Anaconda, so it has to be installed manually:
$ conda install xlutils
Reading with xlrd
The following sample code shows you how to read the values from an Excel workbook with xlrd.
In[33]:importxlrdimportxlwtfromxlwt.Utilsimportcell_to_rowcol2importxlutilsimportexcel
In[34]:# Open the workbook to read cell values. The file is# automatically closed again after loading the data.book=xlrd.open_workbook('xl/stores.xls')
In[35]:# Get a list with all sheet namesbook.sheet_names()
Out[35]:['2019','2020','2019-2020']
In[36]:# Loop through the sheet objectsforsheetinbook.sheets():(sheet.name)
2019
2020
2019-2020
In[37]:# Get a sheet object by name or index (0-based)sheet=book.sheet_by_index(0)sheet=book.sheet_by_name('2019')
In[38]:# Dimensionssheet.nrows,sheet.ncols
Out[38]:(8,6)
In[39]:# Read the value of a single cell# using 'A1' notation and using cell indices (0-based).# The * unpacks the tuple that cell_to_rowcol2 returns# into individual arguments.sheet.cell(*cell_to_rowcol2('B3')).valuesheet.cell(2,1).value
Out[39]:'New York'
In[40]:# Read in a range of cell values by using our excel moduleexcel.read(sheet,'B2','C3')
Out[40]:[['Store','Employees'],['New York',10.0]]
Used Range
Unlike OpenPyXL and pyxlsb, xlrd returns the dimensions of cells with a value, instead of the used range of a sheet when using sheet.nrows and sheet.ncols. What Excel returns as used range often contains empty rows and columns at the bottom and at the right border of the range. This can, for example, happen when you delete the content of rows (by hitting the delete key), rather than delete the rows themselves (by right-clicking and selecting Delete).
Writing with xlwt
Writing with xlwt is straight-forward and the following code follows the corresponding steps under “Writing with OpenPyXL”. xlwt, however, cannot produce charts and only supports the bmp format for pictures.
In[41]:importxlwtfromxlwt.Utilsimportcell_to_rowcol2importdatetimeasdtimportexcel# Instantiate a workbookbook=xlwt.Workbook()# Add a sheet and give it a namesheet=book.add_sheet('Sheet1')# Writing individual cells using A1 notation# and cell indices (0-based)sheet.write(*cell_to_rowcol2('A1'),'Hello 1')sheet.write(r=1,c=0,label='Hello 2')# Font formattingfont_format=xlwt.easyxf('font: bold 1, color red')sheet.write(r=2,c=0,label='Hello 3',style=font_format)# Number formattingnumber_format=xlwt.easyxf(num_format_str='0.00')sheet.write(3,0,3.3333,number_format)# Date formatting (using Excel's formatting strings)date_format=xlwt.easyxf(num_format_str='mm/dd/yyyy')sheet.write(4,0,dt.datetime(2012,2,3),date_format)# Formula: You must use the English name of the formula# with commas as delimiterssheet.write(5,0,xlwt.Formula('SUM(A4, 2)'))# 2-dimensional listdata=[[None,'old','new'],['one',2,3],['two',5,6]]excel.write(sheet,data,'A10')# Picture (only allows to add bmp format)sheet.insert_bitmap('python.bmp',0,2)# This writes the file to diskbook.save('xlwt.xls')
Editing with xlutils
xlutils acts as a bridge between xlrd and xlwt. This makes it explicit that this is not a true editing operation: the spreadsheet is read including the formatting via xlrd (by setting formatting_info=True) and then written out again by xlwt, including the changes that were made in between:
In[42]:importxlutils.copybook=xlrd.open_workbook('xl/stores.xls',formatting_info=True)book=xlutils.copy.copy(book)book.get_sheet(0).write(0,0,'changed!')book.save('stores_edited.xls')
At this point, you know when to use which package to read and write an Excel workbook in a specific format. This is helpful if you don’t need pandas otherwise or if you want to create more advanced Excel reports than what pandas allows you to produce. The next section moves on with a few advanced topics: how you can work with big Excel files and how you can use pandas and the reader and writer packages together to produce nicely formatted Excel reports.
Advanced Topics
You know now how to read and write simple Excel files using either pandas or the reader and writer packages directly. However, if your files are bigger and more complex than the stores.xlsx file, relying on the default settings may mean that your files will take a long time to process or use more memory than your system has to offer. Therefore, we start this section by looking at the available options to deal with bigger files. Then, we’ll learn how to use pandas and the reader and writer packages together: combining the two worlds will open up the ability to style your pandas DataFrames the way you want. To conclude this section, we will use everything we learned in this chapter to make the Excel report from the opening case study look much more professional.
Working with Big Excel Files
Working with big files can cause two issues: the reading and writing process may be slow or your computer may run out of memory. Usually, the memory issue is of bigger concern as it will cause your program to crash. When exactly a file is considered big always depends on the available resources on your system and your definition of slow. This section shows optimization techniques offered by the individual packages allowing you to work with Excel files that push the limits. I’ll start by looking at the options for the writer libraries, followed by the options for the reader libraries. I’ll conclude this section by showing you how you can read the sheets of a workbook in parallel to reduce processing time.
Writing with OpenPyXL
When writing large files with OpenPyXL, make sure to have the package lxml installed as this makes the writing process faster. It is included in Anaconda, so there’s nothing you need to do about that. The critical option though is the write_only=True flag which makes sure that the memory consumption remains low. It, however, forces you to write row by row by using the append method and won’t allow you to write single cells anymore:
In[43]:book=openpyxl.Workbook(write_only=True)sheet=book.create_sheet()for_inrange(1000):sheet.append(list(range(200)))book.save('openpyxl_optimized.xlsx')
Writing with XlsxWriter
XlsxWriter has a similar option like OpenPyXL called constant_memory. It forces you to write sequential rows, too. You enable the option by providing an options dictionary like this:
In[44]:book=xlsxwriter.Workbook('xlsxwriter_optimized.xlsx',options={'constant_memory':True})sheet=book.add_worksheet()forrinrange(1000):sheet.write_row(r,0,list(range(200)))book.close()
Reading with xlrd
When reading big files in the old xls format, xlrd allows you to load sheets on demand like this (this optimization is not available with xlsx files):
In[45]:withxlrd.open_workbook('xl/stores.xls',on_demand=True)asbook:sheet=book.sheet_by_index(0)# only loads the first sheet
If you don’t use the workbook as a context manager, you will need to call book.release_resources() manually to properly close the workbook again. To use xlrd in this mode with pandas, use it like this:
In[46]:withxlrd.open_workbook('xl/stores.xls',on_demand=True)asbook:withpd.ExcelFile(book,engine='xlrd')asf:df=pd.read_excel(f,sheet_name=0)
Reading with OpenPyXL
To keep memory under control when reading big Excel files with OpenPyXL, you should load the workbook with read_only=True. Since OpenPyXL doesn’t support the with statement, you will need to make sure to close the file again when you’re done. If your file contains links to external workbooks, you may additionally want to use keep_links=False to make it faster. keep_links makes sure that the references to external workbooks are kept which may unnecessarily slow down the process if you are only interested in reading the values of a workbook.
In[47]:book=openpyxl.load_workbook('xl/big.xlsx',data_only=True,read_only=True,keep_links=False)# Perform the desired read operations herebook.close()# Required with read_only=True
Reading sheets in parallel
When you use pandas’ read_excel function to read in multiple sheets of a big workbook, you will find that this takes a long time (see the next code example). The reason is that pandas reads sheets sequentially, i.e. one after another. To speed things up, you could read the sheets in parallel. While there is no easy way to parallelize the writing of workbooks due to how the files are structured internally, reading multiple sheets in parallel is simple enough. However, since parallelization is an advanced topic, I left it out of the Python introduction and won’t go into details here either: in Python, if you want to take advantage of the multiple CPU cores that every modern computer has, you can use the multiprocessing package that is part of the standard library. This will spawn multiple Python interpreters (usually one per CPU core) which work on a task in parallel. Instead of processing one sheet after another, you can have one Python interpreter process the first sheet, while at the same time a second Python interpreter is processing the second sheet etc. However, every additional Python interpreter takes some time to start up and uses additional memory, so if you have small files, they will most likely run slower when you parallelize the reading process instead of faster. In the case of a big file with multiple big sheets, multiprocessing can speed up the process substantially though—always assuming that your system has the required memory to handle the workload. In the companion repo as well as in Appendix B, you will find pandas_parallel.py, which is a simple implementation for reading the sheets in parallel, using OpenPyXL as the engine. You can use it as follows:
importpandas_parallelpandas_parallel.read_excel(filename,sheet_name=None)
By default, it will read in all sheets but you can provide a list of sheet names that you want to process. The function returns a dictionary in the following form: {sheetname: df}, i.e. keys are the sheet names and the values are the DataFrames. Let’s see how much faster the parallelized version is in comparison to the sequential version:
In[48]:%%timedata=pd.read_excel('xl/big.xlsx',sheet_name=None,engine='openpyxl')
CPU times: user 57.4 s, sys: 197 ms, total: 57.6 s
Wall time: 57.8 s
In[49]:%%timeimportpandas_paralleldata=pandas_parallel.read_excel('xl/big.xlsx',sheet_name=None)
CPU times: user 102 ms, sys: 119 ms, total: 221 ms
Wall time: 14.7 s
To access a single DataFrame, you would write data['Sheet1'] in both cases. Looking at the wall time of both samples, you’ll see that the parallelized version was multiple times faster than pd.read_excel with this particular workbook and on my laptop with 6 CPU cores. If you want it even faster, you can parallelize OpenPyXL directly: you can also find an implementation for that in Appendix B, together with an implementation for xlrd to read the older xls format in parallel. Going through the underlying packages instead of pandas will allow you to skip the transformation into a DataFrame or only apply the cleaning steps that you need which will most likely help you make things faster—if that is your biggest concern. If you are only reading in one sheet, it is worth looking at Modin, a project that acts as a drop in replacement for pandas for effortless parallelizing. It parallelizes the reading process of a single sheet and provides impressive speed improvements. Support for multiple sheets may be added in the future. First, you need to install Modin:
$ conda install -c conda-forge modin
Since Modin requires a specific version of pandas, it will possibly downgrade the version that comes with Anaconda. To prevent this, you could work with an own conda environment, as explained in Appendix A. Now let’s see how pandas and Modin compare when reading in a single sheet:
In[50]:%%timedata=pd.read_excel('xl/big.xlsx',sheet_name=0,engine='openpyxl')
CPU times: user 12 s, sys: 59.2 ms, total: 12 s
Wall time: 12.1 s
In[51]:importmodin.pandas
In[52]:%%timedata=modin.pandas.read_excel('xl/big.xlsx',sheet_name=0,engine='openpyxl')
CPU times: user 807 ms, sys: 96 ms, total: 903 ms
Wall time: 4.96 s
Now that you know how to deal with big files, let’s move on and see how we can use pandas and the low-level packages together to improve the default formatting!
Formatting DataFrames in Excel
To begin with, let me show you how you can use pandas together with the reader and writer packages: pandas’ ExcelFile and ExcelWriter objects give you access to the underlying workbook and worksheet objects via the book and sheets attributes, respectively. This allows you to handle DataFrames with pandas and use the low-level packages to manipulate a single cell or apply some formatting. In the reader case it works like this:
In[53]:withpd.ExcelFile('xl/stores.xlsx',engine='openpyxl')asxlfile:df=pd.read_excel(xlfile,sheet_name='2020')# Get the OpenPyXL workbook objectbook=xlfile.book# From here on, it's OpenPyXL codesheet=book['2019']value=sheet['B3'].value
When writing workbooks, it works analogously:
In[54]:withpd.ExcelWriter('pandas_and_openpyxl.xlsx',engine='openpyxl')aswriter:df=pd.DataFrame({'col1':[1,2,3,4],'col2':[5,6,7,8]})df.to_excel(writer,'Sheet1',startrow=4,startcol=2)# Get the OpenPyXL workbook and sheet objectsbook=writer.booksheet=writer.sheets['Sheet1']# From here on, it's OpenPyXL codesheet['A1'].value='Hello'
These samples use OpenPyXL, but it works the same with the other packages. This technique is convenient if you want to change the formatting of DataFrames in Excel. The easiest way to get complete control over the formatting of the column headers and index column is to simply write them yourself. The following sample gives you an idea of how to do this with OpenPyXL and XlsxWriter, respectively. You can see the output in Figure 5-6. Let’s start by creating a DataFrame:
In[55]:df=pd.DataFrame({'col1':[1,-2],'col2':[-3,4]},index=['row1','row2'])df.index.name='ix'df
Out[55]:col1col2ixrow11-3row2-24
To format the index and headers with OpenPyXL, you can do as follows:
In[56]:# Formatting index/headers with OpenPyXLfromopenpyxl.stylesimportPatternFillwithpd.ExcelWriter('formatting_openpyxl.xlsx',engine='openpyxl')aswriter:# Default formattingdf.to_excel(writer,startrow=0,startcol=0)# Custom formattingstartrow,startcol=0,5df.to_excel(writer,header=False,index=False,startrow=startrow+1,startcol=startcol+1)sheet=writer.sheets['Sheet1']style=PatternFill(fgColor="D9D9D9",fill_type="solid")# Headerfori,colinenumerate(df.columns):sheet.cell(row=startrow+1,column=i+startcol+2,value=col).fill=style# Indexfori,rowinenumerate([df.index.nameifdf.index.nameelseNone]+list(df.index)):sheet.cell(row=i+startrow+1,column=startcol+1,value=row).fill=style
To format the index and headers with XlsxWriter instead, you’ll need to adjust the code slightly:
In[57]:# Formatting index/headers with XlsxWriterwithpd.ExcelWriter('formatting_xlsxwriter.xlsx',engine='xlsxwriter')aswriter:# Default formattingdf.to_excel(writer,startrow=0,startcol=0)# Custom formattingstartrow,startcol=0,5df.to_excel(writer,header=False,index=False,startrow=startrow+1,startcol=startcol+1)book=writer.booksheet=writer.sheets['Sheet1']style=book.add_format({'bg_color':'#D9D9D9'})# Headerfori,colinenumerate(df.columns):sheet.write(startrow,startcol+i+1,col,style)# Indexfori,rowinenumerate([df.index.nameifdf.index.nameelseNone]+list(df.index)):sheet.write(startrow+i,startcol,row,style)
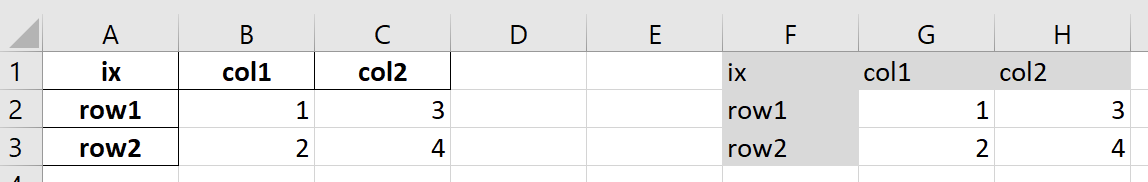
Figure 5-6. A DataFrame with the default format (left) and with a custom format (right)
The possibilities you have to format the data part of a DataFrame depend on the package you’re using: If you write the DataFrame via pandas, OpenPyXL can apply a format to each cell, while XlsxWriter can only apply formats on a row or column basis. For example, to set the number format of the cells to three decimals and center-align the content, you can do the following with OpenPyXL:
In[58]:# Formatting the data part with OpenPyXLfromopenpyxl.stylesimportAlignmentwithpd.ExcelWriter('data_format_openpyxl.xlsx',engine='openpyxl')aswriter:df.to_excel(writer)book=writer.booksheet=writer.sheets['Sheet1']nrows,ncols=df.shapeforrowinrange(nrows):forcolinrange(ncols):cell=sheet.cell(row=row+2,column=col+2)cell.number_format='0.000'cell.alignment=Alignment(horizontal='center')
For XlsxWriter, adjust the code as follows:
In[59]:# Formatting the data part with XlsxWriterwithpd.ExcelWriter('data_format_xlsxwriter.xlsx',engine='xlsxwriter')aswriter:df.to_excel(writer)book=writer.booksheet=writer.sheets['Sheet1']number_format=book.add_format({'num_format':'0.000','align':'center'})sheet.set_column(first_col=1,last_col=2,cell_format=number_format)
As an alternative, pandas offers experimental support for the style property of DataFrames. Experimental means that the syntax can change at any point in time. Styles were primarily made to format the DataFrames in HTML and therefore use CSS syntax. CSS stands for cascading style sheets and is used to define the style of HTML elements. To apply the same format as in the previous example (three decimals and center align), you’ll need to apply a function to every element of a Styler object (via applymap). You get a Styler object via the df.style attribute (the outcome is shown in Figure 5-7):
In[60]:df.style.applymap(lambdax:'number-format: 0.000;''text-align: center').to_excel('styled.xlsx')
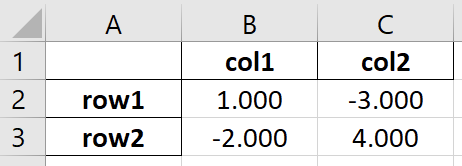
Figure 5-7. A DataFrame formatted using the style attribute (styled.xlsx)
For more details on the DataFrame style approach, please refer directly to the styling docs.
Without having to rely on the style attribute, pandas offers support to format the date and datetime objects like so:
In[61]:df=pd.DataFrame({'A':[dt.date(2020,1,1)],'B':[dt.datetime(2020,1,1,10)]})withpd.ExcelWriter('date.xlsx',date_format='yyyy-mm-dd',datetime_format='yyyy-mm-dd hh:mm:ss')aswriter:df.to_excel(writer)
Now that you know how to format DataFrames in Excel, it’s time to take another stab at the opening case study and see if we can improve the Excel report with the knowledge of this chapter!
Case Study (Revisited): Excel Reporting
Having made it to the end of this chapter, you know enough to be able to go back to the Excel report from the initial case study and make it visually more appealing. If you like, take the code from Example 5-1 and try to turn it into the report as shown in Figure 5-8. The red numbers are sales figures that are below 20,000. I haven’t touched every aspect of formatting in this chapter, so you will have to use the documentation of the package you choose to work with. To compare your solution, I have included two versions of the script that produce this report in Appendix B and in the companion repo. The first version is based on OpenPyXL (sales_report_openpyxl.py) and the other one is based on XlsxWriter (sales_report_xlsxwriter.py). Seeing the scripts side-by-side may also allow you to make a more educated decision about which package you want to pick for your next writer task.
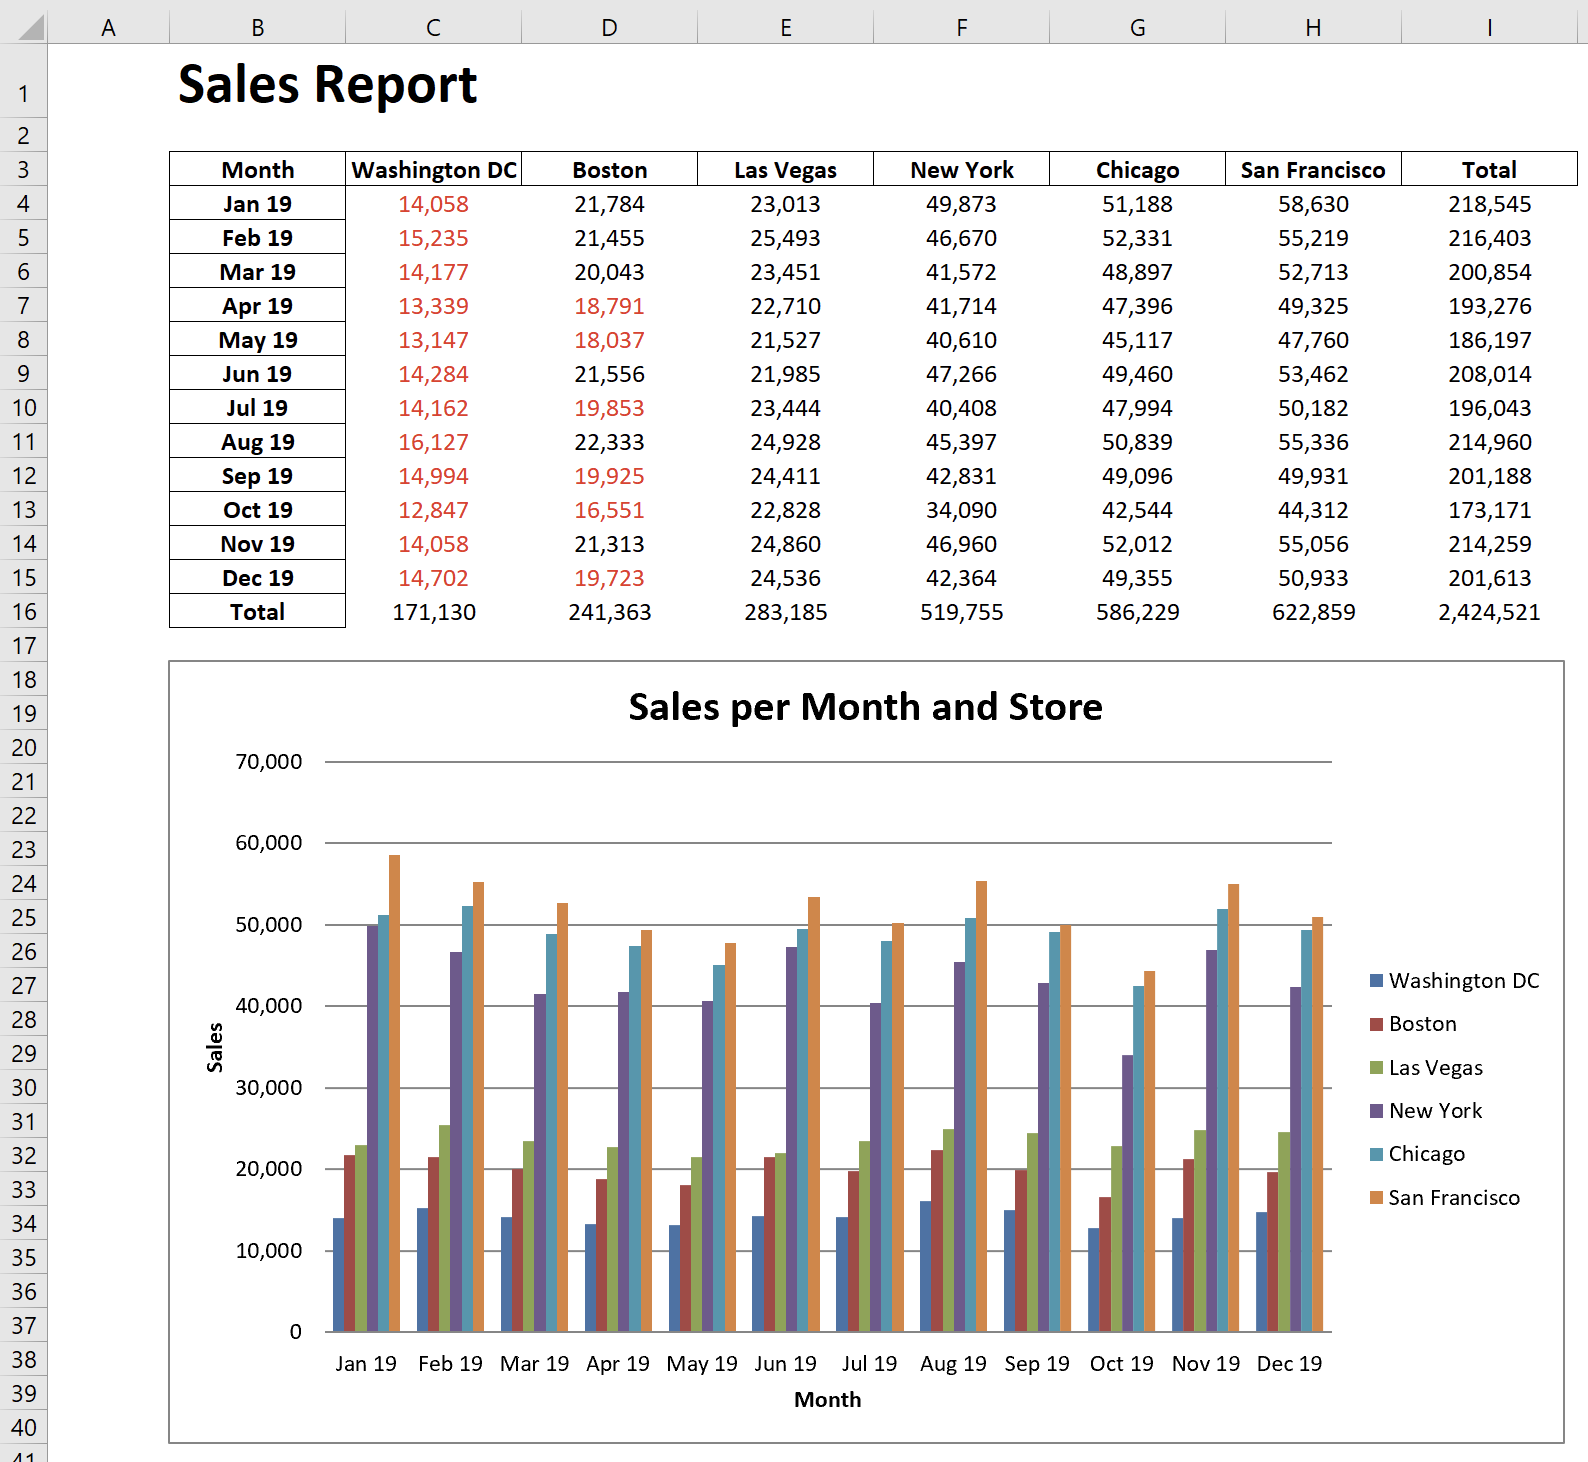
Figure 5-8. The revisited sales report (sales_report_openpyxl.xlsx)
Conclusion
We started this chapter by using pandas’ high-level interface to read a directory of Excel files, aggregate the data and dump the summary into an Excel report—in only ten lines of code. We then moved on and worked directly with the low-level packages that pandas uses under the hood: they allow us to read and write Excel workbooks without having to have pandas installed. However, using them in combination with pandas allows us to enhance the default Excel report by adding titles, charts and formatting. While the current reader and writer packages are incredibly powerful, I still hope that we’ll see a “NumPy moment” one day that unites the effort of all the developers into a single project. It would be great to know which package to use without having to look at a table first and without having to use a different syntax for each type of Excel file. In that sense, I would recommend working with pandas whenever possible and only fall back to the reader and writer packages when you need additional functionality that pandas doesn’t cover.
Excel, however, is so much more than just a data file or a report: the Excel application is one of the most intuitive user interfaces where users can type in a few numbers and get it to display the information they are looking for. Automating the Excel application instead of reading and writing Excel files opens up a whole new range of functionality—how you can drive the automation from Python is the topic of the next chapter.
1 As of pandas 1.1, the default reader is still xlrd, but the switch to OpenPyXL is planned.