
Chapter 3. Tools of the Trade
Graphics programmers have access to a variety of excellent tools to assist in shader authoring, application development, debugging, and asset creation. Happily, many of these are free to use, so you can explore the subject without having to make a large investment. This chapter introduces some of the best tools currently on the market.
Microsoft Visual Studio
Microsoft Visual Studio is an integrated development environment (IDE) for writing software on Microsoft platforms. It supports a large number of programming languages and hardware platforms, including Windows Phone, Xbox 360, and Xbox One. Of particular interest to us is Visual Studio’s support for C++ and HLSL, along with the integrated Visual Studio Graphics Debugger.
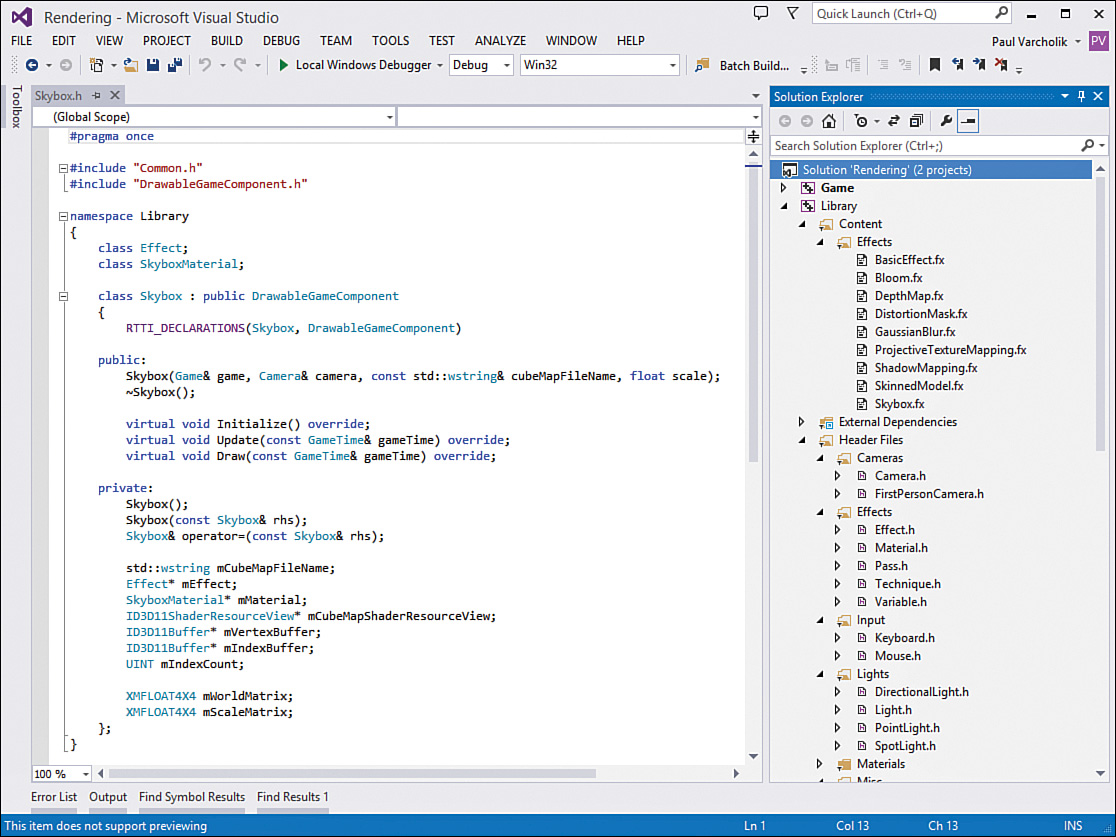
Visual Studio has been evolving since the mid-1990s, and ten major releases have been produced since its inception. The latest version, and what we use in this book, is Visual Studio 2013 (see Figure 3.1). Visual Studio comes in several for-fee editions, with different feature sets. However, Visual Studio Express 2013 for Windows Desktop is a free alternative that provides much of the functionality we’ll be using.
Windows SDK
A full explanation of Visual Studio is beyond the scope of this book, but this section walks you through setting up Visual Studio for work against DirectX 11.1. The first step is to install the Windows SDK. With the release of Windows 8, DirectX is no longer a stand-alone installation, but it has been integrated with the Windows SDK. You can find links to the Windows SDK on this book’s companion website.
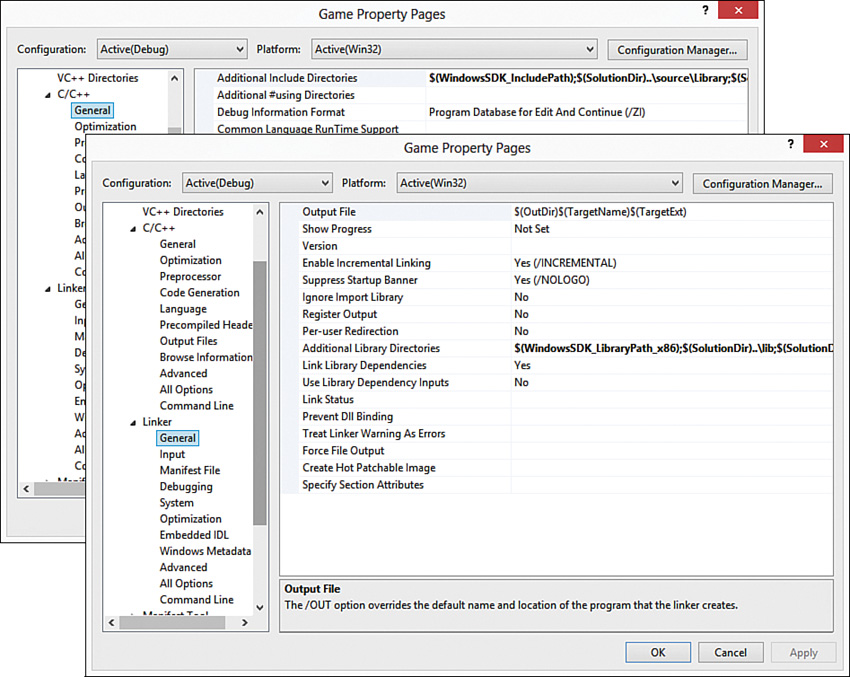
The Windows SDK installation should add location macros for use in your C++ include and library paths—specifically, $(WindowsSDK_IncludePath) and $(WindowsSDK_LibraryPath_x86) for the header and library files, respectively. Be sure these paths are included within your project’s Additional Include/Library Directories settings (see Figure 3.2).
Note
We’ll be using Win32 projects, but the Windows SDK includes x64 versions of the libraries as well. Use the $(WindowsSDK_LibraryPath_x64) macro for x64 builds. Also note that we explore the topic of C++ project setup more thoroughly in Part III, “Rendering with DirectX.”
Effects 11 Library
If you have experience with a previous version of DirectX, you might be familiar with the Direct3D Extension (D3DX) library. This was a utility library that supplemented older versions of DirectX, but it has been deprecated in the Windows SDK. Plenty of useful features of D3DX existed, including a set of interfaces for the effect file format (the format we’re using for our shaders). Thankfully, Microsoft has released replacement libraries for many of the D3DX features, including the Effects 11 library. However, the Effects 11 library isn’t included within the Windows SDK either. As of this writing, the most recent version of the Effects 11 library is version 11.09 (released in January 2014). A link to this revision is available on this book’s companion website.
The Effects 11 library is distributed in source code form, enabling users to customize its behavior. This also implies that you’ll have to build the library before you’ll be able to use it in your projects. A Visual Studio 2013 solution does exist for the library, with configurations for debug and release builds for Win32 and x64 platforms. The output of any of the stock configurations is a static library (Effect11.lib). Part III provides a full treatment of the library.
DirectX Tool Kit
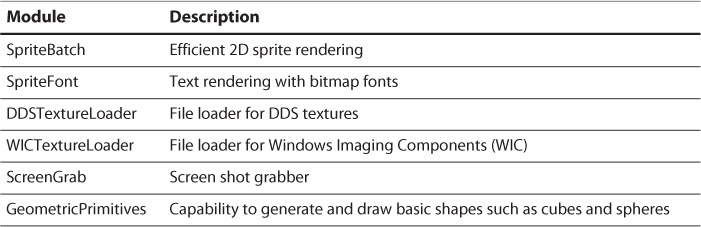
The DirectX Tool Kit (DirectXTK) is another D3DX replacement library that provides a number of useful C++ classes for working with Direct3D 11. Table 3.1 lists a few highlights of the library.
As with the Effects 11 library, source code is provided for DirectXTK with a Visual Studio 2013 solution file. A link to the library is available on this book’s companion website. We cover using several DirectXTK modules in Part III.
![]() DDS, DirectDraw Surface (
DDS, DirectDraw Surface (.dds)
![]() WIC, Windows Imaging Components (native:
WIC, Windows Imaging Components (native: .bmp, .gif, .jpg, .png, .tiff, HD photo)
NVIDIA FX Composer
For gamers and graphics developers, NVIDIA has become a household name. It is credited with coining the term GPU and is a world leader in graphics hardware and software. Among NVIDIA’s contributions to the graphics community is FX Composer, an integrated development environment for authoring shaders. This section introduces this tool—we make extensive use of FX Composer throughout this book.
First, note that writing shaders in HLSL is procedurally similar to writing any other software. Your shader code is stored in simple text files, and any text editor can modify it. Indeed, you might prefer to work outside of FX Composer entirely and write your shaders, for example, within Visual Studio. But using a purpose-built shader-authoring tool such as FX Composer offers a number of advantages, particularly with respect to the immediate visual feedback you receive as you modify your shaders. Furthermore, using a tool such as FX Composer enables you to concentrate on basic shader authoring before diving into the underlying graphics API (such as DirectX). But lest you be concerned about nonportable, tool-specific code, know that the shaders you’ll write using FX Composer will be directly usable by the rendering engine authored in Part III.
FX Composer is a free tool, and you can download it from NVIDIA’s Developer Zone (for the link, see the book’s website). As of this writing, the latest version of FX Composer is 2.5 (specifically, the filename is labeled as 2.53.0524.1905). Figure 3.3 shows the default FX Composer window layout after the creation of a new project.
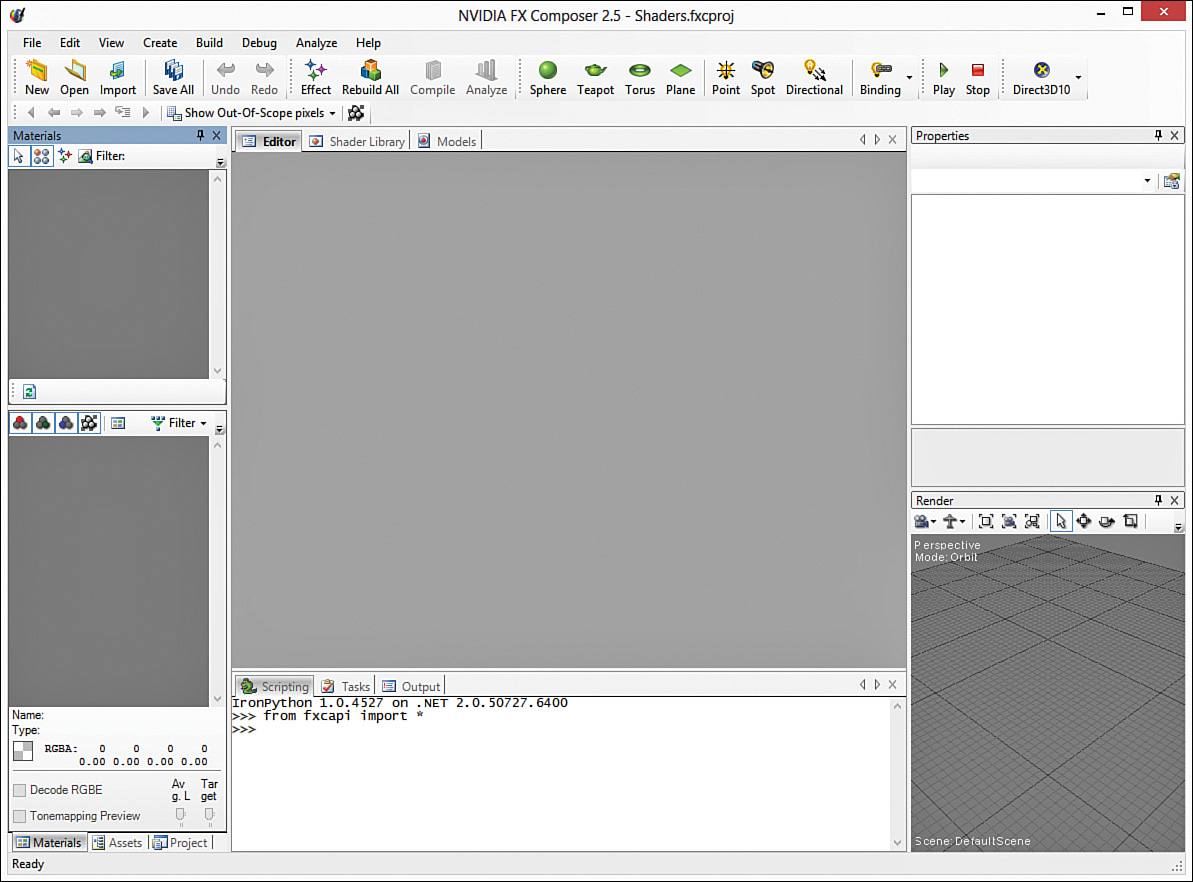
As you can see, the layout is similar to Visual Studio, with resizable, dockable panels. Many of these panels (including the Editor, Properties, and Output panels) are self-explanatory. We need to look at several others.
Effects and Materials
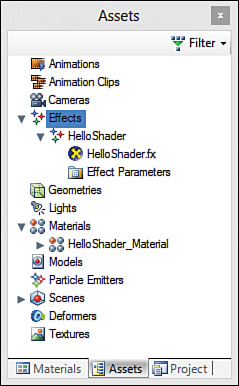
Within the Assets panel (see Figure 3.4), you find headings marked Effects and Materials. An effect represents a file containing your shader code. A material is essentially an instance of an effect with values specified for any variables the shaders expose. Multiple materials can be associated with the same effect.
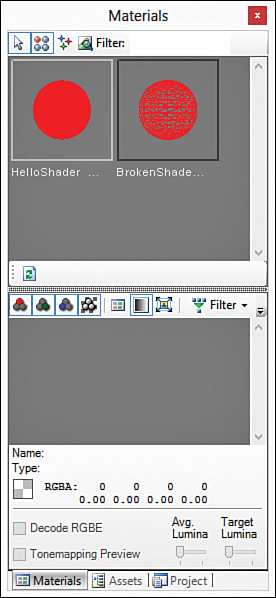
An error-free material (one whose underlying effect compiles correctly) is displayed in the Materials panel as a sphere with a representation of the shader’s rendered output. If the associated effect fails to compile, the sphere appears as a red wireframe (see Figure 3.5). The lower portion of the Materials panel displays any textures assigned to the material.
The Render Panel
By default, the Render panel resides in the lower-right corner. This panel presents the output of your shaders applied to geometry in a scene (see Figure 3.6). For such objects, you can use any of the prebuilt model buttons in the main toolbar (Sphere, Teapot, Torus, and Plane), or you can import your own custom geometry. To import a model, choose File, Import from the menu or click the Import button from the toolbar. You can include as many models in a scene as you’d like, and you can assign each a different material. To apply a material to an object in the scene, simply drag and drop the material from the Materials panel to the object in the Render panel.
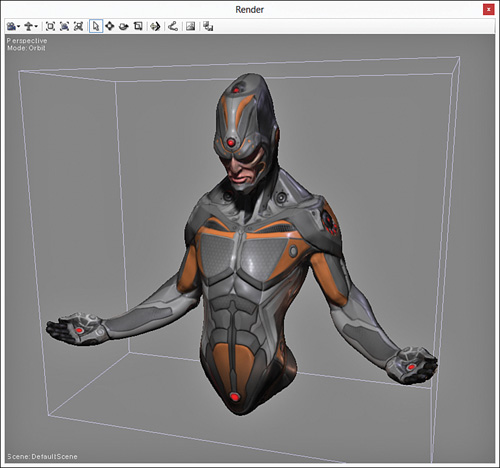
Figure 3.6 NVIDIA FX Composer’s Render panel. (3D Model by Nick Zuccarello, Florida Interactive Entertainment Academy.)
You control the camera presenting the 3D scene within the Render panel using the mouse and keyboard. If you’re familiar with Autodesk Maya (a popular 3D modeling package), the controls are similar. You can select objects in the scene with a left mouse click. With the default Orbit camera, pressing the F key selects a model as the camera’s focus point. Holding the Alt key while left-clicking and dragging the mouse rotates the camera around the object. You hold the Shift key while left-clicking and vertically dragging the mouse to zoom the camera in or out. Alternately, you can zoom the camera with the mouse wheel. To pan the camera, hold the Ctrl key while left-clicking and dragging the mouse.
Along with the camera, you can manipulate objects within the scene. This is accomplished through the mode keys Q, W, E, and R, or their associated toolbar buttons along the top of the Render panel. The Select Object mode (Q) selects an object with a left mouse-click but does not otherwise modify it. Translate Object mode (W) enables you to move the object within the scene. With an object selected in translate mode, axis-aligned control arrows appear at the center of the object. You can translate along a specific axis by dragging the corresponding arrow, or you can translate in free-move mode by dragging the plus icon at the intersection of the three arrows. Rotate Object (E) and Scale Object (R) modes behave in the same way as Translate Object mode.
The Render panel has additional features, including background color customization, a reference grid, trackball and flythrough cameras, and screen capture. I encourage you to experiment with the Render panel to familiarize yourself with these features.
The Textures Panel
The Textures panel (see Figure 3.7) enables you to add and remove textures from the project, assign them to materials, and inspect the details of individual textures. To add textures, click the plus icon in the upper-left corner of the panel, or just drag and drop the textures from Windows Explorer. To assign a texture to a material, you can drag and drop from the Textures panel to an object within the Render panel, or you can specify the variable from within the Properties panel. Double-click an item in the Textures panel to views its details and to preview specific color channels.
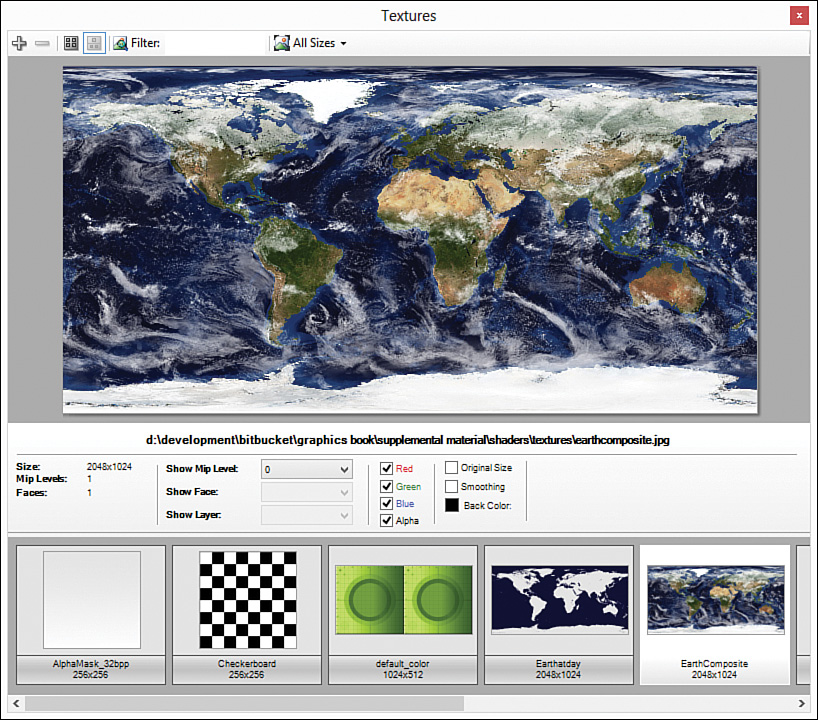
Figure 3.7 NVIDIA FX Composer’s Textures panel. (Original Earth textures from Reto Stöckli, NASA Earth Observatory. Additional texturing by Nick Zuccarello, Florida Interactive Entertainment Academy.)
Note
Assigning textures to a material requires that the associated effect support one or more texture variables. If an effect supports multiple textures, dropping a texture on an object presents a dialog box for selecting the variable to assign.
We discuss this topic further in Chapter 5, “Texture Mapping.”
Visual Studio Graphics Debugger
The Visual Studio Graphics Debugger allows interactive debugging of your custom shaders directly within the Visual Studio 2013 IDE. If you are familiar with older versions of DirectX, you might have worked with the graphics debugger PIX. The Visual Studio Graphics Debugger has replaced PIX but retained the same basic workflow.
Warning
The Visual Studio Graphics Debugger is not available within Visual Studio Express 2013. You must acquire one of the for-fee versions of Visual Studio to work with this tool. No worries, though—you can complete all the work in this book without the aid of the Visual Studio Graphics Debugger.
To launch the debugger, choose Debug, Graphics, Start Diagnostics from the Visual Studio main menu, or press Alt+F5. This launches your application and also opens a Visual Studio tab titled Graphics Experiment.vsglog. Press the Print Screen key to capture diagnostic information for a single frame from your running application. This adds the captured image to the log tab’s frame list, enabling you to capture multiple frames at various points in your application.
Debugging shaders isn’t quite the same as debugging a traditional application. Recall that your shader code executes on, for example, individual vertices and pixels. So you need to specify which pixel you want to debug (which also identifies the pixel’s corresponding primitive). To select a pixel, move your mouse over a captured frame. Notice that the cursor becomes a large red crosshair (see Figure 3.8). Choosing a pixel with the crosshair displays its history in the Graphics Pixel History panel. If you don’t see that panel in your display, choose Debug, Graphics, Pixel History from Visual Studio’s main menu.
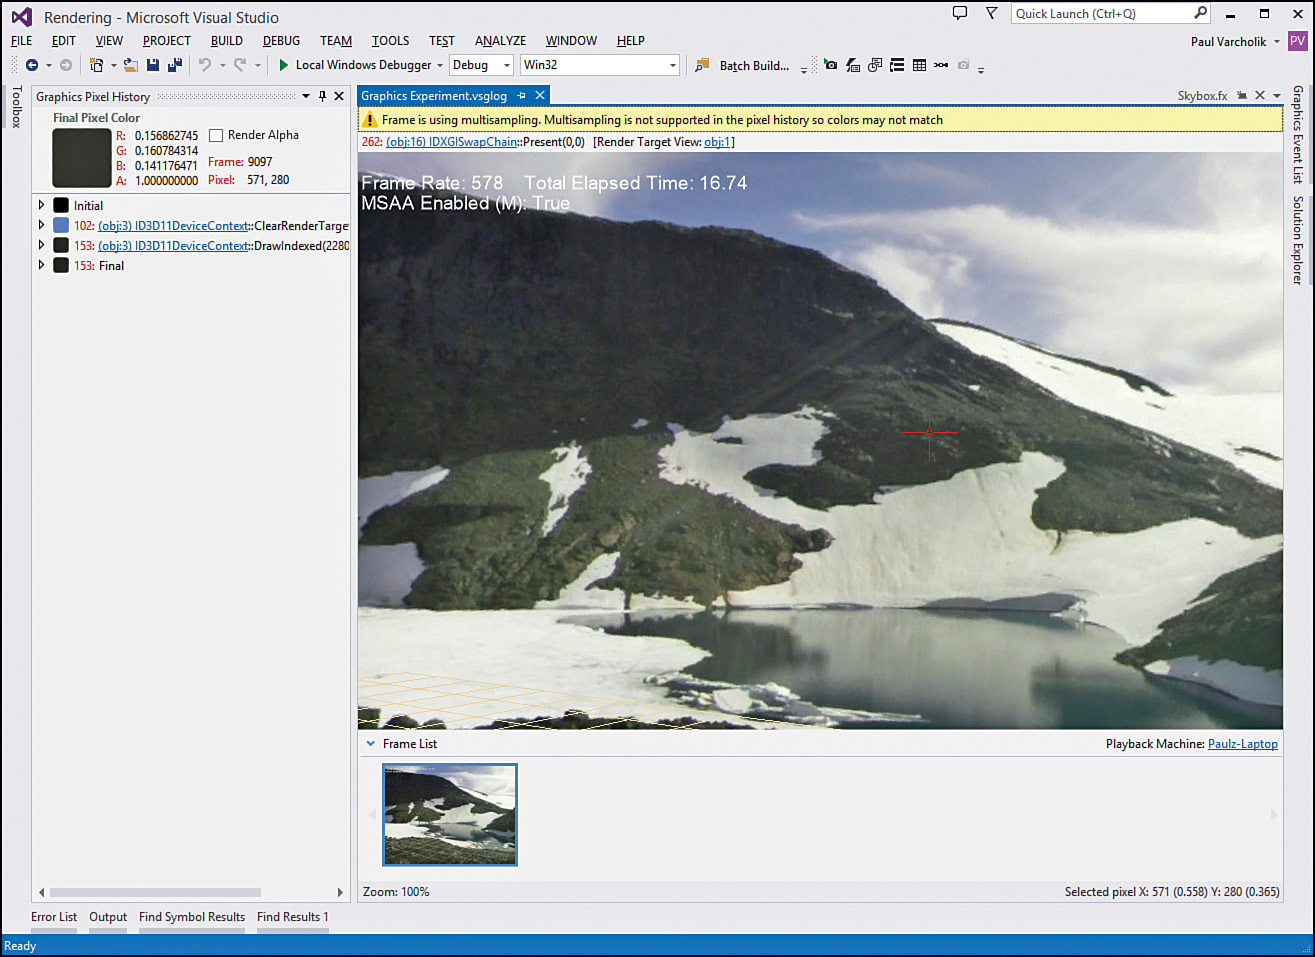
Figure 3.8 The Visual Studio Graphics Debugger log with a pixel selected from a captured frame. (Texture by Emil Persson.)
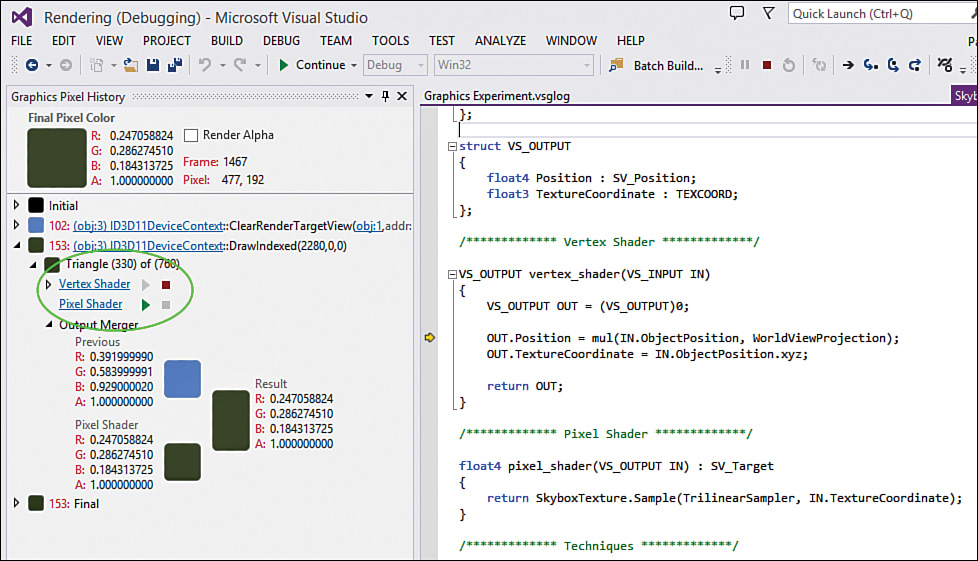
With a pixel selected, you can view any draw calls associated with that pixel in the Graphics Pixel History panel. You can then expand one of those calls for a list of drawn primitives. After you expand a primitive, you see various stages of the graphics pipeline—ones that you’ve provided shaders to—and the output-merger stage. Notice the Play and Stop icons next to the vertex and pixel shader stages in Figure 3.9. Click the Play button next to a shader to begin debugging your shader code. The normal Visual Studio debugging panels (for example, Call Stack, Locals, and Watch windows) are enabled when debugging shaders. The specifics of shader debugging will become clear as we proceed with future chapters.
Note
Don’t close the vsglog tab while the graphics debugger is running if you still intend to capture frames. Closing the tab ends the graphics debugger session; it doesn’t stop the application. The normal Visual Studio debugger takes over, but graphics diagnostics ends until you restart the application by pressing Alt+F5.
Graphics Debugging Alternatives
You might want to explore two alternatives to the Visual Studio Graphics Debugger: GPU PerfStudio 2 by AMD and NVIDIA Nsight Visual Studio Edition. Both products are free and offer compelling feature sets. In particular, GPU PerfStudio 2 is a nice alternative for developers using an Express Edition of Visual Studio because it is a stand-alone tool and is not limited by your choice of IDE. You can find links to these products on the book’s companion website.
Summary
This chapter has provided an overview of the graphics-related tools we’re using in this book. We discussed Visual Studio 2013 and the chief libraries we’re using for DirectX application-side development. We also introduced NVIDIA’s FX Composer for shader authoring. Finally, we looked at the Visual Studio Graphics Debugger for capturing diagnostic information and interactive shader debugging. This chapter marks the end of Part I, “An Introduction to 3D Rendering.” In the next chapter, we dive into the process of authoring shaders.
Exercises
1. Set up your Visual Studio 2013 installation and the libraries discussed in this chapter. Visit the book’s website for links to these resources.
2. Install NVIDIA FX Composer and experiment with the interface. In particular, explore the Render panel to become familiar with the camera controls. Add a sphere, teapot, torus, and plane to the Render panel, and modify them using the mode keys Q, W, E, and R (translate, rotate, and scale).