
7
A Comparative Study of Resources Booms in Papua New Guinea, Indonesia and Nigeria
7.1 Introduction
From time to time, between the early 1970s and the early 1980s, high price levels prevailed for several minerals and primary commodities bringing price instability and sectoral transformation to the economies of some primary commodity-exporting countries. Like PNG, many other agricultural-based small open economies experienced large fluctuations in their external trade as well as in their internal economic environment. Indonesia and Nigeria are two other agricultural-based, primary commodity-exporting countries which experienced a large transfers of wealth, brought about by two major oil booms over 1972–82 (1973–74 and 1979–81). PNG experienced major booms in the same period (construction and mineral boom in 1971–74, and an agricultural commodity boom in 1976–77 which continued in another mineral boom during the 1978–79 period).
This chapter examines whether the divergent economic performance of these countries was the result of unequal magnitude of the resources booms, or the different policy measures adopted and implemented by the respective governments.
Although these countries are quite heterogeneous in terms of size, population, and stages of development, they possess many similar economic characteristics, resembling each other in their agricultural base and abundance of mineral resources. They are also comparable in terms of significant agricultural and primary sectors, which, in each case, provide the chief source of non-mineral exports. The main differences over the study period lie in their macroeconomic policies and the impact of these policies on real exchange rates, sectoral transformation and long-term savings and investment behaviour.
The organisation of this chapter is as follows: Section 7.2 briefly discusses the nature and magnitude of the oil booms in Indonesia and Nigeria during 1972-82. Section 7.3 provides a description of policy responses by the Indonesian and Nigerian governments. Section 7.4 presents a comparative study of the oil booms in Indonesia and Nigeria with that of the resources booms in PNG, and attempts to compare the magnitude of the booms and the different policy measures adopted in response. This section also analyses the effects of these booms on domestic inflation, real exchange rates and employment and wages movements and provides a brief discussion on the sectoral transformation of these economies over the boom years. Section 7.5 summarises the findings of the comparative study and draws conclusions.
7.2 Mineral and Oil Booms in PNG, Indonesia and Nigeria: 1972–82
PNG, Indonesia and Nigeria all experienced several short-lived booms over the period 1970–82, of which two major booms are particularly notable in terms of their enormous impact on sectoral changes within these economies. During the period, 1973–74, the dramatic rise in the world price of oil and minerals brought resources boom in PNG, Indonesia and Nigeria. The first oil boom was experienced by Indonesia and Nigeria in early 1974 after the world real oil price began to rise in 1973. The world real price of oil quadrupled in 1974 from its 1971/72 level and remained relatively constant over the next five years.
Nigeria experienced a large quantitative rise in the production of oil from 1970. Gelb (1988) estimated the windfall (counting both quantity and prices as windfall) at about 23 per cent of non-mining GDP for Nigeria and 16 per cent for Indonesia between 1974 and 1978.
As has been discussed in Chapter 6, PNG also experienced a major mineral boom during 1973–74. In 1974 the export unit value index of copper concentrates increased by 89 per cent from its 1972 level and the export value of copper concentrates accounted for 68 per cent of PNG’s total merchandise export receipts. PNG’s mineral export earning rose from 3 per cent of GDP in the financial year 1972/73 to 30 per cent in 1974. It is worth noting that the share of mineral production rose dramatically in PNG, compared with Indonesia and Nigeria.
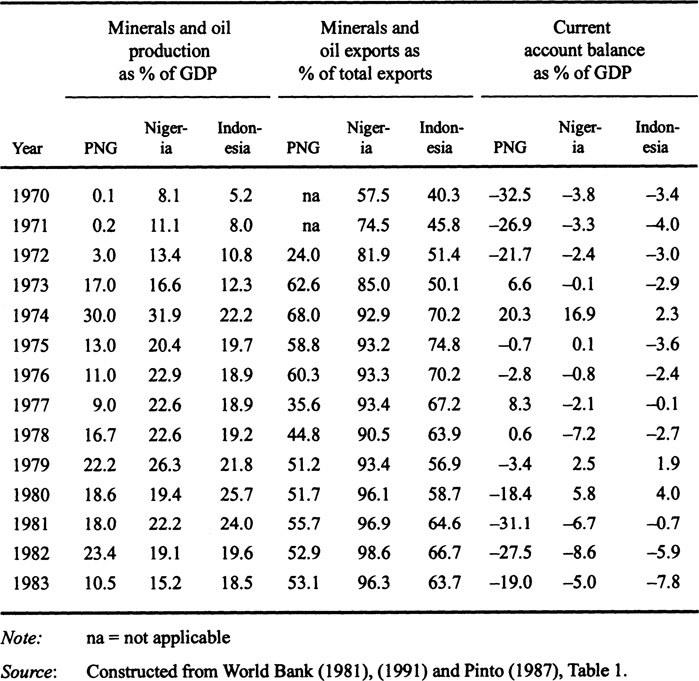
A second boom resulted when the real price of oil increased by a further 50 per cent in 1979 with another 50-per-cent increase in 1980, before peaking in 1981 at more than six hundred per cent higher than the 1971/72 levels.1 The volume of Nigeria’s oil exports increased by 50 per cent and the value of oil exports accounted for 97 per cent of total export value in 1981.2 Indonesian oil production increased 10 per cent between 1979 and 1981 in volume terms and the export value of oil accounted for 65 per cent of total exports in 1981. Indonesian petroleum output rose by 490 per cent in US dollar terms and the unit value of petroleum rose by 350 per cent in real terms over the period 1972–82. The importance of oil in Indonesia and Nigeria and minerals (copper, silver and gold) in PNG is shown in Table 7.1.
During 1976–77, PNG also experienced an agricultural boom as discussed in detail in Chapter 6. PNG’s export of non-fuel primary commodities contributed 90 per cent of export earnings in 1977 due to an increase in export volumes of agricultural cash crops (coffee, cocoa, copra, tea, etc) brought about by favourable world market prices. PNG’s export unit value indices for coffee, cocoa and copra increased by 320,160, and 62 per cent from 1975 to 1977.
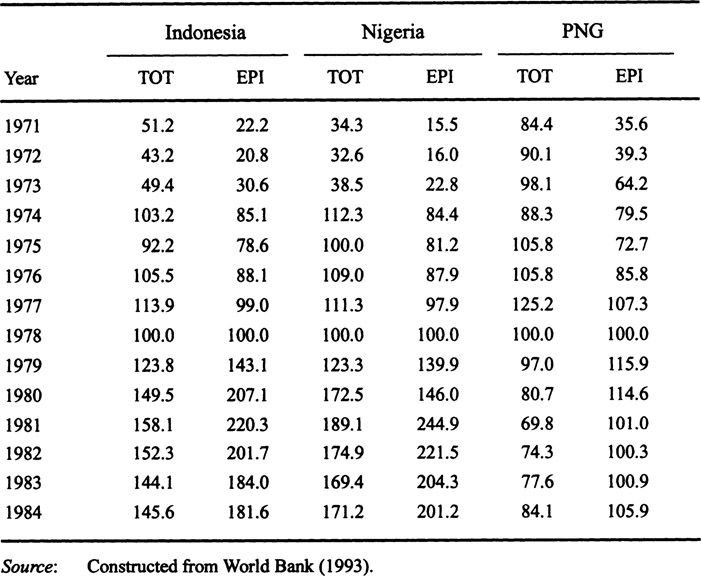
All these three countries experienced a positive terms of trade shock over the decade. The TOT increased by 139 per cent for Indonesia and 245 per cent for
Table 7.1 Minerals and oil production, exports, and the current account balances in PNG, Nigeria and Indonesia, 1970–83
Nigeria between 1972 and 1974. Export price indices also rose, by 309 per cent and 429 per cent for Indonesia and Nigeria respectively over the period. This sharp increase in the export price index and terms of trade brought about impressive increases in national income for both countries. Gross domestic product was 70 per cent higher in Indonesia and 55 per cent higher in Nigeria in 1974 than it was in 1970. Indonesia’s TOT increased a further 58 per cent in 1981 over its 1978 level with a 121-per-cent increase in the export price index over the period and Nigeria’s TOT increased by 89 per cent and the export price index by 145 per cent. PNG’s TOT increased by 16 per cent and its export price index by 80 per cent between 1971 and 1973. During PNG’s agricultural boom in 1977, TOT increased by 18 per cent with a 48-per-cent increase in the export price index compared with the 1975 levels.
Table 7.2 Terms of trade and export price indices in PNG, Indonesia and Nigeria (1978=100)
PNG experienced another boom in the petroleum and mineral sector over 1992 and 1993 which attributed for the largest contribution by this sector to the country’s export revenue and GDP growth. In 1993, the petroleum and mineral sector accounted for 30 per cent of GDP and contributed 70 per cent to total exports. A detailed discussion of this boom appears in Chapter 6.
7.3 Policy Responses: Indonesia and Nigeria
In this section various macroeconomic policy measures adopted by the governments of Indonesia and Nigeria, are analysed, such as fiscal, exchange rate and trade policies, together with their crucial role in determining structural change within these two economies.
Fiscal policy
The composition and timing of government spending are very important as windfall revenue from a resources boom accrues to the government through direct sales, royalties and taxes. As a result of the oil boom, government revenue in Indonesia increased from 11 per cent of GDP in 1970 to 32 per cent in 1974. Government revenue accounted for 24.4 per cent of GDP in 1981 and then fell to 21 per cent of GDP in 1982. Oil and gas was responsible for nearly 33 per cent of total government revenue in 1973–74, over 50 per cent in 1979–80 and 62 per cent at its peak in 1981–82. Government expenditure increased by 29 per cent in 1974 from its 1973 level and by a further 63 per cent in 1981 from its 1978 level. The budget deficit increased 10 times between 1970 and 1982 in absolute terms, but the budget deficit to GDP declined from 2.0 per cent in 1972 to 1.9 per cent in 1982.
Development expenditure
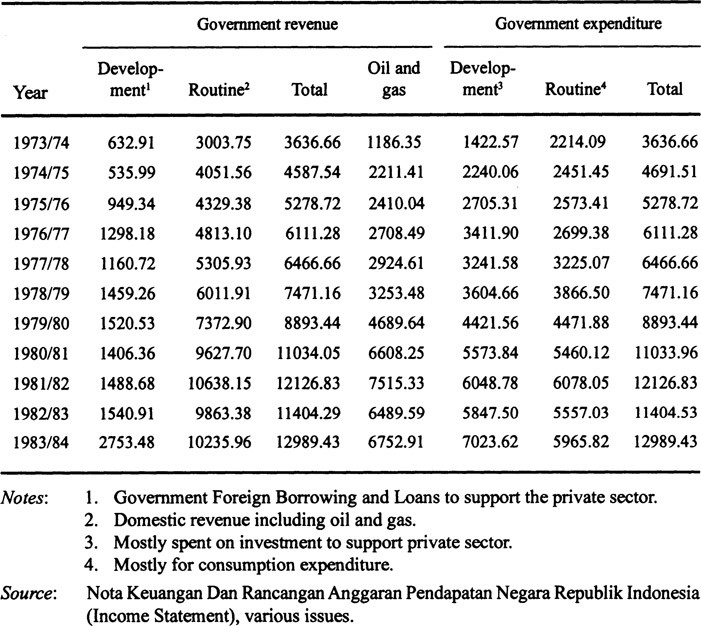
During the boom years the share of development expenditure (capital expenditure spent mostly on investment to support the private sector) to total expenditure increased from 48 per cent in 1973–74 to around 50 per cent in 1981–82 (Table 7.3). Though the share of development expenditure in the agricultural sector declined moderately in 1982 from its 1972 level, absolute government spending on agriculture increased from 16 per cent in 1972 to 22 per cent of total expenditure in 1982. After it was forced to import a large quantity of rice in 1973 at a time of high world prices the Indonesian government was committed to rapid development of the rice sector and the achievement of rice self-sufficiency. Through rapid increases in rice yield, rice production grew by 4.2 per cent per year from 1968 to 1978, and by6.7 per cent from 1978 to 1984.
The commodity board, BULOG, adopted a pricing policy for agriculture to stabilise the price of rice and ensure the prices for agricultural exports moved in line with international price trends. The main policy emphasis of BULOG was to increase rice production together with increased investment in irrigation, research and extension, credit programme and subsidisation of major inputs and fertiliser (Pinto, 1987). As a result, the agricultural sector gained self-sufficiency in rice and was also able to increase its production of cash crops, like rubber, coffee, tea and spices, over the oil boom period. Even though the effective rate of manufacturing protection penalised the agricultural export sector by 11 per cent, the production of agricultural output increased substantially in absolute terms, and the agricultural price level was moving slightly higher than the general price level over the 1970s (Scherr, 1989).
In an attempt to strengthen the infrastructure of the economy and diversify exports from oil to non-oil commodities, the Indonesian government substantially increased development expenditure on education and training, roads and construction and health and family planning – from 63 per cent of total expenditure in 1969–70 to 74 per cent in 1982–83.
Table 7.3 Real government revenue and expenditure of Indonesia (at constant 1980 prices, billion Rupiah)
7.3.2 Trade Policy
During the early 1960s, there were extensive barriers to international trade in Indonesia. Apart from establishing a unified exchange rate, Soeharto’s ‘New Order’ regime moved decisively towards more open trade policies between 1967 and 1971. From then until the mid-1980s, Indonesia’s trade regime again became increasingly inward-oriented as the government taxed or banned some traditional exports, pursued its goal of self-sufficiency in rice and invested a large share of oil revenue to set up import-substituting manufacturing industries. The primary instrument of trade protection was a high and disparate tariff structure. Import tariffs became the major form of protection from the early 1970s and over the 1976–78 period the average tariff rate on manufactured imported items was about 66 per cent. The import competing manufacturing sector also received substantial trade protection in the form of import quotas and direct input subsidies. Import bans reappeared from the early 1970s, especially in the automobile and textiles industries.
In 1970, export taxes and import duties constituted about 37 per cent of non-oil domestic revenue (Hill, 1996). Table 7.4 summarises protection estimates by several authors. It is apparent that the effective rate of protection for importables increased over 1971–84 whereas all studies found negative protection for exportables over the period. The trade regime became more restrictive during 1982–85. After the second oil boom, as a result of steady decline in Indonesia’s commodity exports and the adverse effects of the world recession on the Indonesian economy.
Tariff protection was supplemented by a proliferation of non-tariff barrier (NTBs) in the form of restrictive licences. In addition, export restrictions in the form of bans; taxes and quotas were implemented for unprocessed agricultural commodities. During 1980, bans on log exports were introduced in stages and all log exports were banned after 1985. Little et al. (1993) found that during the tight trade regime of 1983–84 Indonesian imports fell by 11 per cent and trade tax revenue by 7 per cent.
Table 7.4 Estimates of effective rates of protection of Indonesia (per cent)
| Pitt 1971 | World Bank 1975 | Parker 1984 | |
|
|
|||
| All tradables | 33 | 30 | 133 |
| Exportables | −11 | −2 | −4 |
| Importables: | 66 | 58 | 224 |
| import competing | na | 61 | na |
| non-import competing | 15 | 9 | na |
| Sub-sectors: | |||
| cigarettes | 556 | 4 | na |
| sugar refining | 154 | −9 | 141 |
| weaving | NVA | 192 | 589 |
| motor vehicles | 526 | 718 | 2948 |
Notes: These series are generally not directly comparable except where the same author or methodology is involved. NVA indicates negative value added at international prices, na indicates there were no estimates presented for this category.
Source: Hill (1996), Table 6.8, p. 112.
7.3.3 Exchange Rate Policy
The aim of the exchange rate policy was to maintain the Indonesia’s external competitiveness, and this was achieved by a series of nominal devaluations in a situation of rising domestic inflation. The most noticeable macroeconomic policy undertaken by the Indonesian government was two massive currency devaluations in 1978 and 1983.
Over 1971–78, Indonesia’s nominal exchange rate was pegged to the American dollar. As the government spent most of its windfall revenue domestically, the money supply increased by 30 per cent in 1974. This led to high domestic inflation and a subseqcent appreciation of the real exchange rate. In November 1978, to reverse the erosion of competitiveness in its non-oil sector Indonesia devalued its currency by 50 per cent and changed the exchange rate system from a fixed to a flexible regime.
As a result, the real exchange rate depreciated significantly. As pointed out by Warr (1986), following the devaluation, the index of tradables to nontradables price ratio reached a peak (real depreciation) after 3 to 5 months, indicating a substantial rise in the tradable sector’s competitiveness. There was a sharp increase in nonoil exports in 1977. But the second oil shock during 1979-81 led to monetary expansion, and increased inflation. Thus, the effects of the devaluation were eroded by domestic inflation and then wiped out by late 1982 (Arndt and Sundrum, 1984). In March 1983, Indonesia devalued its currency again by 38 per cent in an attempt to stimulate non-mining exports, and combat high inflation and low TOT.
7.3.4 Nigeria
Fiscal policy
During the two oil booms, government revenue in Nigeria increased substantially from only 11 per cent of non-mining GDP in 1970, to 41 per cent in 1974 and 37 per cent in 1981. Both current and capital expenditure also showed an increasing trend over the period 1974–82. Capital expenditure accelerated rapidly from only 3.6 per cent of non-mining GDP in 1970 to 18 per cent in 1974 and 43 per cent by 1982. Current expenditure accounted for 11.6 per cent of non-mining GDP in 1974 and 21.1 per cent in 1981 (Table 7.5). As a result Nigeria’s budget surplus of 6 per cent of GDP in 1974 turned into a budget deficit of 8 per cent in 1982.
Development expenditure
Spending on agriculture and rural development rose from 3–5 per cent of GDP in 1970 to 9–10 per cent in 1982 (World Bank, 1985). Import subsidies for agriculture were quite generous, at around 50 per cent for tractors and 85 per cent for fertilisers. But the share of government real expenditure for tree crop production, processing and marketing declined markedly. Most of the capital intensive and large-scale projects that dominated the agricultural development programme turned out to be inefficient, drawing resources away from smallholders. Some benefited from the fertiliser subsidies, but there were no definite subsidy programmes for the dominant food crop sector provided by smallholders (Scherr, 1989).
Nigeria’s public capital spending was geared towards the nontradable sector and the transport and communications sector received a large rise in public funding allocation. Other public spending on infrastructure was also directed to the urban population. Capital spending on education increased sharply, from 3.9 per cent of total spending in 1973/74 to 18.2 per cent in 1975/76. Increased investment in buildings, and roads, as well as schools, led to another boom in the construction sector.
The services and construction sectors’ value added increased from the 1974 level by about 30 per cent in 1976 and 48 per cent in 1982. Public investment spending on heavy manufacturing increased rapidly after the decision to build a steel industry in the late 1970s.
7.3.5 Trade Policy
Table 7.5 Federal budget of Nigeria, 1970–82 (percentage of non-mining GDP)

Trade policy in Nigeria has traditionally protected local manufacturing industries by imposing relatively high tariffs and import duties. Domestic manufacturing received high levels of protection and artificially expanded production assisted by prohibitive tariffs and other quantitative import restrictions, price controls and subsidies which acted as incentives to the sector. Overall, these policies made the manufacturing sector behave as a nontradable sector at the margin. At the end of the first oil boom, particularly when oil exports tended to fall, Nigerian authorities decided to tighten import restrictions via increasing tariffs and quantitative restrictions on imports.
Gelb (1988) shows the net effective rate of protection for consumer goods rose from 55.8 to 124.9 per cent between 1977 and 1980. The share of manufacturing in GDP increased by more than 9 per cent in 1981–83. But after the collapse of the oil price, together with reductions in tariffs and dismantling of quantitative restrictions in 1986, the share of the manufacturing sector in GDP fell substantially.
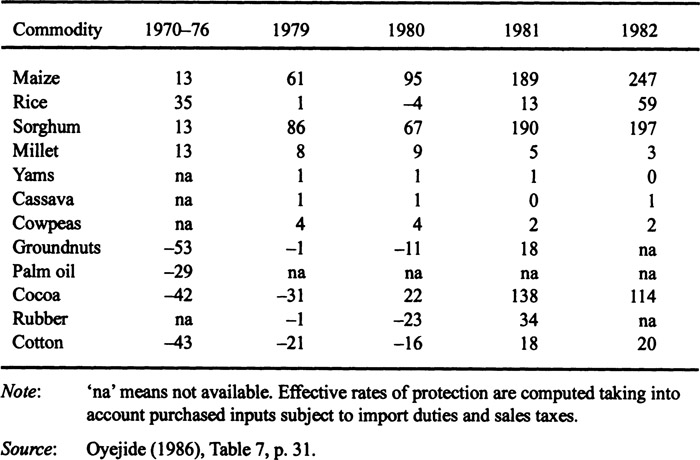
Trade protection for agriculture has been highly erratic and inconsistent, and mainly in response to foreign exchange availability, rather than a systematic policy of protection. The government tried to increase agricultural production by giving producers higher price incentives. Between 1974–81, producers’ prices doubled for many agricultural commodities but agricultural production did not increase as was expected. In spite of an increase in agricultural protection in the early 1980s, agricultural crops generally received less protection than the manufacturing sector, and, within the agricultural sector, export crops received less protection than food crops (Table 7.6). As a result, the agricultural sector as a whole contracted sharply.
Table 7.6 Effective rates of protection for selected agricultural crops in Nigeria (per cent)
The more pervasive effects of protection impacted upon the real exchange rate. Given industrial protection, the real exchange that maintains external balance was lower than the equilibrium real rate that would have prevailed otherwise. In the absence of import restrictions, food grains are considered to be potentially tradable. Collier (1988) pointed out the production of food grains declined during the oil boom but food prices rose relative to the price of nontradables. He termed this phenomenon the ‘Nigerian disease’, since the standard theory of ‘Dutch disease’ could not explain the decline of the food grain sector at a time of high prices for them. The spending effects of the oil boom raised the demand for food grains, but the production of food grains declined relative to the labour force. This paradoxical outcome is explained by Collier (1988) as the result of a massive rural labour migration to the cities induced by higher public sector demand for labour, which contracted food production and increased its relative price.
7.3.6 Exchange Rate Policy
Nigeria’s exchange rate policy appears to have focused on maintaining a relatively stable nominal exchange rate over the period from the 1970s to the mid-1980s. In 1973, an ad hoc devaluation of the Naira brought a small adjustment to the exchange rate. However, during 1974–78, the Central Bank of Nigeria adopted a strategy of gradual nominal appreciation of the Naira against the US dollar and British pound sterling, primarily with the aim of maintaining the country’s balance of payments situation. Nigeria also discounted the important contribution of the agricultural sector. Nigeria did not devalue its currency until the mid-1980s, on the premise that cheap imports were essential to political stability and that the expected economic benefits of higher agricultural exports were insignificant (Oyejide, 1986).
7.4 Comparative Studies of Resources Booms
For the purpose of a comparative study the key economic indicators for Indonesia, Nigeria and PNG are summarised in Table 7.7.
7.4.1 The Magnitude of Booms
To begin with the mineral sectors’ contribution to GDP - PNG’s mineral sector’s share to GDP increased dramatically, from only 0.8 per cent in 1970 to 30 per cent in 1974 (Table 7.7), whereas the contribution of the Indonesian mineral and petroleum sector increased from 12.3 in 1973 to 22.2 per cent to GDP in 1974.
PNGI, PNGII and PNGIII refer to the resources booms in PNG in 1974, 1977 and 1992–93 respectively. INDOI, INDOII and NIGI, NIGII refer to two oil booms in 1974 and 1981–82.
The contribution of Nigeria’s oil production also increased to 32 per cent of GDP
Table 7.7 Comparative economic indicators in PNG, Indonesia and Nigeria

in 1974 compared with 17 per cent in 1973. The swing in PNG’s current account balance was also dramatic in 1974. PNG’s current account surplus accounted for more than 20 per cent of GDP in 1974 compared to 17 per cent for Nigeria and 2.3 per cent for Indonesia. In 1982, while the mineral export share accounted for 75 per cent for Indonesia and 99 per cent for Nigeria, PNG’s mineral sector to GDP and share of mineral export to total export declined substantially.
Indonesian real GDP grew at 8 per cent in 1974 and 8.3 per cent in 1981. The annual average growth rate of per capita GDP was 7.7 per cent between 1970 and 1982. The average annual real GDP growth rate for Nigeria was more than 7 per cent during 1970-80 compared with 4 per cent during the 1950s and 1960s. Nigeria’s real per capita income increased by almost 60 per cent between 1972 and 1974, and by more than 200 per cent between 1972–80. The growth rate of PNG’s real GDP was at around 7 per cent in 1973 and 10 per cent in 1977. PNG achieved reasonably high average annual per capita GDP growth of 5.7 per cent over 1970–80 and 5.5 per cent over 1991–94.
These figures show the order of magnitudes of the resources booms in the three economies, indicating that the magnitude was similar in terms of their impact on exports and overall output of the economy. The next section discusses the different policy measures adopted by the respective governments in response to these booms.
7.4.2 Policy Measures
Since the early 1970s, PNG, Indonesia and Nigeria have all gone through a wide range of policy experiments in the wake of resources booms. This section attempts to compare the various macroeconomic policies adopted by the respective governments and their crucial role in determining structural change and seeks to identify relevant factors that can explain the divergent performances of these three economies.
Fiscal policy
This section compares and contrasts the PNG government’s fiscal policy and domestic demand responses over the boom years with those of Indonesia and Nigeria during the 1970s and early 1980s. As discussed in Chapter 6, after national independence, the main aim of the PNG government was to increase government revenue whilst holding real government spending at a low level to reduce reliance on Australian aid. These policy objectives succeeded to a remarkable degree over the second half of the 1970s.
Government consumption and domestic absorption increased sharply over the decade of the 1970s, both in Indonesia and Nigeria, while PNG maintained relatively more stable levels as indicated by Figure 7.1. Over the period 1970-82, the average annual real growth rate of Indonesian public consumption (11.9 per cent) and public investment (13.7 per cent) were much higher than in PNG and Nigeria. Government consumption increased three fold in PNG, compared with almost 26 times in Indonesia and 10 times in Nigeria (Table Appendix A7.1).
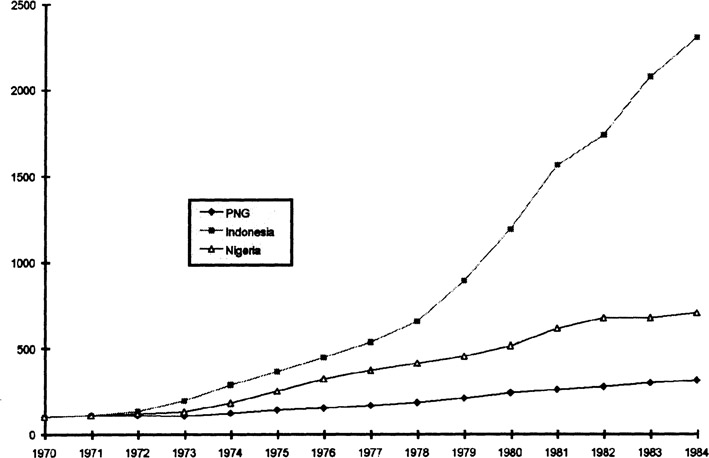
Figure 7.1
Index of real domestic absorption in PNG, Indonesia and Nigeria, 1970-82 (1970=100)
Source: Table Appendix A7.1.
General consumption by the PNG government increased by 73 per cent in 1974 compared to the 1970 level, whereas the Nigerian government increased consumption by 117 per cent, and Indonesia by 187 per cent. The PNG government was successful in reducing consumption levels during the second half of the 1970s by implementing income and wage restraint and by reducing dependency on Australian budgetary support.
Between 1977 and 1982 government consumption increased by 39 per cent in PNG. By contrast, government consumption rose by 262 per cent in Indonesia and 75 per cent in Nigeria from 1977 to 1982.
Real domestic absorption3 increased significantly higher in Indonesia and Nigeria over the period (Figure 7.1). From the 1970 level, the index of domestic absorption increased by 22, 80, and 188 per cent in PNG, Nigeria and Indonesia, respectively, in 1974. In 1977, PNG’s domestic absorption increased by only 38 per cent whereas Indonesia increased domestic absorption by 85 per cent and Nigeria by 106 per cent from the 1974 level. By 1982, domestic absorption had increased a further 226 per cent in Indonesia, and 81 per cent in Nigeria, compared with 65 per cent in PNG.
PNG’s public debt as a ratio of GNP was moderate compared to Indonesia in 1973, but increased sharply in 1982. This increase, caused by a down grading of ore grades at the major copper mines, pushed PNG to borrow in order to cover its current account deficit. PNG’s foreign debt increased by 67 per cent from early 1977 to 1982, while exports revenue increased by only 58 per cent in US dollar terms (Harvey, 1987). While Indonesia’s public debt to GNP fell substantially in 1982 from its 1973 level, the ratio for Nigeria increased moderately over the period, as seen in Table 7.7. In 1982, debt service ratios to total exports were also lower for Indonesia and Nigeria compared with PNG.
However, the PNG government failed to maintain fiscal discipline during the 1990s, and increased agricultural price support schemes and increased defence expenditure for the Bougainville rebellion caused fiscal deficits to explode during the first few years of the 1990s. PNG’s fiscal deficit increased significantly from 1 per cent in 1988 to 5.9 per cent in 1993, with government consumption at K1018 million in 1993. None of the stabilisation funds (MRSF and CPSF) actively restrained government spending. Domestic absorption also increased from K2568 million in 1990 to K4493 million in 1993. Since the budget deficits were financed domestically, the demand for goods and services was satisfied by rising imports, eroding the international reserves of the Central Bank, until a foreign currency crisis emerged in September 1994 when international reserves were almost exhausted (AusAID, 1996). Contractionary policy measures were then successfully implemented by the PNG government, which reduced the budget deficit to 2.3 per cent of GDP in 1994. Radical labour market reform undertaken in 1992 also helped regain price stability and competitiveness to a large extent by the end of 1994.
Exchange rate and trade policy
After monetary independence in 1976, the PNG government undertook a series of revaluations of the nominal exchange rate during the second half of 1970s as discussed in Chapter 6. PNG revalued its exchange rate by 6.5 per cent in 1978, Indonesia and Nigeria devalued their nominal exchange rates in 1973. In 1978 while Indonesia undertook a large devaluation to restore export competitiveness eroded by increased domestic inflation induced by the first oil boom, Nigeria also devalued its currency by 10 per cent (Table 7.8).
Between 1970 and the mid-1980s, there were virtually no trade restriction in PNG and the country was literally a ‘free-trade country’ which helped to keep the domestic price level lower than its major trading partners and prevented erosion of the competitiveness of the export sector. By contrast, both Indonesia and Nigeria followed increasingly restrictive trade policies. Indonesia adopted more protectionist trade policies from the mid-1970s to the mid-1980s and increased protection rates even further after the second oil boom in 1983–84. Nigeria pursued relatively open trade strategies during the 1973–74 period but after the second oil boom reverted towards a more restrictive trade regime during 1980–85.
As a result of the oil price decline in 1982–83, Nigeria faced a large balance of payments crisis, as did Indonesia. In 1983, in the face of this crisis, Indonesia devalued its currency but increased trade restrictions. Nigeria held on to its fixed exchange rate policy and did not devalue its currency until the mid-1980s, when it
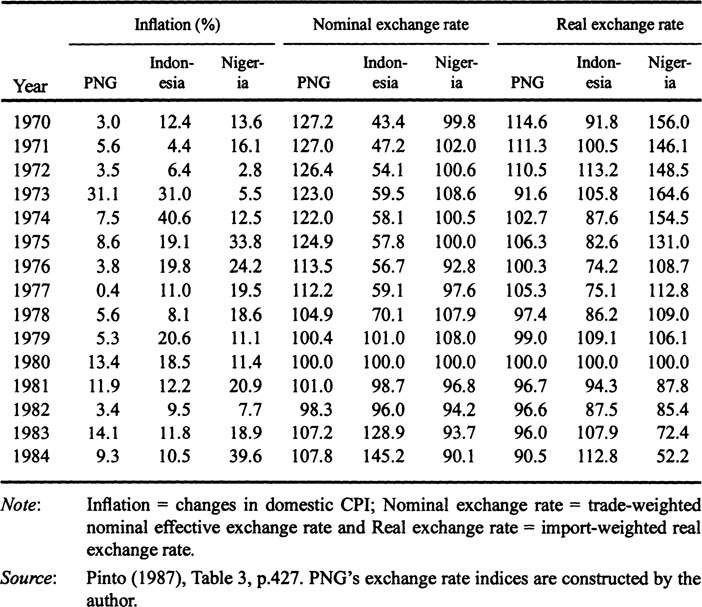
Table 7.8 Import–weighted real exchange rates in PNG, Indonesia and Nigeria (1980=100)
also severely tightened import restriction by a series of quantitative trade restrictions (Little et al., 1993). As a result, resources were diverted from the tradable to nontradable and import-competing sectors, put upward pressure on the domestic price level and rapidly appreciated the real exchange rates of these two countries.
From the mid-1980s, the trade regime of PNG also became more restrictive driven primarily by revenue collection motives. The rise in trade protection was accompanied by higher levels of tariffs, bans on certain food items, import quotas and special privileges for certain industries. This impacted severely on the cost structure of the rest of the economy and had a negative impact on domestic price level and competitiveness of the economy in the world market. This outcome is confirmed by the econometric results in Chapter 4, indicating that the introduction of a restrictive trade regime from the mid-1980s appreciated the real exchange rate of PNG and significantly reduced the competitiveness of both export and import-competing sectors.
The nature of trade policy regimes plays a very important role in determining the outcome of a resources boom and the overall economic performance of a country. The difference in exchange rate and trade policies in these three countries had severe economic ramifications in later years. The next section attempts to analyse the impact of policy measures on the domestic price level and the relative price of tradables to nontradables for these economies.
7.4.3 Comparison of the Effects ofBooms
This section compares how external shocks and government policy measures in these three economies impacted upon domestic price levels, real exchange rates, employment and wages.
Domestic price level
Compared with Indonesia and Nigeria, the impact of the booms on the domestic price level was relatively moderate in PNG. Throughout the period 1970-82, Indonesia’s domestic price level remained higher than its major trading partners, with an average annual rate of inflation at about 16 per cent between 1975-82. In 1978, the GDP deflator had doubled from its 1971 level. The performance of the Nigerian economy was even worse in terms of inflation. The oil booms increased the inflation rate sharply in the mid-1970s as public spending rose dramatically, and the average annual rate of inflation was around 18 per cent between 1975-82 (Table 7.7). The high levels of industrial protection for domestic manufacturing were a major contributor to this rate. PNG’s incomes and wage restraint policies, coupled with a ‘hard kina’ exchange rate policy and a very open trade regime contributed to low inflation over the same period.
A 10-per-cent devaluation of the kina in 1983, coupled with a more inward-looking trade regime was one of the major factors in causing higher domestic inflation from the mid-1980s. Another devaluation in 1990, large fiscal deficits during the first few years of the 1990s, and higher levels of trade protection for selected industries and goods, were mostly responsible for PNG having a higher inflation rate than its trading partners in the first half of the 1990s.
Real exchange rates
The movement of the real exchange rate gives some indication of the competitiveness of the tradable sector and the overall competitiveness of an economy compared with its major trading partners. This section attempts to trace how the various policy responses to the resources booms of the 1970s and early 1980s influenced real exchange rates in PNG, Indonesia and Nigeria.
Table 7.8 compares the import-weighted real exchange rate, nominal exchange rate and domestic price level for these three economies. There is very little difference between import-weighted and trade-weighted real exchange rate indices that were used for the discussion in Chapter 4. Therefore, import-weighted real exchange rate has been used for this comparative study as it excludes the major booming commodities (for example, oil, copper or other primary booming commodities) from the computation and focuses on the non-booming sectors.
The largest real exchange rate erosion was experienced by Nigeria whose real exchange rate doubled by the end of the second oil boom. The real exchange rate for Indonesia also started to appreciate in the wake of the first oil boom. Indonesia’s real exchange rate appreciated by more than 17 per cent in 1974. A large devaluation of the nominal exchange rate in 1978 temporarily helped restore competitiveness of the export sector for the next few years. The real exchange rate again started to appreciate with the second oil boom during 1980-81 and continued to appreciate until another devaluation was undertaken in 1983.
PNG provides an interesting contrast to these two oil-exporting countries. On average PNG’s real exchange rate showed a mild appreciation over the period of 1970–82. The real exchange rate started to appreciate in 1971, reflecting the impact of large foreign capital inflow and subseqcent construction boom, due to establishment of the BCL mine (Table 7.8). High TOT over this period seems to have had a significant income effect on PNG’s real exchange rate behaviour. The real exchange appreciation in 1973 might also have been partially influenced by the ‘Dutch disease’ phenomenon associated with the resources boom in mineral and construction sector with high levels of government consumption. When domestic inflation peaked at around 31 per cent in 1973, the import-weighted real exchange rate appreciated by almost 17 per cent.
Compared with Indonesia and Nigeria PNG’s real exchange rate was relatively stable on average up until the end of the decade (Figure 7.2). After 1973, a very slight appreciation of the real exchange rate is noticeable in 1976 and 1978. It should be pointed out that PNG’s real exchange rate depreciated substantially (about 5 per cent) in 1977 when the economy was at the height of an agricultural commodity boom. PNG’s income and expenditure restraint policy, coupled with a sensible exchange rate policy and an open trade regime, at that time, can claim the full credit for this exceptional improvement of competitiveness of the tradable sector and domestic price stability. In 1981, the real exchange rate appreciated 3 per cent and remained stable until 1984 when it appreciated another 6 per cent, due to higher domestic inflation than PNG’s major trading partners.
Indonesia’s real exchange rate depreciated during 1971–72, mainly because domestic inflation was lower than in its major trading partners. Indonesia’s real exchange rate started to appreciate in 1973 with the oil price hike and had appreciated 18 per cent in 1974. A substantial real appreciation between 1973-77 reflects ‘Dutch disease’ effects associated with the high level of government consumption on the domestic nontradable sector which increased the price of nontradables compared to tradables and reduced non-oil export competitiveness. A 50-per-cent depreciation of the nominal exchange rate in 1978 was mainly responsible for the real exchange rate depreciation between 1978–79. With the surge of the second oil boom, Indonesia’s real exchange rate again started to appreciate in 1980, and continues to erode the competitiveness of non-oil tradable sector up until a second nominal devaluation undertaken in 1983 (Figure 7.2).
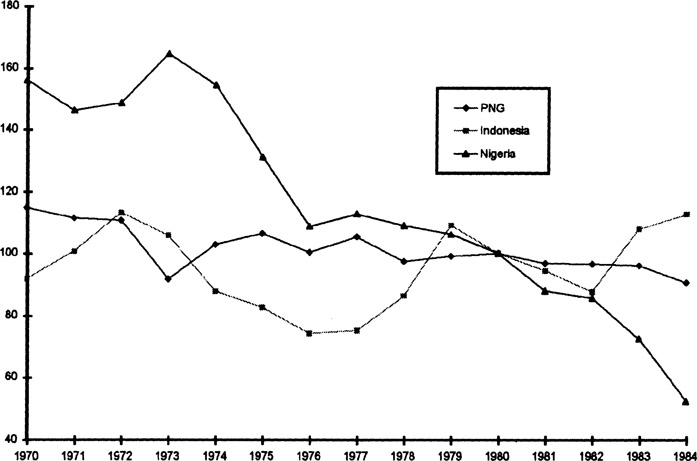
Figure 7.2
Import-weighted real exchange rates in PNG, Indonesia and Nigeria (1980=100)
Source: Table 7.10.
Nigeria’s real exchange rate remained overvalued even before the resources boom in the early 1970s. However, compared with PNG and Indonesia, Nigeria’s inflation rate was low, which ensured the depreciation of Nigeria’s real exchange rate in 1973. As Nigeria started to have a large influx of export earnings associated with the oil boom in 1974, the real exchange rate began to appreciate, and by 1984 had appreciated more than 150 per cent whereas the nominal rate appreciated by only 12 per cent (Table 7.10 and Figure 7.2). This reflects the loss of competitiveness of Nigeria’s tradable and exportable sector with a double-digit inflation rate start continued over the rest of the decade. The over valued real exchange rate substantially reduced productive incentives for Nigeria’s non-oil tradable sector, particularly agriculture. Agricultural export revenue declined from over a billion dollars to less than a hundred million during the years of the oil boom (Taylor et al., 1985).
During the resources boom of the early 1990s, PNG’s fiscal expansion, and a more closed trade regime, impacted adversely on the price of tradables. As the relative price of nontradables to tradables increased substantially during the 1991–93 period, PNG suffered from real exchange appreciation. However, the tradable sector was able to restore competitiveness to a large extent, due to an improvement in world market prices for PNG’s agricultural exports and the government adoption of stricter measures to implement more comprehensive income and wage restraint policies.
Employment and wages
Nigeria’s population is overwhelmingly rural and concentrated in the South. Over 90 per cent of food and export crop production is highly labour intensive and provided by smallholders. From the early 1970s, the major constraint on agricultural production appears to have been a labour shortage, as the rural market was distorted by high opportunities for employment in nearby petroleum activities and other public works, construction and services provided by the state, all offering higher wages.
Oyejide (1986) decomposed the effect of the oil boom on employment into a structural shift and economic growth effect. Table 7.9 indicates that total change in employment in the agricultural sector recorded a small increase. Thus, agriculture had a relative, but not absolute, fall in employment.
Table 7.10 indicates that nominal rural wage increased about five times over the 1970–75 period. As the domestic CPI increased at a much slower rate than the nominal rural wage, the real rural wage rose rapidly over the period, and may have contributed to the decline in relative employment in the rural agricultural sector.
The major overall beneficiary from the oil boom in employment terms was the services sector, which accounted for a 70 per cent rise in employment compared with little more than a 27-per-cent increase in the manufacturing sector. This empirical evidence supports the theoretical proposition of the booming sector that a resources boom shifts employment from the agricultural tradable sectors to the nontradable services sector. The increased employment in manufacturing can be explained
Table 7.9 Sectoral shifts of employment in Nigeria, 1970–82
| Sector | Sectoral shift effect | Economic growth effect | Total change | Percentage change |
|
|
||||
| Agriculture | -5.440 | 5.570 | 0.130 | 1.7 |
| Oil and mining | 0.068 | 0.018 | 0.086 | 1.2 |
| Manufacturing | 0.918 | 1.110 | 2.028 | 27.3 |
| Services | 4.454 | 0.732 | 5.186 | 69.8 |
Source: Oyejide (1986) Table 13, p. 40.
Table 7.10 Minimum wage and rural wage rate indices, 1970–82 (Naira/day, 1970=100)

as quantitative trade restrictions increased the demand for import-competing manufactured goods, as the sector behaved like a nontradable sector at the margin due to high protection.
Since the national minimum wage remained constant, with rising inflation, Nigeria’s national real minimum wage declined significantly over 1970-73 which might have created more opportunities for urban employment. From the mid-1970s, both the national real minimum wage increased rapidly, though the rate of change in wage rates became slower from 1980.
The Indonesian situation was very different. A strong regional labour market and surplus rural labour supply minimised the adverse affects of labour migration out of agriculture. Even at the height of the oil boom, an abundant rural labour supply helped overcome the labour shortage in rice production.
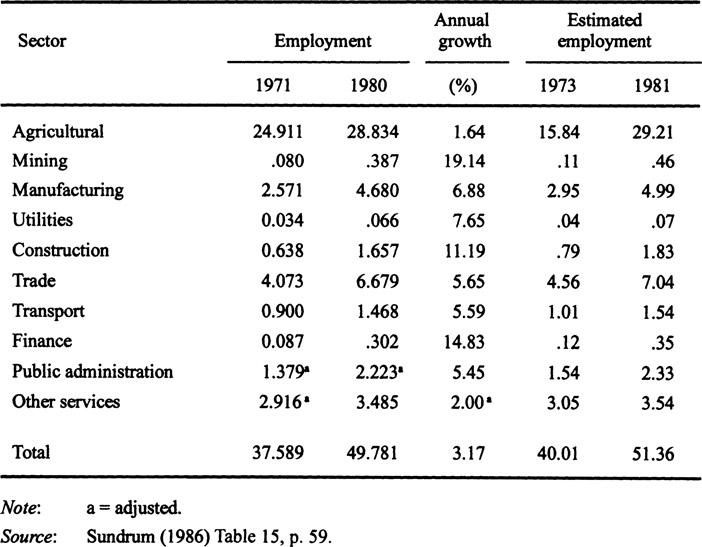
There was no substantial increase in regional wage rates to attract labour from other regional rural production. Technological improvements in agriculture offset the high cost of labour in the labour shortage areas with employment rising by about 2 per cent per annum in the agricultural sector between 1971-81 (Scherr, 1989; Sundrum, 1986). Among other non-mining sectors, the manufacturing and finance sectors accounted for the largest increase in employment both in absolute and relative terms between 1971 and 1981 (Table 7.11). Real wages also followed an increasing trend over the period except for a drop in real wages for 2–3 years following the 1978 devaluation (Warr, 1986). Real wages in manufacturing increased about 56 per cent between 1970–82. The rise in the rural real wage ranged between 3 to 39 per cent over the period (Warr, 1986).
The growth in PNG’s formal employment in the agricultural sector was stagnant between 1970-80 although employment in agriculture increased in absolute terms over the period 1977–79. Since PNG’s labour supply is quite elastic, the booming mining sector did not compete with other traded sectors for labour resources. It was also found that on several occasions, supply of labour to the non-mining sector was complementary rather than competitive with the mining sector’s labour demand (Parsons and Vincent, 1991).
Table 7.11 Indonesian sectoral allocation of employment, 1971–81 (millions)
7.4.4 Sectoral Output Composition
Resources booms over the early 1970s to the early 1980s had an enormous impact on the key macroeconomic variables of these three economies. As discussed in the theoretical framework for this study, a resources boom affects the overall economy through a chain network of interaction among different macroeconomic variables. Increased revenue from a resources boom not only affects the allocation of factors of production, it affects demand and supply conditions in the product market. The flow of windfall revenue affects relative factor prices as well as relative product prices and the real exchange rate. Over time, a resources boom changes the sectoral composition of an economy, through changes in domestic inflation and the relative prices of traded to nontradable goods that create changes in the competitiveness of a sector.
This section compares changes in sectoral composition for these three economies that were affected by the resources booms and government policy responses during the boom years from 1970–82, when the production structure of all three economies underwent a noticeable transformation. The share of the agricultural sector to GDP declined in all three countries to varying degrees. The share of the agricultural sector to GDP declined by 18 per cent in PNG, 45 per cent in Indonesia and 55 per cent in Nigeria from 1970 to 1982.
A tight management structure for macroeconomic policy was quickly established in PNG right after national and monetary independence in 1975. These sound macroeconomic policies made it possible for PNG to reduce the price instability brought about by a large influx of windfall revenue. The share of agriculture improved significantly, from 26 per cent in 1974 to 35 per cent in 1977, before declining to 32 per cent of GDP in 1982, due to depressed world market prices for PNG’s agricultural exports.
Over the period 1970-82, Indonesia was also successful in minimising the adverse effects of oil booms on the agricultural and manufacturing traded sectors. Increased government spending in the agricultural sector maintained steady growth in this sector, especially for food crops, with an average annual growth rate of 3.8 per cent, and a per capita growth rate of 1.5 per cent (Scherr, 1989). The output of rice grew an average of 3.7 per cent in 1977–82 (Gelb and Associates, 1988).
By 1982–83, Indonesia’s food output per capita reached 133 per cent higher compared to 106 per cent for world per capita food output from its 1968-72 level. Though the contribution of agricultural output to GDP declined from 47 per cent in 1970 to 26 per cent in 1982, Indonesia managed to raise the supply of domestic food and agricultural products in absolute terms.
The value of agricultural exports rose compared to food imports, with a ratio of 1 to 0.68 during 1973–81, and total agricultural income also increased substantially (Scherr, 1989).
Most Indonesian manufacturing output was imperfect substitutes (partially traded) for imported goods and behaved as nontradables under quantitative trade restrictions. As a result, despite a large increase in nontradable goods and
Table 7.12 Sectoral composition of GDP in PNG, Indonesia and Nigeria, 1970 and 1982

services during the boom years, Indonesia’s manufacturing sector expanded, due to imperfect substitutability with imported goods. There was also buoyant small-scale sector linking into agricultural income growth and supported by the spread of rural infrastructure (Hill, 1996). Sundrum (1986) explained the rapid growth in manufacturing as a result of rising investment in this sector, together with a sharp rise in demand for these products. Higher levels of consumption spending also helped stimulate the growth of the manufacturing sector.
In contrast, Nigeria’s agricultural performance was dismal over the 1970-82 period. Nigeria’s once diversified commodity export sector declined sharply in the presence of the oil boom. Nigeria’s inward-looking trade regime created several adverse effects for the agricultural traded sector. High import tariffs taxed agricultural exports, by increasing the price of imported agricultural inputs such as machinery, fertiliser and other chemical inputs. Hence, high levels of protection for industry were responsible for reducing the domestic price of agricultural tradables relative to domestic prices of industrial tradables and prices of nontradables. This change in relative prices also had an incentive effect on the labour market, with labour, and other inputs, moving out of agriculture to manufacturing and the nontradable sector over the period. This declining flow of rural labour exerted upward pressure on the rural wage rate, which tripled during 1970–75, thereby increasing the production cost for agricultural exports. A fall in relative output prices and higher relative labour input and other agricultural input prices were also responsible for the fall in profitability of agricultural tradables. Annual production declined by 65 per cent for cotton, 25 per cent for rubber, and 43 per cent for cocoa which brought an average annual 30 per cent decline for export cash crop output over the period (Scherr, 1989). Only the production of palm kernel and palm oil rose, by 30 and 23 per cent, respectively, as this sector was highly protected by the agricultural pricing policy.
Imports of food grains displaced domestic production, depressing Nigeria’s agricultural share in GDP from 49 per cent in 1970 to 22 per cent in 1982. Per capita food production was stagnant and throughout the period total agricultural production declined slowly. The share of the agricultural labour force also declined by 21 per cent over the period (from 75 per cent to 59 per cent of total employment). Agricultural export production declined at an average annual rate of 5.7 per cent between 1968 and 1978 and 7.1 per cent between 1978 and 1984. After 1975, agricultural imports grew significantly, which worsened the balance of payments situation in 1975–76. From being a net exporter of agricultural goods, Nigeria became a net importer.
The mining and oil sectors of all three economies increased substantially. PNG’s mining sector share to GDP increased from 0.8 per cent in 1970 to 30 per cent in 1974 and then declined to 8 per cent in 1982. In the same years, Indonesia’s oil sector share occupied 14 per cent and Nigeria’s 30 per cent which was much higher than the 1970 level.
From 1970 to 1982, the share of the manufacturing sector to GDP rose from 5 to 10 per cent in PNG and from 10 to 16 per cent in Indonesia. But the share of Nigeria’s manufacturing sector to GDP declined from 7 per cent in 1970 to 6 per cent in 1982 (Table 7.12). The contribution of the services sector declined in both PNG and Indonesia in 1982 from the 1970 level but Nigeria’s services sector grew by 38 per cent over the same period, as predicted by the theory of the ‘Dutch disease’ discussed in Chapter 2.
7.5 Summary and Conclusion
This chapter provides a comparative study of the movements of key macroeconomic variables, relative prices, employment and wages and sectoral transformation of PNG, Indonesia and Nigeria in response to resources booms over 1970–82 and also the early 1990s in PNG.
It is found that, although the timing and magnitude of the booms were similar, the outcome was significantly different, due, in the main, to differences in macroeconomic policy responses, particularly those in relation to trade regimes by the respective governments.
Although Indonesia managed the oil booms reasonably well, it performed worse, in terms of government spending and controlling the inflation rate, which was reflected in appreciation of the real exchange rate during the 1972–82 period. Increased spending on domestically produced goods and services, coupled with import restrictions in the form of high tariffs and subsidies, fuelled domestic inflation and exacerbated the real exchange rate appreciation. However, adopting a prudent external borrowing strategy, Indonesia was able to reduce its total debt and debt service ratio below 13 per cent by the end of the 1970s. Indonesia’s development expenditures were more evenly distributed across rural and urban infrastructure, industry, education and social services than in PNG and Nigeria.
Along with the oil shocks, Nigeria also faced several policy-induced shocks. Several micro and macroeconomic policies contributed to a dismal performance for the agricultural sector at a time of high overall GDP growth. Nigeria underwent dramatic sectoral transformation over the period. Supported by high government spending and various forms of trade restrictions, the country’s production structure shifted in favour of the nontradable sector. The agricultural sector was particularly hard hit as this sector received less attention despite its important role in the economy. High levels of inflation compared with major trading partners reduced the competitiveness of the Nigerian tradable sector sharply which was reflected in perpetual real exchange appreciation from 1974.
Compared with Indonesia and Nigeria, PNG managed to maintain stability by the application of conservative macroeconomic policies in the context of an open trade regime. Given the lack of an indigenous capital goods sector, a low level of industrialisation and an insignificant manufacturing sector, resources booms in the 1970s did not adversely affect PNG’s export oriented tradable sector. An appreciating nominal exchange rate reduced the cost of imported capital and intermediate goods over the 1970s. Overheating of the economy was avoided by sensible application of expenditure management and wage restraint policies. This is one of the major reasons PNG was able to maintain a stable price level during and after the boom years in the second half of the 1970s. Compared with Indonesia and Nigeria, PNG’s trade regime was virtually open, which helped reduce pressure on the domestic price level and prevented appreciation of the real exchange rate.
It can be concluded that these three economies were all affected by ‘Dutch disease’ to a varying extent. Nigeria was greatly affected, and showed all the symptoms of the damaging consequences of the ‘disease’ over the years of the oil boom. Indonesia was also affected by ‘Dutch disease’, as it was not able to restrain government spending and the inflation rate at a desirable level over 1970–82. PNG’s prudent macroeconomic policies, including a reduced flow of Australian aid and budgetary grants and an open trade regime, substantially offset the adverse ‘spending effects’ of a resources boom over these years and prevented the economy from falling prey to ‘Dutch disease’.
However, PNG failed to maintain fiscal discipline during the mineral boom in the early 1990s. As well, an increasingly restrictive trade regime was introduced from the mid-1980s, and a continuous fiscal deficit from 1990 added extra pressure on the domestic price level. Domestic political instability in the late 1980s has also contributed to lower production and overall stability of the economy. As a result the real exchange rate appreciated significantly during the 1991–93 period and the economy lost international competitiveness. A radical wages policy reform, undertaken in 1992, together with stricter fiscal and monetary policies, reduced reliance on foreign aid and grants, and the adoption of a floating exchange rate regime improved competitiveness of the country from the end of 1994.
Notes
1 In nominal terms, the price of a barrel of crude oil (OPEC basket) increased from US$1.7 in 1971 to US$34.3 in 1981. By 1986, this price had fallen to US$13.6 per barrel.
2 Nigerian total exports increased from US$2.1 billion in 1972 to US$26 million in 1980. Of these total value of export, oil export revenue accounted for US$25 billion in nominal terms.
3 Private consumption, and general government consumption, plus gross domestic investment.