
6
Impact of Major Resources Booms in Papua New Guinea
6.1 Introduction
This chapter examines the nature and impact of major resources booms and internal policy responses in relation to growth and the sectoral composition of output, and savings behaviour of the PNG economy. Only major positive shocks in the form of resources booms and their consequences on the PNG economy are analysed over the study period of 1970-94. The objective of this discussion is to analyse whether the available empirical evidence of resources booms in PNG substantiates the theoretical predictions of the framework of the study postulated in Chapter 2. This chapter also examines the PNG government’s responses to these resources booms, in the short as well as the long term. Sections 2-9 identify the major resources booms in PNG during the 1970s and the first half of the 1990s, together with overall policy responses, and their sectoral impact on the economic performance of the PNG economy over the past two and a half decades; Section 10 discusses the long-term policy impact on savings and investment behaviour; and Section 11 provides a summary.
6.2 The Major Resources Booms: 1971-77
PNG experienced three major resources booms in the 1970s. The first was an upsurge in investment associated with the construction of the Bougainville Copper Mine, and can be termed as an ‘investment boom’ during the financial years1 1971 and 1972. The Bougainville Copper Mine belongs to Bougainville Copper Ltd. (BCL), a Papua New Guinean mining company, which is 53 per cent owned by Rio Tinto, a company dual-listed in the United Kingdom and Australia. The second boom was a sharp increase in minerals production and exports by the BCL mine which coincided with increasing world copper prices and generated a massive foreign revenue income for the economy during 1973-74. The third boom originated from increased supply from the agricultural and non-mineral exportable sectors induced by higher prices for agricultural commodities during 1976-77.
6.2.1 BCL Investment Boom 1971-72
Construction of the Bougainville Copper Mine brought the first major investment boom to the PNG economy. PNG experienced major foreign capital investment flow in the early 1970s from the Bougainville Copper Project amounting to approximately A$400 million. During the construction period of the Panguna mine of BCL, a massive capital inflow of K223 million in 1971 and K212 million in 1972 was recorded. During these two financial years, BCL accounted for nearly 72 per cent of all fixed capital formation in the country. Thus, 1971 marked the beginning of the BCL investment boom’ as investment in the construction sector grew at the rate of 62 per cent from the previous year’s level.
During the height of BCL construction, the growth rate of gross domestic investment was striking, increasing from 35 per cent of GDP in 1970 to about 47 per cent of GDP in 1971. Total (private and government) consumption increased from K410.0 million in 1968 to K614.5 million in 1972. Export value also increased at a rate of above 26 per cent of GDP in 1971. Imports increased substantially from the previous years and capital goods constituted the major share of imports.
Adjustment towards new economic activities in 1972 was influenced by a number of internal and external factors. Among them, a sharp increase in the world price for major export commodities and a substantial revenue flow from overseas sales of mineral ore by BCL, were the major factors altering the sectoral composition of the PNG economy during this period.
6.2.2 Mineral Boom: 1973-74
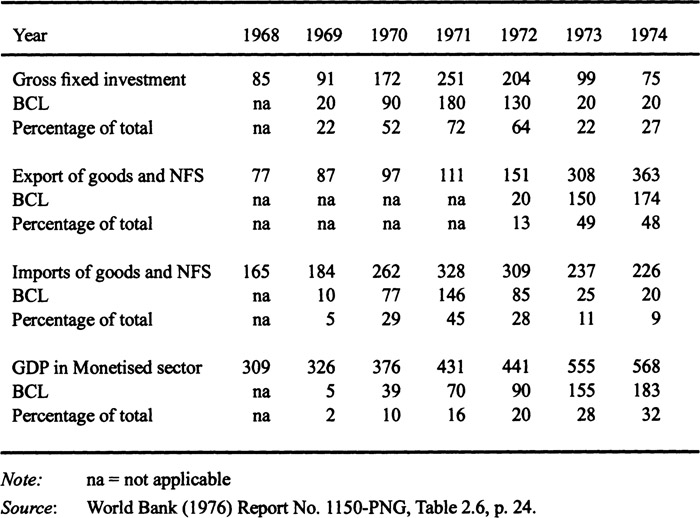
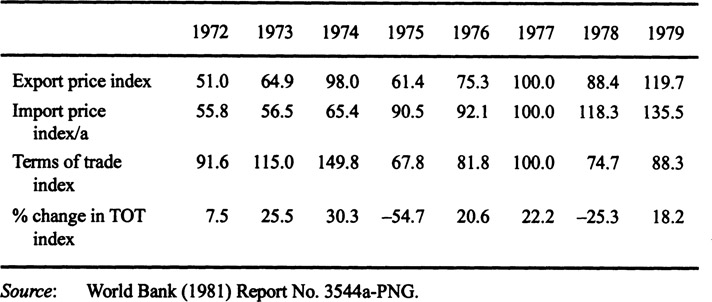
The growth rate of approximately 28 per cent in the monetised sector between 1972 and 1973 was wholly contributed by the increased production of mineral (copper and gold) ore from BCL. The mine came into full production at a time when the world prices for copper and gold were rising. The Bougainville mine contributed about 20 per cent of the monetised sector’s GDP in 1972,28 per cent in 1973 and 32 per cent in 1974 (Table 6.1). The increase in the export price index during 1973 outweighed the increase in the import price index and brought an average annual change in the TOT index of 25.6 per cent and 30.2 per cent in 1973 and 1974, respectively, and contributed significantly to export revenue earnings. Thus, 1973 can be marked as the first ‘mineral boom’ in PNG.
The share of exports to GDP increased significantly after the mine went into production in April 1972. The growth in total export revenue was four-fold over the first four financial years of the 1970s, increasing from K101.7 million in 1971 to K363.5 million in 1974. The BCL mine alone contributed about 50 per cent of total export revenue in 1973. The export value of minerals accounted for 63 per cent of total merchandise export receipts in 1973. The import share of consumer goods, fuels and petroleum also increased rapidly during 1973.
Table 6.1 Bougainville Copper Mine’s impact on monetised sector GDP, 1968–74 (kina million at 1968 constant prices)
6.2.3 Commodity Boom: 1976-77
Another major boom in PNG economy that began after the national independence, in September 1975 and monetary independence in January 1976, can be marked as the ‘agricultural commodity boom’. This boom originated from the increased supply of agricultural and other non-mineral exportable sectors which was supported by favourable world market prices for PNG’s primary commodities. The nature and impact of this boom was substantially different from the other major booms as the effects of this boom demonstrate dissimilar changes in relative prices, sectoral growth and income distribution patterns in PNG.
The pattern of income distribution between PNG nationals and expatriates changed during this boom. Papua New Guineans were the major beneficiaries of this boom as they became the direct recipients of an increasing share of income from cash crops exports. As the majority of the PNG population was involved with the agricultural sector for subsistence, most of cash crops which had been dominated by expatriates before independence were now produced under the ownership of local people. The amount of GDP directly accruing to PNG nationals grew at about 10 per cent per annum, in real terms, between 1973/74 and 1981 (Gamaut and Baxter, 1984, p. 66).
Excluding copper concentrate, the export price index for all commodities greatly increased between late 1976 and early 1978. Table 6.2 indicates that the TOT improved significantly by 20.6 per cent in 1976 and 22.2 per cent in 1977, from a negative 54.7 per cent in 1975. From the September quarter of 1976 the value of PNG’s exports grew strongly, largely attributable to buoyant prices for cash crops, particularly coffee and cocoa. The value of PNG’s exports continued to rise, mainly due to higher volume of coffee exports, together with increases in the volume of copper ore and concentrates and other agricultural export commodities.
During 1976, the export value of coffee increased dramatically to K132.62 million, almost a four-fold increase compared to K33.55 million in 1975. The large export receipts contributed by coffee exports were influenced by the high world market price (the export price index of coffee rose by 189 per cent during 1976) and the higher volume (about 35-per-cent increase from the 1975 level) of coffee exported during this year.
6.3 Policy Response
Since PNG did not achieve national independence until 1975, it could not pursue independent policy fully to counteract any revenue and price instability in the economy brought about by BCL investment and mineral booms between 1971 and 1974. During the first half of the 1970s, PNG relied heavily on budgetary support from Australia to cover the major part of government expenditure since it was part of the Australian monetary system.
The second half of the 1970s will be remembered as the legacy of prudent and successful macroeconomic policy implementation by a PNG government. The
Table 6.2 Trade indices of Papua New Guinea, 1972–79 (1977=100)
following measures considerably reduced the impact of fluctuating world prices and other uncertainties on producers and the budget.
6.3.1 Fiscal Policy
The fiscal response to the ‘investment’ and ‘mineral’ booms in the early 1970s was expansionary. As seen from Table 6.3, government expenditure grew substantially. From 1971 to 1975, current expenditure to GDP increased by 30.3 per cent, dominated by wages and salaries (45 to 50 per cent of total) and purchase of goods and services (35 to 40 per cent of total). Capital expenditure shows a declining trend over the same period.
Total revenue increased from 74.2 million in 1971 to 136.7 in 1974 with a 49-per-cent increase in tax revenue and 235-per-cent increase in non-tax revenue (Appendix Table A6.1). The large increase in government revenue over these four years was contributed mainly by the big boost in income and profit, dividends, and royalties from the operation of the BCL mine. The contribution of personal income tax accounted for 30 per cent, while import duties accounted for 28 per cent of total revenue collection.
As predicted by the booming sector literature, government spending increased shaiply during the boom years. The phenomenal increase in government expenditure increased the demand and price for nontradables and reduced the price of tradables relative to nontradables bringing a real appreciation in PNG’s exchange rate.
To deal with the downturn in the PNG mineral sector in 1973-74, the government established the Mineral Resources Stabilisation Fund (MRSF) in 1974 to smooth out the impact of large export revenue flows on the budget and the domestic price level.
Table 6.3 Central government revenues and expenditures, 1971–77 (percentage share of GDP)

Payments into the MRSF come only from large scale mining projects (until then, only BCL) revenues, with funds subsequently transferred into consolidated revenue to produce a steady flow into each year’s budget.
Between 1975/76 and 1980, the MRSF built up reserves in years of exceptionally large mining revenues (1974 and 1980) and ran them down again in years of exceptionally low revenues (1976 and 1978). In 1978, when mineral related receipts dropped by 60 per cent, the flow of funds out of the MRSF fell by less than half yet still contributed 12 per cent of domestic revenue. The MRSF, as a major policy tool of the PNG government, worked successfully to reduce the instability of the internal economic balance until the late 1980s.
Commodity Price Stabilisation Funds (CPSF) operated by the commodity board for three major export crops (copra, coffee and cocoa) also stabilised the prices along a moving long-term average price trend. At the end of 1980, these funds held K160 million and were preparing to pay bounties to producers to compensate for falling commodity prices.
During the agricultural boom, PNG pursued pragmatic economic policies. During 1976-77, the government implemented reductions in real expenditure. Central government expenditure fell 14 per cent as a share of GDP in 1977, from its 1975 level, as financial management focused on the requirements of stability and a deliberate reduction in Australian aid and budgetary grants. In 1977, capital expenditures rose about 41 per cent from the 1975 level, whereas current expenditures grew only 6 per cent between 1975 and 1977 (Appendix Table A6.1).
Over the 1975-77 period, real public consumption expenditure fell by more than 22 per cent and the total real public expenditure fell by slightly less than 9 per cent. A National Public Expenditure Plan (NPEP) was introduced in 1978 to facilitate careful allocation of increases in government expenditure in the light of national priorities. A target of a 3-per-cent increase in real expenditure for goods and services was implemented successfully during 1978-79. The NPEP was also successful in raising the share of capital expenditure in the budget to about 20 per cent before 1980. The Government’s fiscal revenue effort also increased significantly during the second half of the 1970s. Since independence, every budget had included new sources of revenues and steadily reduced the reliance on Australian budgetary support.
Another noticeable influence on economic stability was the steady reduction of Australian aid since 1976. In 1976, the two governments reached an agreement on a five-year aid package in which Australia undertook a policy to provide a minimum annual grant of A$180 million, with annual supplements to be determined on a year to year basis. This arrangement was a great improvement over the previous system which had sometimes resulted in serious disparities between expected and actual assistance. Between 1975 and 1977 Australian aid fell 17 per cent per annum in US dollar terms (Appendix Table A3.7). The 1976 agreement also opened the way for the development of the NPEP based on a steady growth of government spending. Since the level of aid was specified in Australian dollars, devaluation of the Australian dollar, and several revaluations by PNG, further reduced the value of aid to PNG over the period until 1980.
Overall, real government spending up to 1979 reflected macroeconomic prudence. The econometric investigation of RER determinants in Chapter 4 confirms that a reduction in foreign aid and government expenditure improves the competitiveness of an economy. It is clear that, during 1976-77, tight government budgets and reduced reliance on foreign aid helped maintain a stable domestic price level and prevented RER appreciation.
6.3.2 Monetary Policy
Policy instruments for maintaining a stable monetary system have been strengthened since independence, as the monetised sector expanded and the financial system became more developed.
Under the influence of a large balance of payments surplus, the money supply grew 49 per cent in 1976 and 54 per cent in 1977 from K186 million in 1975 to K428 million in 1977, contributed by increased income in the stabilisation funds for coffee, cocoa and copra growers. This large increase in the money supply in 1976 and 1977 also indicated the growing reliance in monetary policy.
The CPSF, which were set up to stabilise prices to producers, also helped dampen the effects of commodity price cycles on the domestic money supply, since the majority of their assets was held in the Central Bank. The CPSF reduced monetary instability as they developed substantial reserves between 1976 and 1979 when export prices were exceptionally high. About 60 per cent of these reserves were deposited in the Central Bank. The remaining 40 per cent deposited in the trading banks was available to support increased bank lending and thereby increased the money supply. The disbursements from the deposits held with the BPNG had reduced the monetary contraction associated with low export prices.
During 1976 to 1979, the stance of monetary policy was more or less passive. Domestic interest rates remained steady and were generally below international levels. From the early 1980s, there was a shift towards a more active and interventionist monetary policy.
6.3.3 Trade Policy
In the early years after Independence, PNG maintained a very open trade policy regime with primary reliance on market forces to promote industrialisation. During the 1970s, established firms experienced very little government interference in the form of quantitative trade restriction. Until the early 1980s, taxes on international transactions were low and generally comprised of a low and uniform import tax. No import bans or quotas were imposed although some interventions were made on an ad hoc basis to protect certain infant industries such as flour, poultry and animal feed (World Bank, 1981). Capital goods and raw materials were exempted from tariffs. Duties on manufacturing goods ranged between 10-18 per cent. A basic levy of 2.5 per cent was imposed on most imported goods, except for medicine and basic foods, and a tariff of up to 50 per cent was imposed on luxury goods. Given the lack of clear policy objectives, the impact of these ad hoc trade policy measures is not clear (World Bank, 1981).
Export taxes on primary products were set at 2.5 per cent. An export incentive scheme and tariff draw back system was also available during the 1970s for manufactured export industries. As a result of improved agricultural export prices, a 2.5-per-cent export tax for copra, tea and rubber was reintroduced from 1 January 1977. PNG also enjoyed duty free access for most of its primary exports to Australia, New Zealand and the EEC countries under the Lome Convention.
6.3.4 Exchange Rate Policy
In a period of rapid international inflation, the PNG government followed an exchange rate policy designed to help control imported inflation and achieved high level success in this regard as PNG’s rate of inflation has been one of the lowest in the world in 1975 (Goodman et al., 1985). Because of the very high import content of most consumer goods and intermediate goods. In the absence of trade restrictions in PNG, the relative prices of goods and services within the domestic economy were determined to a large extent by the corresponding relative prices set in international markets. Allowing these relative prices to determine an efficient allocation of resources, the government used the exchange rate to influence the absolute level of domestic prices. As shown in Table 6.4, there have been a number of exchange rate changes since monetary independence. The exchange rate of the kina appreciated against most currencies except the German Mark and the Japanese Yen. Currency appreciations relative to its major trading partners, combined with measures to
Table 6.4 The foreign exchange value of kina, 1975–80 (IK = units of foreign currency)
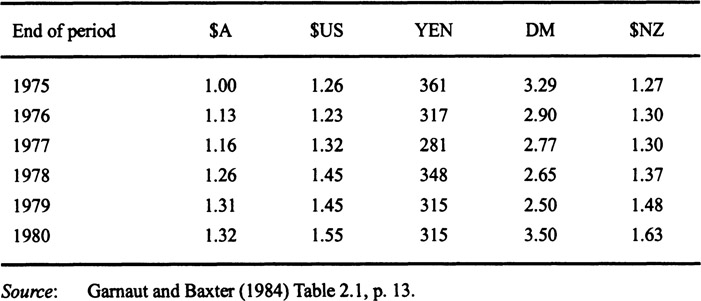
prevent a real increase in wages, resulted in a rate of inflation lower than that experienced by PNG’s major trading partners during the second half of the 1970s.
6.4 Effects of Resources Booms: 1972-78
It is difficult to trace the exact effects of each boom over a short period of time as prices and product markets react slowly to sudden unanticipated changes. Thus, an analysis of the effects of these three different booms, the BCL investment boom (1971-72), the mineral boom (1973-74) and the agricultural boom (1976-77) has been taken together. This gives us a much clearer picture of the consequences of these booms. The impact of these booms has been analysed in the light of the theoretical framework postulated in Chapter 2, on (1) key macroeconomic variables, (2) relative prices and (3) wages and employment.
6.4.1 Effects on Key Macroeconomic Variables
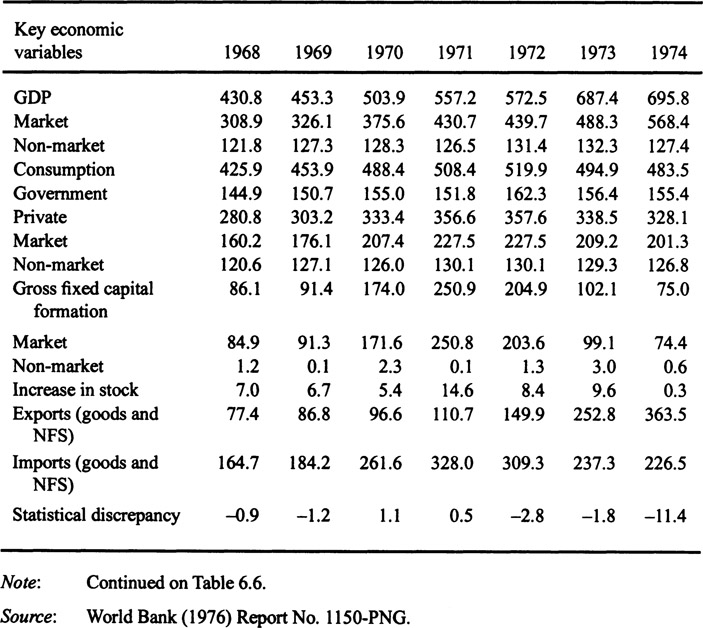
The effects of a resources boom on the key macroeconomic variables are examined by analysing the changes on the aggregate demand side of the economy. Both private and government consumption increased during 1972-74 but export growth was much larger than the growth in consumption. The fall in private consumption by expatriates in 1972 was compensated by increased consumption by locals, with final private consumption remaining at around K357 million over 1971-72 (Table 6.5). Government consumption was about 0.9 per cent higher in 1973 than the 1970 level.
Private foreign investment in the construction sector increased from A$96.9 million (K107 million) to A$414.8 million (K454 million) in 1972 at current prices. Investment spending on the BCL mine fell to A$20 million in 1972 from an average ofA$ 100 million in the previous years (World Bank, 1976). Other private investment was much the same in money terms as in previous years. The large volume of copper production and exports by the BCL mine, contributed to a large surplus in PNG’s balance of payments (BOP) in 1973.
In 1973, the trade account exhibited a surplus of K15.5 million from a deficit of K160 million in 1972. Most of this improvement was offset by the distribution of income and dividends payable to overseas shareholders plus the payment of interest and debt repayments. Nevertheless, the balance of payments on the current account improved from a deficit of K140 million in 1972 to a surplus of K42.5 million in 1973. The current and capital account surplus over 1973-74 brought a balance of payments surplus of K29.2 million in 1973 and K153.2 million 1974. The non-market primary and subsistence sector, which then accounted for 40 per cent of the economy, grew by more than 4 per cent with an output of K132 million in 1973 from K126.5 million in 1971.
Data on consumption expenditure show a declining trend in the real growth of
Table 6.5 Gross domestic expenditure, 1968–74 (at constant 1969 prices, kina million)
both private and public consumption spending over the period of 1976-77 (Table 6.6). Real private consumption increased moderately but public consumption fell 22 per cent in 1977. Most private consumption expenditures were on food, beverages, cigarettes, beer and motor vehicles. During 1976/77, gross fixed capital formation grew by 23 per cent in real terms, to K113.0 million in 1977 compared with K87.5 million in 1975, mostly contributed by the private sector.
Gross domestic investment increased by 26 per cent in 1977 from its previous year’s level and contributed 13 per cent to total GDP. Private investment also showed an increasing trend over the same period. Expenditure on plant, equipment and buildings increased with a very significant increase indicated for plant and equipment in the Highlands in 1976, during the December quarter. Inventory investment for raw materials and intermediate inputs and stock of finished goods also showed an increasing trend in this quarter.
Table 6.6 Gross domestic expenditure, 1975–78a (at constant 1969 prices, kina million)
| Key economic variables 1975 | 1976 | 1977 | July–Dec 1977 | 1978 |
|
|
||||
| GDP 642.9 | 570.2 | 628.0 | 348.0 | 701.7 |
| Market 553.9 | 475.3 | 530.4 | 295.5 | 593.9 |
| Non–market 109.0 | 94.9 | 97.6 | 52.5 | 107.8 |
| Consumption 543.6 | 511.8 | 494.2 | 277.2 | 492.2 |
| Government 210.1 | 196.1 | 171.8 | 85.2 | 182.1 |
| Private 333.5 | 315.7 | 322.4 | 186.0 | 392.1 |
| Market 225.6 | 221.9 | 225.9 | 134.1 | 285.6 |
| Non–market 107.9 | 93.8 | 96.5 | 51.9 | 106.5 |
| Gross fixed capital formation 119.4 | 87.2 | 113.0 | 65.0 | 136.4 |
| Market 118.5 | 86.2 | 111.9 | 64.4 | 135.1 |
| Non–market 0.9 | 1.0 | 1.1 | 0.6 | 1.1 |
| Increase in stock 22.7 | 16.0 | 16.9 | 7.5 | 22.3 |
| Exports (goods and NFS) 274.1 | 213.8 | 270.0 | 170.0 | 294.3 |
| Imports (goods and NFS) 287.1 | 251.4 | 263.0 | 161.9 | 318.7 |
| Statistical discrepancy -5.9 | -6.9 | -3.1 | -3.9 | -4.3 |
Notes: aBeginning in 1978, the fiscal year was changed to coincide with the calendar year.
Source: World Bank (1981) Report No. 3544a–PNG.
By industry classification, investment in primary production, building and construction, motor vehicle and machinery distribution reported strong growth. Both gross domestic savings and investment increased substantially with gross domestic investment increased from 15 per cent in 1973 to more than 22 per cent in 1978 which indicates that the boom was perceived by households as a temporary one. As a result, the agricultural boom in 1976-77 induced a subseqcent construction boom, indicated by increased production in the construction and building sector, and reduced inflationary pressure on the nontradable goods market. Between 1975/76 and in 1980, the public sector’s real investment doubled which was very conducive to long-term steady growth. This outcome is predicted by the theoretical propositions of a construction boom where the private sector correctly perceived the nature of a resources boom and increases investment in nontradable capitals due to imperfection in the under-developed capital market. This outcome is also verified by the econometric results of Chapter 5.
In 1977, the total value of exports increased relative to the total value of imports and brought a large current account surplus. The strong current and capital account balance during 1976-77 brought an overall balance of payments surplus of K34.6 million in 1976 followed by a huge K110.3 million in 1977. This substantially reduced PNG’s net foreign indebtedness over the first four years of monetary independence.
6.4.2 Relative Price Effect
The indices of most important price series have been shown in Tables 6.7 and 6.8, indicating the relative price movements over 1970-80. The CPI shows a sharp increase in 1973. The CPI rose 5.6 per cent in 1971 followed by 3.5 per cent in 1972.
But the index rose by 31 per cent during 1973, with food components (including alcohol, tobacco and betel nuts) dominating the index. Following the sharp increase during 1973, the rate of price level increase slackened markedly from the first quarter of 1974 and the inflation rate stood at 7.5 per cent over the year. Imported inflation
Table 6.7 Changes in key price indices, 1970–80 (1970=100)
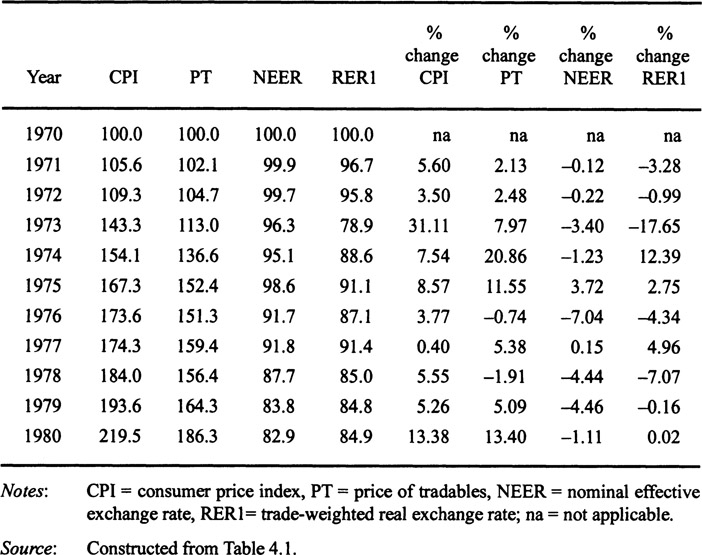
Table 6.8 Changes in key price indices of export and import–competing industries, 1970–80 (1970=100)

impacted on PNG’s inflation rate during 1975. Table 6.7 also indicates an increasing trend for the prices of tradables. The average trade-weighted nominal exchange rate (RER1) appreciated 1.2 per cent against major trading partners’ currencies over 1971—74. The increase in domestic CPI was much higher than the increase in the price of tradables, bringing a significant reduction in the relative price of tradables to the domestic CPI during 1973. While the trade-weighted real exchange rate (RER1) appreciated 18 per cent in 1973 from the previous year’s level, the real exchange rate for exports and the import-competing sector depreciated by 50 and 16 per cent, respectively, in 1973, due to increases in world price for PNG’s export commodities (Table 6.8).
Table 6.8 indicates that the real exchange rate for export- and import-competing industries depreciated as the export and import price indices rose more rapidly than the domestic price of nontradables (weighted average of nontradable components of CPI) over the 1972-74 period. It can therefore be concluded from the empirical analysis and the econometric investigation that the appreciation of the trade-weighted real exchange rate in 1973 might have been overestimated due to a sharp increase in the CPI which itself contains a considerable amount of tradable items.
During the commodity boom of 1976-77, the kina value price of tradables continued to rise, while domestic inflation began to decline in 1976. Increased tradable prices, and an inflation rate of 0.4 per cent in 1977, increased the prices of tradables relative to the domestic CPI (Table 6.7). This change in relative prices brought about a 5-per-cent depreciation of the trade-weighted real exchange rate which was a significant improvement over a 4-per-cent appreciation of the real exchange rate in the previous year.
Real exchange rates for the export and import competing sectors also indicate a substantial depreciation. In 1977, the export price index increased by 25 per cent and the import price index increased about 6 per cent compared with a 2-per-cent increase in the domestic price of nontradables (Table 6.8). It is interesting to note the real exchange rates depreciated significantly in terms of all alternative measures at the height of the agricultural boom in 1977, which can be attributable to prudent policy choices during the 1976-77 period.

Note: RER1= trade-weighted real exchange rate
Source: Equation 4.1
Figure 6.1
Actual and estimated real exchange rates in PNG,1972-94
Figure 6.1 indicates that the actual real appreciation of the trade-weighted exchange rate was greater than estimated real appreciation due to the very high inflation induced by the dramatic increase in nominal wages and government spending in the nontradable sector during the mineral booms of 1973. But during the 1976-77 commodity boom, the actual real depreciation was much higher than what is predicted by the estimated model. It seems to reflect the impact of income and wage restraint policies, as well as reduced aid and grants flow from Australia. The proposition that the open trade regime of the 1970s also reduced appreciation of the real exchange rate over the period, is supported by the econometric results in Chapter 4.
6.4.3 Effects on Employment and Wages
This section attempts to analyse the changes in employment and real wages in PNG during the resources booms of the 1970s. As discussed in the theoretical framework, a resources boom shifts labour from the non-booming traded sector to the nontradable sector as the price of traded goods falls relative to nontradables. This shift of labour is likely to have enormous ramifications for wages and overall distribution of income.
Available data on employment in monetised activities suggest there was an increase in total formal employment during the boom years. Total formal employment increased from the 1968 level by about 11 per cent in 1973 with a substantial increase in public and mining sector employment, although private non-mining employment shows a declining trend (Appendix Table A3.6). This outcome confirms the booming sector theoretical proposition that labour shifts from the non-booming private sector to the more profitable booming mining and nontradable public sectors. Available limited data on wage rates in Table 6.9 indicate that both real and nominal wage increased rapidly during the early 1970s, with employment in the non-mining sector failing to keep pace with the wage rise.
The declining trend for private non-mining employment growth appears to have been closely related to the increase in real wages. The rise in domestic CPI was 13 per cent on average whereas the nominal weekly wage rose 56 per cent for urban workers and 13 per cent for rural workers over the 1972-75 period.
As a result, rural and urban real wages increased on average by 0.5 per cent and 30 per cent, respectively (Table 6.9). The higher cost of labour due to this substantial increase in money wages and salaries added upward pressure to domestic prices, exacerbated inequality between rural and urban incomes, and adversely affected employment. It is evident from the wage and price data that the increase in real wages during the high inflationary period was clearly influenced by the deliberate implementation of a wage policy which raised the urban nominal wage faster than domestic price level changes.
It is noticeable that during the BCL investment and mineral boom in 1971-74, a large share of the wages bill went to pay skilled expatriate labourers. As a result, the enclave nature of these booms did not have much spill-over effect on the vast non-mining sector’s employment and spending behaviour. The mobility of labour across national boundaries reduced the spending effects of the resources boom which might have helped to keep the domestic price level relatively stable, as discussed in the extension of ‘Dutch disease’ theory under the openness of the labour market in Chapter 2.
Table 6.9 Changes in real and nominal weekly wages, 1967–85

It has been the policy of the PNG government, since independence, to maintain a steady trend in real wages. The wage structure that was determined between 1972 and 1975 posed a number of problems. The wages study by Gamaut and Baxter (1984, p. 99) suggested that employment growth was very slow when urban minimum wages were rising 50 per cent during 1972-76, and indicated that the high level of wages was one of the major factors responsible for depressing the level of employment and the pace of employment generation in PNG.
Except for the mining sector, urban wage employment growth was relatively stronger from 1976 because of the direct spending effects of the agricultural boom. The growth in rural wages shows this effect. The growth in urban wages is also quite significant, given that they were already artificially high as a result of the MWB ruling in 1972/73. The government’s institution of a temporary wage freeze in 1976, was successful as an initiative to reduce the inflationary wage spiral. After that, until 1992 wages were indexed at, or slightly below, the growth rate of the urban based consumer price index. Minimum Wage Boards had accepted the argument that wage determination should be restrained to encourage the growth of income earning opportunities and to allow the government to increase the share of new development spending in the budget. Although rural wages rose slightly, the result was a reduction of 2 to 6 per cent in the real value of urban minimum wages for unskilled labourers between 1976 and 1980.
Over the period 1977-79, total wage employment increased by 1.7 per cent annually, with an increase of 2 per cent in private sector employment, while employment in the mining and public sector remained steady (Appendix Table A3.6). Rural nominal wages increased on average by 9.7 per cent, but urban wages rose by only 3.5 per cent in 1978, from the 1975 level. Costs and prices increased due to continued increases in the cost of materials and supplies, but labour costs increased only marginally. In 1978, real rural wages rose by 3.4 per cent, but real urban wages fell by 1.9 per cent as a result of temporary wage freeze in 1976.
6.5 Changes in Sectoral Composition
It is clearly evident that the onset of full operation of the BCL project, and the subseqcent mineral boom and agricultural commodity boom in the second half of the 1970s, together with government policy responses, had significant identifiable effects on both the relative prices of tradables to nontradables and wages and employment. This section examines sectoral composition changes over 1971-78, and investigates the overall effects of the resources booms and the policy implications on the sectoral composition of the PNG economy over the decade of the 1970s.
Table 6.10 shows the sectoral composition of GDP, from late 1968 to 1977. The data indicate a declining trend in agricultural share to GDP between 1971-74, although the value of agricultural output increased from K216 million in 1971 to K273 million in 1974. The share of the agricultural sector to total output in 1971 accounted for 35 per cent before declining sharply to 26 per cent of GDP in 1974. By contrast, the sectoral share of mining increased dramatically, from a very low 0.2 per cent in 1971 to 25 per cent of GDP in 1974.
The share of mining exports also grew dramatically, from a low of 0.1 per cent in 1971 to 17 per cent of total GDP in 1973. But the agricultural export share of GDP fell from 6 per cent in 1972 to 5 per cent of GDP in 1973. In the manufacturing sector, general business activities seemed to increase but the share of this sector to GDP shows slow growth, from 6 per cent in 1971 to 7 per cent GDP in 1974.
The share of the services sector to GDP declined from 38 per cent of GDP in 1971 to 32 per cent in 1973 and increased again to 38 per cent in 1974. The building and construction sector also slowed, due to declining investment in the BCL project, and cut-backs in government capital spending. The contribution of non-market products fell from 28 per cent in 1968 to 18 per cent, although more than half the population survived on subsistence agriculture in 1974.
Towards the end of 1974 world commodity prices slumped and the prices for most of PNG’s major tree crops declined. In 1974, the real value of GDP fell a massive 18 per cent, indicating an economy wide recession in that year. PNG’s
Table 6.10 Gross domestic product by industrial origin, 1968–77 (percentage share of GDP)

export revenue declined by 24 per cent in 1975 from 1974, reflecting both lower world prices for PNG’s exports and lower export volumes. On completion of the Bougainville construction the share of construction sector to GDP fell from 18 to 14 per cent. This sector accounted for only 8 per cent of GDP as the government responded to the 1974’s downturn by cutting capital expenditure, with a subseqcent contractionary effect on building and construction sector.
In 1974, following the large increase in the urban wage, private investment became sluggish, while private consumption was buoyant. Copper prices fell sharply which reduced the share of the BCL mine in total export value — although it accounted for almost 50 per cent of total exports in 1974. Imports fell from their previous level because of the lack of new investment projects. However, overall, the economic environment and prospects appeared more stable at the end of 1974.
Benefits from the commodity boom in the second half of the 1970s were more evenly distributed in the economy. Because of the nature and origin of this boom, the price impact was more moderate than the booms in the early 1970s. In 1977, the real growth rate of GDP was 10 per cent, compared with -12.0 per cent in 1976. The share of the agricultural sector to GDP improved significantly from 26 per cent in 1974 to 36 per cent in 1977, and remained stable until 1979. The mining sector contributed an average 10 per cent to GDP and its share increased to 15 per cent of GDP in 1979 due to the continued escalation of world gold prices together with the maintenance of high prices for copper.
The boom had important growth effects on manufacturing output, fixed capital formation and a wide range of private sector services. Increased domestic production increased the supply of goods and services. The share of the manufacturing sector to GDP increased from 8 per cent of GDP in 1975 to 9 per cent in 1977. The contribution of the services sector to GDP rose from 33 per cent in 1976 to 38 per cent in 1977. Since independence, the building and construction sector has experienced increasing growth. In 1977, the construction sector experienced strong growth associated with investment in general office buildings and hotel accommodation. The expansion of the construction sector associated with the commodity boom in PNG confirms the propositions of the construction boom theory.
During 1978, economic activities slowed down, due to falling world market prices for PNG’s agricultural export commodities. The share of agricultural exports fell to 15 per cent of total exports in 1978 from 22 per cent in the previous year. The share of mining exports grew moderately, private and government consumption was modest, with government expenditure only slightly above budget projections and total revenue collection for the year close to expectations. Gross domestic investment as a percentage of GDP increased moderately by one percentage point in 1978 from 1977. In 1978, current account balance was only K4.3 million, with an almost 50 per cent reduction compared with 1977, and an overall balance of payments deficit of K1.8 million. The TOT fell by 25.3 per cent, as the import price index rose to 118.3 in 1978, compared with an export price index of 88.4. The weak balance of payments associated with the lower commodity prices in 1978 caused monetary expansion to fall. The growth of real GDP fell to 1.8 per cent due to decline in mining sector output, the result of decline in the ore content of the copper concentrate produced by the BCL mine.
PNG economy experienced an appreciable pick-up in economic activities since the mid-1980 following an extended period of slow growth during the first half of the decade. Investment in the mining sector peaked at nearly 15 per cent of GDP in the early 1980s at the height of investment in the Ok Tedi mine.2 Real GDP grew by 3.7 per cent per annum between 1985 and 1988. Gross domestic investment increased from 22 per cent of GDP in 1985 to 25 per cent in 1990 (Table 3.2). But public investment was on a declining trend throughout most of the 1980s, falling steadily from nearly 9 per cent of GDP in 1981 to around 5 per cent by 1987. Private non-mining sector also exhibited a similar trend, declining from more than 13 per cent of GDP in 1981 to just over 8 per cent in 1987 (World Bank, 1991). In the final two years of the decade there was an encouraging recovery, but it was mainly confined to the construction sector as a result of increased demand for residential and office accommodation.
During the second half of the 1980s, PNG established a sound overall fiscal management. Following several years of large fiscal deficits in the early 1980s, the government increased its revenue efforts and tightened control over expenditures. As a consequence, the overall fiscal deficit fell to 2 per cent of GDP in 1985 and just over 1 per cent between 1987-89 (World Bank, 1991). The government placed considerably more emphasis on public investment and by 1989 public investment had risen to 4.5 per cent of GDP. Another notable aspect of PNG’s fiscal performance in the 1980s was the extent to which the country increased its self reliance in revenue generation and financing. Budgetary grants from Australia which represented almost one third of current revenues in 1981, had fallen in relative importance to less than one fifth by the end of the decade. After having an extended period of balance of payments deficits during 1981-83, PNG’s balance of payments improved significantly from the mid-1980s owing primarily to the production Ok Tedi mine and higher world prices for copper and gold. Official reserve peaked at the end of 1987 at just over K564 million, equivalent to more than 6 months of non-mineral imports. Government also adopted a prudent approach to external borrowing from the middle of the 1980s and a contractionary monetary policy was followed from 1989. There was a substantial decline in total formal sector employment during the first half of the 1980s followed by a moderate recovery during the second half of the decade. Domestic price level became more stable at around 3.2 per cent per annum between 1985-88 from a double digit inflation rate in the early 1980s (Appendix Table A3.2).
6.6 Resources Boom in the Early 1990s
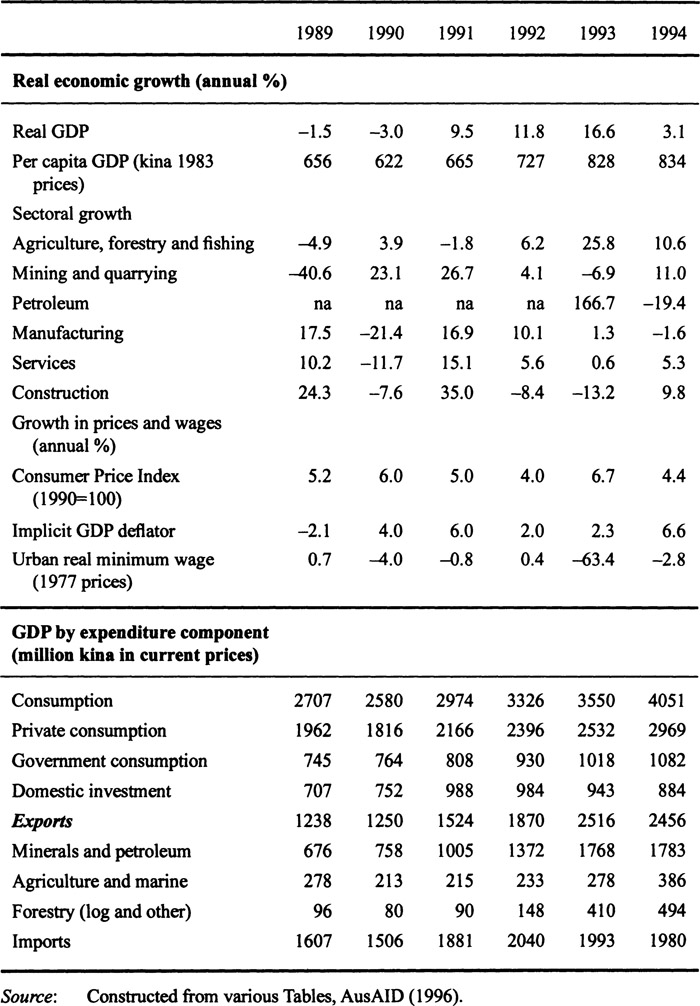
PNG experienced another resources boom in its mineral sector over the 1991-93 period, due to the new discovery of petroleum as well as buoyant gold prices in the world market. The strength of this boom was determined by the world market prices of gold, copper and petroleum, as well as domestic and foreign investment conditions. Real GDP grew from a low –3.0 per cent in 1990 to 9.5 per cent in 1991,11.8 per cent in 1992 and 16.6 per cent in 1993. This spectacular performance resulted in a significant increase in levels of real per capita income, rising from K665 in 1991 to K828 in 1993.
Background
After achieving admirable economic growth in the second half of the 1980s, PNG faced enormous setbacks in May 1989. The abrupt cessation of BCL operations brought the economy to a sudden halt; unrest in the North Solomons resulted in a sharp downturn in tree-crop exports; as virtually all the prices of the country’s leading tree crop exports fell, in some cases, quite drastically. As a result, real GDP fell by 1.5 per cent in 1989.
The impact of these shocks was severe. Between 1989 and 1991, the adverse average annual impact on national income and fiscal revenue was at 10.9 and 3.7 per cent respectively. The average annual impact on the balance of payments was at about US$375 million, or, about one-quarter of total exports in 1988. Roughly half of these losses were attributable to the BCL mine closure and the other half to the fall in TOT and loss of non-mineral output from North Solomons province. During 1989 and 1990, private consumption and gross domestic investment declined from the 1988 level.
However, the government committed itself to implementing widespread reform (Elek, 1991). The PNG authorities undertook large cuts in government expenditure and significant revenue-raising efforts, which held the fiscal deficit at about 3 per cent of GDP in 1990. Since 1989, monetary policy was kept tight, by means of ceilings on domestic credit to the private sector. Growth in the broad money supply fell from 10.7 per cent in 1988 to 6.5 per cent in 1989 and 5 per cent in 1990. Inflation was on a declining trend from 1989 to 1992.
The burden of the adjustment was reasonable and broad throughout the economy. Output in the agricultural sector declined by 4.9 per cent in 1989. Real GDP fell to -3.0 per cent in 1990. Contribution of the services sector to GDP dropped to -12 per cent from the previous year, owing to the impact of restraint in government spending, and weakness in both wholesale and retail trade. Among the other major sectors, construction and utilities recorded a sharp decline of 8 per cent in output growth, reflecting a drop-off from the high rates of building activity and mine construction in 1989. Output in manufacturing continued to grow at a modest rate which was typical of the previous years, except for the big dip in 1990.
6.6.1 Resources Boom: 1992-93
The rapid economic growth in the early years of the 1990s came largely from growth in minerals and petroleum production along with spin off activities in other non-mining sectors. Oil production from the Kutubu oil project accounted for 10 per cent of GDP in 1992. Oil exports earned K301 million in 1992 increasing up to an estimated K848 million in 1993. Production of petroleum from the Kutubu project alone provided 37 per cent of total exports in 1993 from nothing in 1991.The combined share of the minerals and petroleum sector in GDP improved from 15 per cent in 1990 to about 30 per cent in 1993, and provided 30 per cent of government revenue. Non-mining GDP also increased by 5 per cent in 1991 but then came down to 1.1 per cent in 1993.
Between 1991 and 1994, the value of total exports increased enormously. Mineral exports increased from K758 million, or 32 per cent of GDP, in 1990 to K1768, or 53 per cent of GDP, in 1993. From K205 million in 1990, agricultural exports increased to K270 million in 1993 and K375 million in 1994. Revenues from log exports increased more than six fold from K80 million in 1990 to K494 million in 1994.
6.7 Policy Response
Since independence until 1989, PNG maintained confidence in the financial system by exercising successful expenditure restraint policy, and a ‘hard kina’ policy that kept domestic inflation at a low level. But from 1990 the country failed to maintain this reliable policy package, due to a series of budget deficits caused largely by the closure of BCL mine and subseqcent fiscal indiscipline.
6.7.1 Fiscal Policy
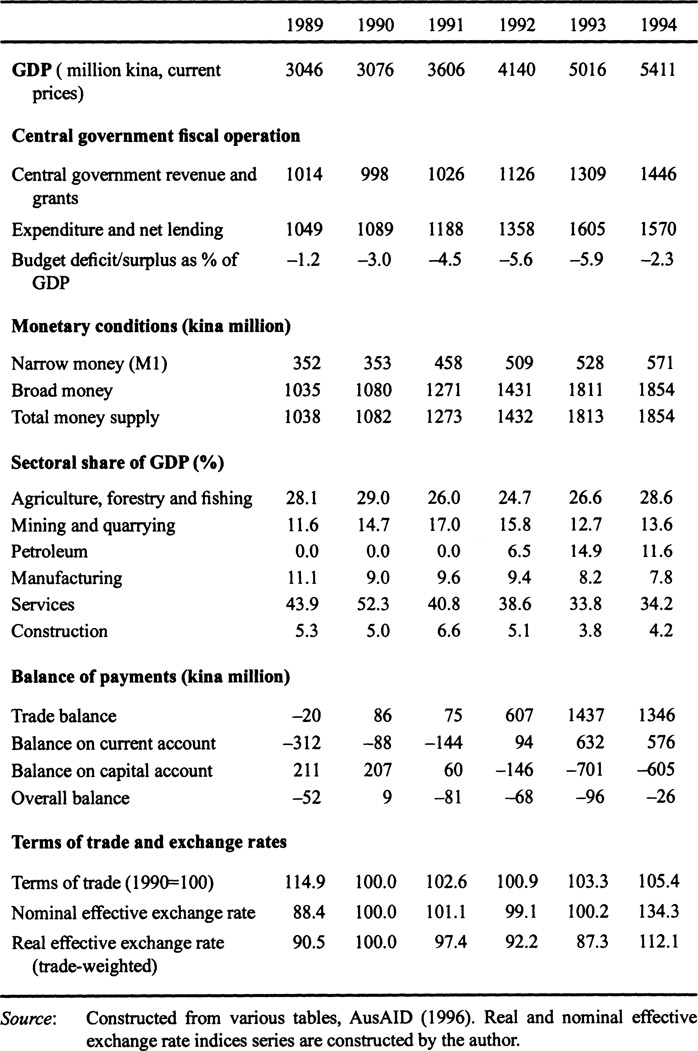
The PNG government’s undisciplined fiscal policy was a major issue of concern during 1990-94. The fiscal deficit widened in 1990 with the closure of the Panguna mine at Bougainville. Government internal revenue and grants fell from K1014 million in 1989 to K998 million in 1990 while total government spending increased from K1049 million in 1989 to K1089 million in 1990. In 1991, government revenue recovered to 1989 levels and grew rapidly over 1992 to 1994, owing to increased revenue flows from the boom in the minerals and petroleum sector.
In 1991 central government expenditure increased by K99 million with large increases on education, defence, transport, public debt servicing and transfers to local and provincial governments.
The economy absorbed the mineral windfalls through current consumption as the boom was perceived as lasting a longer period. This is evident from the shaip rise in government expenditure over the years 1991 and 1993, which contributed to a fiscal deficit of 5.6 per cent in 1992 and 5.9 per cent in 1993.
Table 6.11 Key economic indicators, 1989–94
The 1994 budget was expansionary at the beginning of the year but later changed to a more restrictive policy stance owing to the sharp increase in the fiscal deficit. By early 1994, the price support programme announced in 1992 was creating significant pressure on government expenditure, and the budget deficit had grown to 11 per cent of GDP by the middle of the year. The government announced another mini budget to reduce the deteriorating fiscal situation largely due to an unexpected but shaip decline in oil prices. As prices rose in mid-1994, the subsidy for coffee became redundant. By the end of the year, the adoption of an expenditure restraint policy had reduced total government expenditure to K1570 million. Higher than expected mining revenues, as well as cuts in crop price support and transport costs, increased total revenue and grants of K1446 million, reducing the budget deficit to 2.3 per cent (AusAID, 1996).
A positive balance in the MRSF over this period gave a misleading conception of the government as a net saver. Over this period, continuous fiscal deficits simply indicated that the government effectively borrowed from the private sector to augment the MRSF. Between 1990 and 1994, public sector debt increased to K2.9 billion, or 48 per cent of GDP, and the debt servicing requirement increased to K86 million. To finance these continuous budget deficits, foreign debt rose to US$4.2 billion with debt servicing costs rocketing to over 30 per cent of export earnings (AusAID, 1995).
6.7.2 Monetary Policy
In mid-1991, the BPNG changed monetary policy from a liquid asset requirement to a base money management approach, adopting open market operations as the principal policy instrument. This monetary approach was reasonably successful in keeping liquidity growth under control. As fiscal deficits grew, and interest rates remained above those in Australia the BPNG faced enormous pressure to keep interest rates under control. However, at the end of 1992 and in mid-1993, lending rates were lowered, narrowing the spread somewhat (Table 3.9).
During 1992 and 1993, private sector credit growth was above 4 per cent but liquidity had fallen due to a substantial decline in foreign assets. Total money showed an increasing trend over the period. The growth rate of money supply increased from 4.2 per cent in 1990 to 17.7 per cent in 1991 and then eased back to 12.5 per cent in 1992 whereas real GDP grew at a slower rate than money supply by 9.5 per cent in 1991 and 11.8 per cent in 1992.
In 1993, money supply of about 27 per cent was much higher than 16.6 per cent growth of real GDP (Table 3.9, Table 6.11 and Table 6.12). The econometric results in Chapter 4 indicate an excessive growth rate of money supply (growth of money exceeds GDP growth) had an adverse impact on the real exchange rate of PNG. The RER appreciated by 5 per cent in 1993 (Table 6.15).
Although the growth rate of money supply fell dramatically to 2.3 per cent in 1994, the burden on the banking system of financing the entire budget deficit domestically, resulted in tighter credit conditions in the private sector and foreign assets, putting further upward pressure on interest rates.
The introduction of a floating exchange rate system in October 1994 impacted substantially on how monetary policy was conducted. Since the BPNG has no obligation under the floating system to sell or buy foreign currencies at a particular exchange rate, it could set the level of the money supply independently, and the weighted average of commercial bank lending rates increased substantially from 10 per cent in December 1994 to 15.4 per cent by December 1995. Private sector demand for credit was affected by adverse fiscal and monetary conditions in 1994, the subseqcent high interest rates in 1995 and the uncertain investment climate.
Table 6.12 Major economic indicators before and during the 1991–93 boom
6.7.3 Trade Policy
Until the early 1980s, PNG followed an open trade regime, with taxes on imports and exports quite low and relatively uniform. From the mid-1980s, an increasing number of trade interventions were introduced to achieve an assortment of revenue, protection and distributional objectives. Tariff policy has been seen as an instrument of industry policy to promote the interest of a particular sector or industry. The protective policy introduced in PNG produced widely differing rates of effective protection and served the interest of producers focussed on the domestic market. Import bans and very high duties on selected products created an incentive structure with high levels of effective protection for a limited range of activities and a strong bias against exports and the agricultural sector. Table 6.13 shows that currently 68 per cent of 5,366 total tariff items are taxed at rates of 11 per cent or below. The remaining 31 per cent items are protected at rates of 40 per cent or higher. In the early 1980s, the tariff rate for a smaller number of import competing industries was 10 per cent which was increased to 17.5 per cent in the mid-1980s, and sharply increased in the early 1990s to 30 per cent for all goods where there was domestic production (Fallon et al., 1995). The rise in import protection has been accompanied by bans on certain food items, import quotas, and special privileges given to cement, canned meat and sugar industries.
As shown in Table 6.13, currently 2 per cent of imports are duty-free. Basic food items such as rice as well as medical supply and equipment, books and kerosene are exempted from duty, while a 5 per cent tariff is imposed on 22 per cent of tariff items classified as basic inputs to production.
The basic tariff rate of 11 per cent is imposed on the largest category which
Table 6.13 Tariff regime in Papua New Guinea as in mid–1990s
| Existing tariff regime | Tariff rate | Number of tariff items |
|
|
||
| Free | 0% | 127 (2%) |
| Input rate | 5% | 1178 (22%) |
| Basic rate | 11% | 2377 (44%) |
| Protective rate | 40% | 1051 (20%) |
| Restrictive/luxury rate | 55% | 504 (9%) |
| Prohibitive rate | Specific rates or ad valorem (75%–175%) | 129 (2%) |
Source: Internal Revenue Commission of Papua New Guinea (1997), Table 2.
includes many foodstuff items, textiles, production inputs and raw materials. The current rate of 40 per cent is on the category of goods that are produced or potentially can be produced in PNG. A 55-per-cent restrictive tariff is imposed on 504 tariff items, including fish, some toiletries, photographic Aim, wood boards, carpets, pearls and precious stones, steel netting and fencing, double cab vehicles and motor cycles, arms and ammunition and furniture. Another 2 per cent of importable items are subject to a prohibitive tariff rate of 75 to 175 per cent. The specific import duty rates are imposed K3.50 per kg of poultry and K0.05 per box of matches. When these special rates are converted into ad valorem form, they provide very high levels of protection. The ad valorem rates include many vegetables and fruits (75%), vehicles (75%), sugar (85%), tinned mackerel (99%), beer (125%), cigarette and cigars (125%), veneer and plywood (100%), and door frames (100%).
Table 6.14 indicates currently in PNG the average nominal tariff rate is 21.9 per cent and the trade-weighted tariff rate is 14.3. At a broader industry classification level, the highest level of nominal protection is given to fisheries (53.9%), agriculture (46.3%) and food processing (46.1%). Both the nominal and trade-weighted tariff is on manufactured articles imposed at about 30 per cent.
Table 6.14 Average sectoral tariff rates in Papua New Guinea as in mid–1990s
| Category of goods | Nominal tariff rate (average) | Trade–weighted tariff rate (average) |
|
|
||
| All goods | 21.9 | 14.3 |
| Agriculture (excluding fish) | 46.3 | 10.9 |
| Fish and fish products | 53.9 | 48.9 |
| Food processing | 46.1 | 39.4 |
| Wood, pulp, paper and furniture | 35.7 | 19.3 |
| Textiles and clothing | 23.3 | 25.9 |
| Leather, rubber and footwear | 27.8 | 37.2 |
| Metals | 12.9 | 11.4 |
| Chemical and photographic supplies | 10.8 | 13.8 |
| Plastics | 20.4 | 15.7 |
| Transport equipment | 19.6 | 16.7 |
| Non–electric machinery | 6.6 | 5.9 |
| Electric machinery | 12.7 | 13.4 |
| Mineral products, precious stones and metals | 21.0 | 7.5 |
| Other manufactured articles | 29.6 | 30.4 |
| Total | 5366 (99%) | |
Note: The average trade–weighted tariff rate is the nominal tariff rate weighted against trade data. Tariff schedule as of January 1997.
Source: Internal Revenue Commission of Papua New Guinea (1997), Table 3.
Although PNG’s nominal rate of tariff is not exceptionally high, some of the tariff barriers, especially on fish and fish products, food processing, leather, rubber and footwear and other manufactured articles have been imposing significant costs on the most efficient import-competing and export-oriented sectors as well as on consumers.
The limitations of this trade policy have been recognised by successive governments, and several unsuccessful attempts have been made in recent years to reform the system.
In the 1990s, promotion of export oriented manufacturing was regarded as a longer term goal. Under this programme the PNG government decided to remove all import bans and introduce tariffs where protection was required to continue. The result was high tariffs on several items, such as poultry, but a decision to remove the remaining bans was postponed (AIDAB, 1993, p. 19). In 1992, the PNG government took further initiatives to reform trade policy by replacing quantitative restrictions with more uniform and simple import duties (at around 10 per cent). This reform was also directed at removing export taxes, except for logs and unprocessed shells (AusAID, 1995, p. 142). Tariffs on a number of commercial inputs, including fuels, spare parts and transport equipment were subsequently reduced in the 1993 budget, but the general import levy was also increased, from 8 per cent to 10 per cent, and again to 11 per cent in 1994 with its coverage extended to a range of goods including some agricultural and manufacturing inputs that had previously been exempted.
The 1993 budget also proposed highly restrictive tariff protection on some chosen goods and individual manufacturers and projects and continued a ban on sugar imports which was overtly inconsistent with underlying trade reform principles. This budget increased further restrictive protection for the Lea Mackerel Cannery and the Halla Cement Factory. From September 1993, a nominal monopoly was given to the sole domestic producer of cement, where users could import cement only with a special licence. As a result, the prices of cement increased more than 50 per cent. The 1994 budget again imposed a protective rate of duty of another 11 per cent on basic consumer goods used by the low income consumer while reducing duties on luxury items. The Supply Bill of November 1994 raised the protective rate of duty to 40 per cent.
6.7.4 Exchange Rate Policy
Since monetary independence, under the influence of the ‘hard kina’ policy, PNG maintained a convertible currency and until 1980 was successful in maintaining low inflation, relative to world inflation. Domestic inflation increased sharply in 1981-82 and remained relatively high up until 1984 (Appendix Table A3.2). From June 1978 to October 1994 the kina was pegged to a basket of currencies of its major trading partners. The kina was devalued by 10 per cent in early 1990 and in 1993 appreciated by 1.7 per cent against the Australian dollar, 0.9 per cent against the US dollar, and 10.3 per cent against the German Deutschemark but depreciated by 9.4 per cent against the Japanese yen. On 12 September 1994, the kina was devalued by 12 per cent against the US dollar. The PNG government decided to float the kina in the face of a worsening foreign exchange crisis on 4 October 1994. By mid-1995 the kina had declined by more than 40 per cent in nominal terms from the level 12 months earlier.
6.8 Effects of Resources Boom: 1991-94
In this section the effects of the resources boom of 1991-93 on the key macroeconomic variables are analysed by examining the expenditure side of the national income accounts.
6.8.1 Effects on Key Macroeconomic Variables
During 1991-93, both private and public consumption growth were moderate. The share of private consumption to GDP fell from 60 per cent in 1991 to 51 per cent in 1993. Overall government demand remained at about 28 per cent of total GDP with a public consumption demand of 20 per cent of total GDP in 1993 compared with 22 per cent in 1991. Total private demand (consumption and investment) declined significantly from around 88 per cent of GDP in the early 1980s to around 68 per cent of GDP in 1993 (AIDAB, 1994). This relative decline in private spending reflected diminished optimism in private consumption and private investment. The construction of the Porgera and Kutubu projects contributed to a sharp increase in private fixed investment which accounted for more than 23 per cent of GDP in 1991. Gross domestic investment increased to 27.4 per cent of GDP in 1991 and then declined to 20.3 per cent of GDP in 1993.
The value of merchandise imports grew by 26.5 per cent from 1990 to 1991 due to K250 million in capital imports associated with the construction of the Kutubu oil project. General imports also increased by 25 per cent indicating a general recovery in the economy. However, a continuous rise in export revenue and a substantial reduction in capital imports more than offset the increased imports of consumer goods between 1992 and 1994. The value of merchandise imports declined by 4.6 per cent in 1992 as a result of reductions in mining, petroleum and general imports. A further decline of 14.9 per cent in merchandise imports in 1993 was due to a lower level of imports by the mining and petroleum sectors. As a result, the trade surplus grew rapidly to K1437 million in 1993 from K75 million in 1991. The balance on die current account changed from a deficit of K144 million in 1991 to a surplus of K632 million in 1993 despite a large increase in services payments and net transfers associated with the mining sector.
Despite a large current account surplus, and a 10-per-cent devaluation of the kina in 1990, the overall balance of payments continued to weaken over the period 1991— 93 with an overall deficit of K68 million in 1992 and K96 million in 1993. This large deficit in 1993 was mainly brought about by the large capital account deficit of K701 million. The capital account deficit was mainly attributed to substantial increases in the private capital outflow, reflecting deterioration in private sectors’ confidence in a volatile investment climate. The outflows were also facilitated by the liberalisation of foreign exchange controls in 1992. As a consequence, international reserves fell to K112 million in 1993 from K309 million in 1991. In 1994, the value of merchandise imports increased by 16.9 per cent due to increased capital imports by the Porgera mine. However, the surplus in the trade account increased to K1346 million and the deficit in the capital account was K605 million. The overall balance of payments situation improved substantially in this year. The lower balance of payments deficit of K26 million was the result of higher merchandise exports, lower service payments and lower outflows of private capital.
6.8.2 Relative Price Effect
The inflation rate was 6 per cent in 1990 and 5 per cent in 1991 easing back to 4 per cent in 1992. This relative decline in the price level was mainly influenced by lower inflation in Australia, the major source of PNG’s imports, as well as by the appreciation of the kina against the Australian dollar. The CPI index rose to 7.2 per cent in 1993 but slowed down to a lower rate of 4.6 per cent during 1994. The kina value of tradables increased more than 17 per cent in 1990 which brought a 10.5-percent depreciation of the trade-weighted real exchange rate.
Over 1991-93 period, price of tradables increased less than one per cent (0.76 per cent) on average whereas domestic CPI rose by 5.6 per cent. The increase in the domestic price level relative to PNG’s major trading partners resulted from increased government spending, which appreciated the trade-weighted real exchange rate by 4.4 per cent. As the price of tradables increased substantially with a fall in the domestic price level to 4.5 per cent and a depreciation of the nominal exchange rate by 34 per cent, the trade-weighted real exchange rate depreciated more than 28 per cent in 1994 (Table 6.15).
Until 1992, the growth in the export price index was slower than the domestic price of nontradables but the index increased sharply during 1993-94 due to improved world market prices for PNG’s mineral and agricultural products. Real exchange rate for export sector depreciated by 8.5 per cent in 1993 and 15.4 per cent in 1994. In both years this was the outcome of greater increase in export prices compared to an increase in domestic price of nontradables.
The real exchange rate for import competing industries appreciated over 1991-93 before depreciating slightly at about 0.6 per cent in 1994 (Table 6.16). The movement of real exchange rates suggests that the relative price of tradables to nontradables declined over the 1991-93 period.
Table 6.15 Changes in relative price indices, 1988–94 (1990=100)

Table 6.16 Changes in relative price indices of export and import-competing sectors, 1990–94 (1990=100)

Appreciation of the real exchange rate was driven by a rapid fall in the inflation rates of PNG’s major trading partners. Increased domestic inflation was also aggravated by persistent expansionary fiscal policy and an increasingly restrictive trade regime. From the late 1980s until 1993, the increase in the domestic price level was higher than the price of tradables, which greatly reduced competitiveness of the economy and appreciated the real exchange rate substantially. This outcome is supported by the econometric results in Chapter 4, which indicates increased government spending significantly appreciates the real exchange rate, at least on a year to year basis. From 1994, PNG began to regain some competitiveness for its export commodities.
6.8.3 Effects on Employment and Wages
In 1990-91 employment in the private non-mining sector declined by about 4 per cent on average. Mining sector employment was also in a declining trend because of this sector’s capital intensive nature. The employment situation recovered in 1992 due to increased spin off activities in the non-mining sector, especially in agriculture. Employment in the formal sector declined by 3 per cent in 1993. The BPNG’s 1994 employment survey recorded a 10-per-cent decline in private formal sector employment. Both rural and urban nominal wages rose about 11 per cent in 1992 from 1990 levels whereas the real wage remained constant at about K25 weekly for urban and K9.4 weekly for rural workers over the 1990-92 period at 1977 prices (Table 6.17).
Introducing a land mark wage policy in 1992, the Minimum Wages Board Determination (MWBD) lowered urban minimum wages for new entrants and abolished wage indexation. Since 1992, private sector wages have been determined by market forces, subject to a national minimum wage set by the MWBD. The MWBD decision changed the focus of wage negotiation from an income based approach to a productivity based approach. It unified the dual system of urban and rural minimum wages at the much lower rural wage level and introduced a new national youth wage set at 75 per cent of the new national minimum. This
Table 6.17 Real and nominal weekly wages, 1988–93
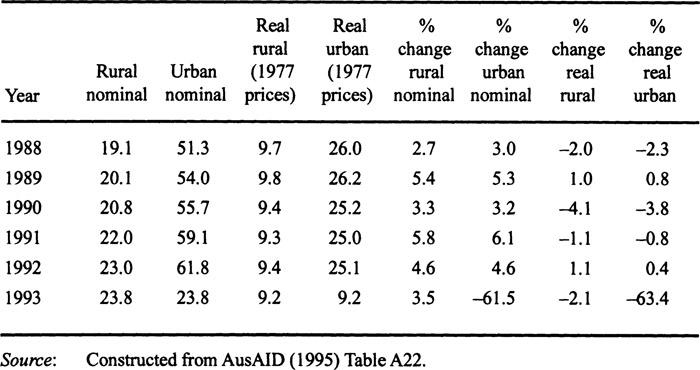
policy opened the way for achieving a reduction in the real exchange rate through a nominal exchange rate devaluation. A decline of 61 per cent in the nominal urban wage in 1993 brought a 63 per cent reduction in real urban wages compared with the 1992 level. A 3.5-per-cent growth in the nominal wage in 1994 resulted in a less than expected 2.1-per-cent decline in the minimum real wages.3
6.9 Changes in Sectoral Composition
Between 1991 and 1993, the contribution of the agricultural sector to GDP remained stable at around 26 per cent. Within the agricultural sector, logging showed the greatest expansion and provided more than half of the sector’s exports. The agricultural sector grew at the rate of 11 per cent in real terms and the share of agricultural output to GDP expanded to 29 per cent in 1994. Improvement in world prices for PNG’s agricultural cash crops in 1993 and devaluation of the kina improved the competitiveness of this sector. In the second half of 1994, export prices for coffee, copra and palm oil all moved above their respective support prices and contributed about 14 per cent of total export revenue.
The share of the manufacturing sector declined from 10 per cent of GDP in 1991 to 8 per cent in 1993, due to a substantial reduction in both private and public consumption growth. This outcome is consistent with the econometric results in Chapter 5 suggesting a positive relationship between domestic absorption and output of this sector.
The services sector also indicated a declining trend over the period, from a share of 40 per cent of GDP in 1991 to 34 per cent of GDP in 1993. Benefit from the opening of major new projects, the construction sector had real growth of 35 per cent in 1991. The growth of this sector declined to 13 per cent in 1993, attributed to a lack of new investment and the completion of a number of large construction projects. After the sharp decline in 1993, this sector’s growth rate picked up in 1994 and was at around 10 per cent in real terms as a result of major building projects such as the Lamana Hotel and the Royal Papua Yacht Club Marina. The econometric results of sectoral growth in Chapter 5 indicate that appreciation of the real exchange rate, an increase in domestic absorption, and increased government investment, expand the output of the construction sector.
The real growth rate in the mining and quarrying sector was 11 per cent, but the growth in petroleum sector declined to 19.4 per cent in 1994 from 167 per cent in 1993, as petroleum output fell substantially from the Kutubu oil field. This sector’s contribution to export revenue fell to 26 per cent in 1994 and is expected to continue to decline as reserves are depleted.
As major projects were completed, a slowdown in mining activities, low prices for PNG’s petroleum and a tightening in government expenditure, led to a slowdown of the growth rate to 3.1 per cent during 1994. A decline in mineral revenues, employment bottlenecks, a slowdown in construction activity and loss of investor confidence are also responsible for this fall in economic growth.
From the above discussion on sectoral transformation in response to resources boom and policy management, it is clear the share of the mining sector to GDP rose unambiguously, whereas the contribution of the agricultural traded sector remained constant due to improved world prices for PNG’s export commodities. The cumulative effects of an increasing domestic price level adversely affected output of the manufacturing traded sector. Large fiscal deficits and an inward-looking trade regime over 1991-93 kept the domestic price level relatively higher than PNG’s major trading partners. The real exchange rate of PNG would have depreciated to a great extent with a more open trade regime and more disciplined fiscal policy. This impact on sectoral growth is also verified by the analytical framework and econometric results in Chapter 5.
6.10 Investment and Savings
This section discusses the effects of broad policy incentives laid out by the government in response to the resources booms on the long-term savings behaviour of PNG. The main policy focus for the mining and petroleum sectors in recent years was to promote foreign investment and a fair distribution of resource rents among the stakeholders. By clearly stating the rights of resource owners, making a fair return on investment and also taking into account the rights of state, landowners and local communities to share in the resulting benefit, the PNG government has been attempting to attract foreign as well as domestic investment to this sector. Another feature of this policy is that the government is taking out its equity share in all new mining projects and selling-off existing equity to nationals as investment matures. This, in turn, would transfer significant equity holdings to the national private sector (AusAID, 1995).
Over the first half of 1990s, the government showed strong support and encouragement for investment in the non-mining sectors. Establishment of industry corporations allowed the transfer of research and development to non-mining sectors. Other supporting policies include a progressive reduction in the existing tariff rate (set at around 40 per cent) and replacing import bans and quotas with tariffs. Exemption of import duty for selected inputs used by the non-mining exporters, the replacement of quantitative restrictions with tariffs for selected agricultural products, such as fruits, vegetables, beef, sugar and some small goods, had a positive impact on investment in the manufacturing sector. The next section discusses PNG’s public and private sector savings and investment performance over the last two and a half decades.
6.10.1 Contribution of Savings and Investment
Given the constraints on the mobilisation of foreign direct investment and other kinds of foreign resources, a sustainable rate of investment can only be achieved by a raising of the domestic savings rate. Investment is therefore crucially dependent on the overall economic condition that is conducive to mobilising both private and public savings and the ability to attract foreign savings and direct foreign investment.
From the late 1960s, investment policies of the PNG government have addressed these two key issues, as well as providing incentives to influence investment in specific key sectors. Private sector contribution to gross domestic savings and investment played a crucial role in the development of the economy as it had a positive and direct influence on the long-term growth of PNG.
During the 1970s, PNG’s investment and savings performances were high enough to build a foundation for long-term growth. Between 1970 to 1972, the contribution of gross domestic investment to GDP was 40 per cent, funded mainly by foreign savings and direct foreign investment. During 1973-76, the contribution of gross domestic investment to GDP declined sharply with the completion of the BCL mine and the lack of new foreign investment projects.
The share of gross domestic savings to GDP began to rise from 1972 and accounted for 28 per cent of GDP on average over 1973-76. Gross national savings
Table 6.18 Investment and savings, 1970–94 (percentage share of GDP)

also rose to 19 per cent of GDP on average over this period and resulted in a positive resources gap which accounted for 10 per cent of GDP (Table 6.18).
Between 1977-80, the share of investment to GDP increased compared with the previous period and both national and domestic savings remained at comfortably high levels.
These figures indicate the PNG government was wise to utilise its windfall gain from the first two major resources booms of the 1970s and to save a large portion of its windfall, facilitating economic development in later years. During the 1980s, PNG’s share of investment to GDP was comparable with other lower middle income countries of the world. Between 1981-85, gross domestic investment averaged around 27 per cent of GDP and a large share of this was in the form of direct foreign investment. Over the first half of the 1980s, both domestic and national savings declined due to unfavourable economic conditions but regained a satisfactory level during the second half of the 1980s.
In 1991, gross domestic investment reached a peak of 28 per cent of GDP and declined over the next three years due to a reduction in mining investment. Among other factors, instability in government policy relating to resource development was the major factor in explaining this declining trend of gross domestic investment over the period.
During 1991-94, private sector investment averaged about 17 per cent of GDP, but public sector investment fell to about 5 per cent over the period (Table 6.19). Until 1992, domestic investment was funded mainly by private and foreign savings. From 1992, major investment projects were solely funded by domestic private savings as foreign and public savings continued to decline. The share of private savings to GDP declined substantially in 1993, as the private sector was called on to finance
Table 6.19 Gross domestic investment and gross national savings, 1991–94 (percentage share of GDP)
| 1991 | 1992 | 1993 | 1994 | |
|
|
||||
| Gross domestic investment | 28.0 | 23.8 | 18.8 | 16.3 |
| Private investment | 23.3 | 18.6 | 12.5 | 13.2 |
| Mining | 15.9 | 11.1 | 4.6 | 5.0 |
| Non–mining | 7.4 | 7.5 | 7.9 | 8.2 |
| Public investment | 4.7 | 5.2 | 6.3 | 3.1 |
| Gross national savings | 23.4 | 26.0 | 31.4 | 27.0 |
Source: AusAID (1996), constructed from various Tables.
large budget deficits and to make up the shortfall in foreign financing of government transactions. Despite the large capital flight during 1992–93, and significant public and foreign dis-saving since 1992 as a result of large debt repayments by the government and diminished confidence by investors in the mining sector, private saving’s contribution averaged 30 per cent of GDP over 1991–93. Thus, private sector savings have played an important role in building up the necessary capital stock conducive to the long-term growth of the country.
Private sector savings behaviour clearly indicates the consumption smoothing behaviour which supports the central theme of the theory of ‘construction boom’ by the private sector. The econometric results in Chapter 5 confirmed that there is a significant positive effect of real GDP growth (contributed mainly by the increased windfall income) on the private and total savings of the nation. These empirical and econometric findings indicate the farsightedness of private sector savings decisions.
6.11 Summary and Conclusion
This chapter has examined the policy responses by the government to resources booms during the 1970s (the BCL investment boom in 1971–72, the copper boom in 1973–74 and the agricultural boom in 1976–77) and the 1990s (the mineral boom during 1992–93) and their effect on the long-term growth of the country. These booms have impacted significantly upon the sectoral composition of output. The overall policy response to these shocks were admirably positive in insulating the economy during the 1970s, as indicated by the average depreciation of real exchange rate and a more even distribution of income. The share of the agricultural and manufacturing sectors to GDP increased significantly during the second half of the 1970s, indicating that, although the economy was moderately affected by the ‘Dutch disease’ type of phenomenon in the early 1970s, prudent macroeconomic policies in the second half of the 1970s moderated these adverse resources boom effects.
On the other hand, an undisciplined fiscal stance in the early 1990s brought about considerable economic problems for PNG, as the real exchange rate appreciated significantly and reduced external competitiveness in the 1991–93 period. Following an improvement in world market prices for PNG agricultural commodities, the implementation of radical wage reform in 1992, and flotation of the kina in 1994, PNG has managed to regain its external competitiveness to a great extent.
Long-term policy effects indicate that, despite some adverse economic events and large public sector dis-saving in the early years of the 1990s, the contribution of domestic private savings to gross domestic investment was encouraging. The increased savings during the boom years also indicated consumption smoothing behaviour by the private sector, confirming the theoretical propositions of construction booms in PNG.
Notes
1 Until 1977, PNG had a July-June fiscal year. Beginning in 1978, the fiscal year was changed to coincide with the calendar year.
2 As mentioned earlier the discussion of the investment and mineral boom from the early 1980s associated with the Ok Tedi mine establishment follows a similar analytical interpretation to that of investment and mineral booms in the early 1970s associated with the BCL mine.
3 The figures reported here need to be taken cautiously because they referred to minimum wages and the lowered minimum wages generally applied only to new entrants.