
Statistical Appendix:
Supplem entary Statistical Tables, Notes and Basic Data
Appendix to Chapter 3


Table A3.2 Growth rate of real GDP and inflation in Papua New Guinea, 1970–95 1990=100
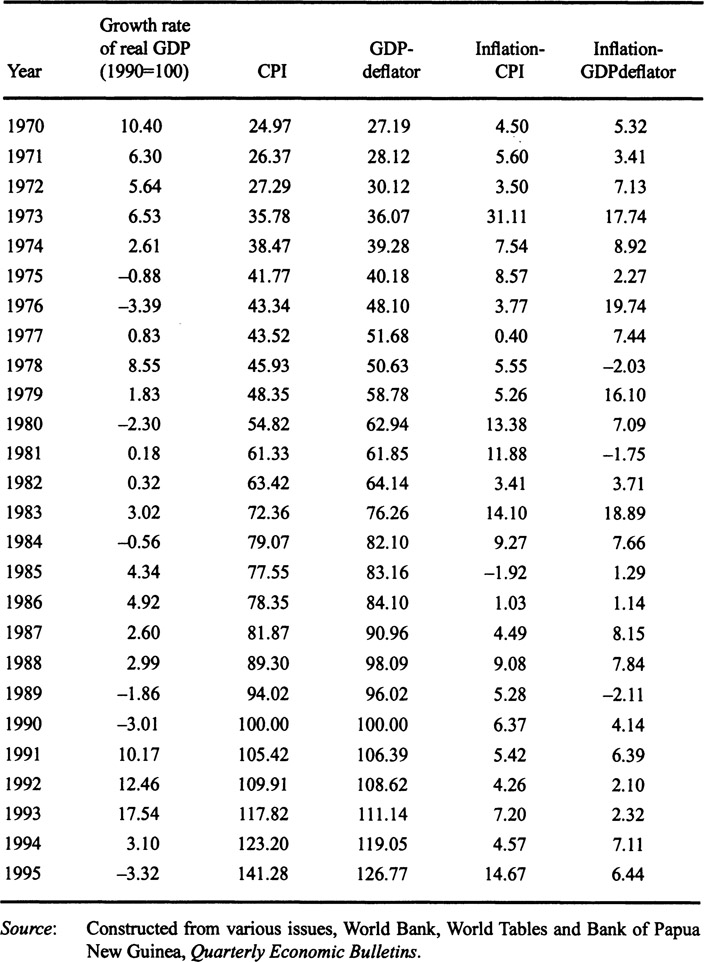
Table A3.3 Government revenues and expenditures, 1971–2000 (current prices, kina million)
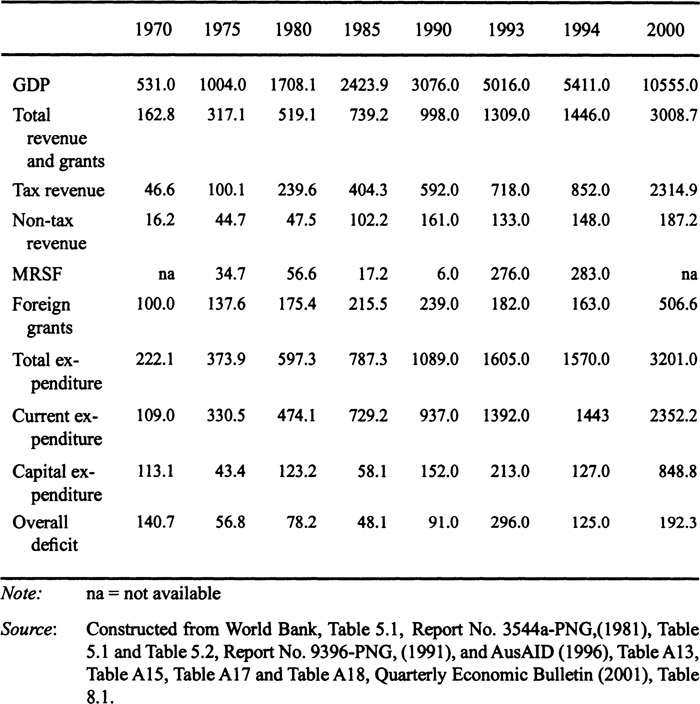
Table A3.4 Minerals and agricultural exports of PNG, 1971–2000 (current prices, US dollar million)
| Year | Mining exports | Agricultural exports | Non–mining exports | Total exports* |
|
|
||||
| 1971 | 0.62 | 53.24 | 67.50 | 89.67 |
| 1972 | 19.40 | 43.09 | 58.72 | 106.85 |
| 1973 | 88.62 | 37.66 | 51.73 | 160.72 |
| 1974 | 216.32 | 68.66 | 100.53 | 333.75 |
| 1975 | 182.48 | 99.71 | 123.50 | 321.86 |
| 1976 | 159.11 | 82.32 | 101.91 | 287.32 |
| 1977 | 147.26 | 227.52 | 267.89 | 438.37 |
| 1978 | 164.65 | 148.18 | 189.36 | 400.16 |
| 1979 | 254.96 | 196.32 | 243.39 | 538.75 |
| 1980 | 216.01 | 154.30 | 214.00 | 471.81 |
| 1981 | 201.40 | 110.62 | 164.89 | 379.49 |
| 1982 | 224.29 | 121.58 | 180.12 | 422.84 |
| 1983 | 309.67 | 192.15 | 245.10 | 570.54 |
| 1984 | 290.85 | 338.73 | 420.35 | 731.58 |
| 1985 | 489.90 | 330.20 | 409.60 | 926.20 |
| 1986 | 544.36 | 321.94 | 402.07 | 970.78 |
| 1987 | 650.56 | 244.70 | 355.63 | 1022.11 |
| 1988 | 749.51 | 222.02 | 313.37 | 1092.72 |
| 1989 | 601.73 | 240.39 | 333.22 | 989.32 |
| 1990 | 727.20 | 196.42 | 280.70 | 1077.50 |
| 1991 | 955.04 | 194.37 | 289.94 | 1320.98 |
| 1992 | 1330.36 | 369.57 | 475.79 | 1806.72 |
| 1993 | 1732.44 | 674.24 | 744.02 | 2476.46 |
| 1994 | 1693.85 | 836.00 | 854.05 | 2547.90 |
| 1995 | 1837.51 | 379.06 | 348.58 | 2565.15 |
| 1996 | 1695.35 | 437.02 | 370.63 | 2502.99 |
| 1997 | 1281.90 | 541.79 | 309.65 | 2132.64 |
| 1998 | 1190.74 | 495.41 | 104.60 | 1790.75 |
| 1999 | 1382.11 | 456.91 | 116.21 | 1955.23 |
| 2000 | 1628.39 | 346.18 | 120.09 | 2098.66 |
Notes: *Some total export entries are not equal to the sum of mining exports and non–mining exports because of omission of other minor export items and re–exports.
Source: Constructed from Bank of Papua New Guinea, Quarterly Economic Bulletin (various issues), AusAID (1996).
Table A3.5 Minerals and agricultural exports of PNG, 1971–2000 (current prices, kina million)
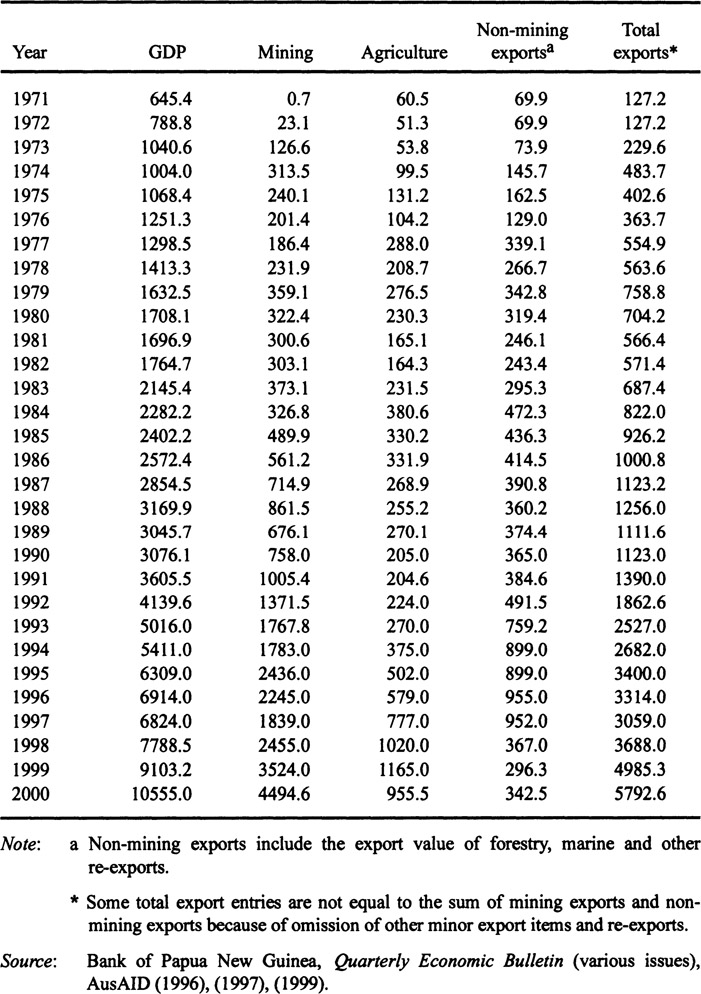
Table A3.6 Total labour force and wage employment in PNG, 1968–95 (persons)

Appendix to Chapter 4
Table A4.1 Nominal and real exchange rate indices, 1970–94 (1990=100)

Table A4.2 Test for unit roots
| Variables | Data series | DF/ADF Statistics Ho: I(1) versus Ha: I(0) |
|
|
||
| Real income (real GDP) | Y | −2.25(1) |
| Trade-weighted real exchange rate | RER1 | −4.25(0)* |
| Real exchange rate defined as EPI/CPI | RER2 | −3.31(0)* |
| Real exchange rate defined as IPI/CPI | RER3 | −2.27(0) |
| Nominal effective exchange rate | NEER | −1.37(0) |
| External terms of trade | TOT | −3.41(0)* |
| Openness of trade regime | OP | −1.65(0) |
| Money supply | MS | −2.09(0) |
| Government expenditure to GDP | GEX | 1.00(0) |
| Gross investment to GDP | GIY | −4.45(0)* |
| Lag net long-term capital inflow | NKI | −2.64(0) |
| Foreign aid flow | AID | −14.49(0)* |
| Nominal devaluation | NDEV | −96.36(0)* |
Note: The critical value of null hypothesis of nonstationarity at the 10-per-cent level is−3.13 with total number of observation n = 23.
The null hypothesis of rejecting there is no serial correlation lies outside 1.54<d<2.46.
The null hypothesis of rejecting there is no 1st order autocorrelation lies outside −1.96<h<1.96.
*indicates the rejection of null hypothesis. Figures in parentheses indicate the number of lags on the differenced variable used in the auxiliary regression to achieve residual whiteness.
Appendix to Chapter 5
Table A5.1 Test for unit roots
| Variables | Data series | DF/ADF Statistics Ho: I(1) versus Ha: I(0) |
|
|
||
| Per capita GDP | PCY | −1.62(1) |
| Financial Institutional development | FD | −83.62(0)* |
| Non-mining GDP | NMY | −1.69(1) |
| Domestic absorption | DA | −3.16(0)* |
| Government consumption | GC | −1.97(1) |
| Gross investment to GDP | GIY | −4.45(0)* |
| Net official transfers | OT | −3.14(0)* |
| Consumer price index | CPI | −1.25(1) |
| GDP deflator | DEF | −1.72(1) |
| Nontradable price index | PNT | −2.50(0) |
| Agricultural value added | AVA | −2.77(0) |
| Manufacturing value added | MVA | −2.54(0) |
| Nontradable sector | NT | −3.89(0)* |
| Construction sector | CONS | −3.20(0)* |
| Gross domestic savings | RDS | −1.85(0) |
| Private savings | PS | −2.52(0) |
| Foreign savings | FS | −4.12(0)* |
| Real interest rate | RIR | −2.06(0) |
| Expected rate of inflation | INF | −3.73(0)* |
Note: The critical value of null hypothesis of nonstationarity at the 10-per-cent level is −3.13 with total number of observation n = 23.
The null hypothesis of rejecting there is no serial correlation lies outside 1.54<d<2.46.
The null hypothesis of rejecting there is no 1st order autocorrelation lies outside −1.96<h<1.96.
*indicates the rejection of null hypothesis. Figures in parentheses indicate the number of lags on the differenced variable used in the auxiliary regression to achieve residual whiteness.
Appendix to Chapter 6
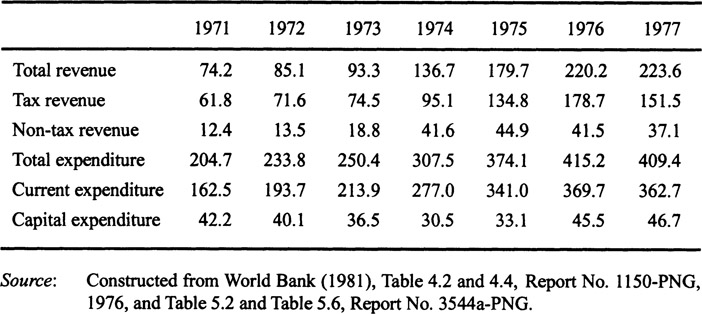
Table A6.1 Central government revenues and expenditures, 1971–77 (kina million)
Appendix to Chapter 7
Table A7.1 Index of government consumption and domestic absorption in PNG, Indonesia and Nigeria, 1970–84 (1970=100)
