Example 3.10. Reporting on Multiple-Response Survey Data
Goal
Summarize responses to survey questions for which the respondent can select one or more responses. Tally the number of times a response for a question was selected and the percentage of the total number of respondents that this count represents. Summarize fill-in-the blank numeric responses with selected statistics.
Report
    Customer Survey Results: 120 Respondents

    Factors Influencing the Decision to Buy

      ------------------------------------
      |                  | Count |Percent|
      |------------------+-------+-------|
      |Cost              |     87|  72.5%|
      |------------------+-------+-------|
      |Performance       |     62|  51.6%|
      |------------------+-------+-------|
      |Reliability       |     30|  25.0%|
      |------------------+-------+-------|
      |Sales Staff       |    120| 100.0%|
      ------------------------------------


             Source of Company Name

      ------------------------------------
      |                  | Count |Percent|
      |------------------+-------+-------|
      |TV/Radio          |     92|  76.6%|
      |------------------+-------+-------|
      |Internet          |     69|  57.5%|
      |------------------+-------+-------|
      |Word of Mouth     |     26|  21.6%|
      ------------------------------------


             Visits Resulting in Sales

      -------------------------------------
      |                  |       |Average |
      |                  |       | Visits |
      |                  | Total |  Per   |
      |                  |Visits |Customer|
      |------------------+-------+--------|
      |Website           |    279|     2.3|
      |------------------+-------+--------|
      |Store             |    327|     2.7|
------------------------------------- |
Example Features
| Data Set | CUSTRESP |
| Featured Step | PROC TABULATE |
| Featured Step Statements and Options | TABLE statement: PCTN statistic with denominator definition |
| Formatting Features | System Option: FORMDLIM when sending output to the LISTING destination Picture Format |
| Additional Features | Macro programming SAS file input/output functions |
| Working with SAS Functions | |
| ODS Enhanced Versions of This Example | Examples 6.13 and 6.14 |
| Other Examples That Use This Data Set | Examples 6.13 and 6.14 |
Example Overview
The three tables in this report present information on the customers of a business where products can be purchased either in a store or online.
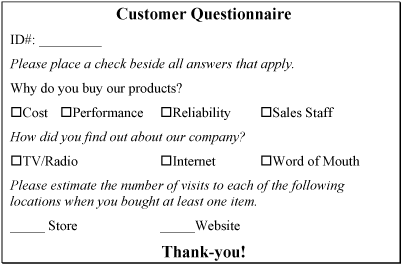
Each observation in CUSTRESP corresponds to one customer’s responses to three questions that have a total of nine possible responses. The first question relates to influences on decisions to buy a product and asks the customer to select up to four check boxes in response. The second question relates to the customer’s source in finding the company name and asks the customer to select up to three check boxes. The responses to the last question are numerical values that the customer provides for the number of visits to the company’s Web site and the number of visits to the company’s store.
Note that the three tables are placed on one page. When sending the report to the LISTING destination, setting the SAS option FORMDLIM keeps the tables on one page. Examples 6.13 and 6.14 show how to send the same report to a nonlisting destination.
In order to create three tables with different titles, three PROC TABULATE steps are required. If it is not necessary to have different titles, the report can be produced with one PROC TABULATE step and three TABLE statements.
Collecting the Data
Figure 3.10 shows the survey form used to collect data.
Figure 3.10. Survey Form Used to Collect Data
Program
|
| A Closer Look |
Working with SAS Functions
You can customize the presentation of information in your reports by applying SAS functions. Because these functions can be executed by macro language code, you may be able to avoid the extra processing of a DATA step or procedure. The results returned by the functions can provide text and summary information for your reports. Commonly, these features add text to titles, footnotes, and summary lines in reports. For example, you could add these types of customizations to LINE statements in a COMPUTE block in PROC REPORT.
The two macro functions, %SYSFUNC and %QSYSFUNC, and the macro statement %SYSCALL provide a means to apply functions or call routines and save the results in a macro variable. The macro variable can then be referenced in subsequent steps of the program. Many SAS functions and call routines can be used with these features.
The %QSYSFUNC function does the same task as %SYSFUNC and provides the additional feature of masking specific characters. Macro quoting and masking are beyond the scope of this book. Refer to SAS documentation (support.sas.com/v9doc) and SAS Press books (support.sas.com/saspress) for thorough discussions of these topics.
The example above used %SYSFUNC and the ATTRN function to obtain the number of nondeleted observations in the analysis data set. There are many other arguments that can be applied to ATTRN to obtain other information, as well as many other functions that you might find useful in customizing your reports.
Some of the customizations you can achieve with SAS functions include:
| □ | formatting dates and times |
| □ | applying a format defined by PROC FORMAT to a value |
| □ | confirming the existence of data sets and other files |
| □ | obtaining information about data sets, external files, and directories |
For example, you can format today’s date in your title with the WORDDATE format:
title "Customer Survey Results as of
       %sysfunc(date(),worddate.): &nresps Respondents";
If the report was produced on January 10, 2005, the title would look like this:
Customer Survey Results as of January 10, 2005: 120
Respondents
Similarly, you can add these customizations to LINE statements in your PROC REPORT steps. The following example puts the date and time that the analysis data set was last modified at the end of the report.
Submit the following macro language statements before the PROC REPORT step. The macro variable MODIFIED holds the date and time of last modification of the WORK.CUSTRESP data set.
   %let dsid=%sysfunc(open(work.custresp,i));
   %let modified=%sysfunc(attrn(&dsid,modte));
   %let rc=%sysfunc(close(&dsid));
Adding the following COMPUTE block to a PROC REPORT step lists the last modification of the data set at the end of the report.
   compute after;
     line ' ';
     line '**********************************************';
     line "Analysis Data Set Last Modified:
           %sysfunc(putn(&modified,datetime16.))";
     line '**********************************************';
   endcomp;
Here is an example of the text that this COMPUTE block produces.
   *************************************************
   Analysis Data Set Last Modified: 28OCT05:10:10:24
   *************************************************
Remember that when you use %SYSFUNC you do not need to enclose character values in quotation marks as you do when using the functions in DATA steps.
Also, remember that you cannot nest functions within a single %SYSFUNC. You can, however, nest %SYSFUNC calls; each function must be invoked by being called by its own %SYSFUNC.
Where to Go from Here
The FORMDLIM SAS System Option. See “SAS System Options” in SAS 9.1 Language Reference: Dictionary.
PROC FORMAT reference, usage information, and additional examples. See “The FORMAT Procedure” in the “Procedures” section of Base SAS 9.1 Procedures Guide.
PROC TABULATE reference, usage information, and additional examples. See “The TABULATE Procedure” in the “Procedures” section of Base SAS 9.1 Procedures Guide.
SAS File Input/Output Functons. See “Functions and CALL Routines” in SAS 9.1 Language Reference: Dictionary.
SAS Macro Programming. In the “Understanding and Using the Macro Facility” section of SAS 9.1 Macro Language: Reference, see “Macro Variables” and “Using SAS Language Functions in the DATA Step and Macro Facility” in the “Interfaces with the Macro Facility” section. Also see “Macro Language Dictionary.”
Working with Dates. See “Dates, Times, and Intervals” in the “SAS System Concepts” section of SAS 9.1 Language Reference: Concepts; the “Date and Time” category of formats described in the “Formats” section of SAS 9.1 Language Reference: Dictionary; and the “Date and Time” category of functions and call routines described in “Functions and Call Routines by Category” in the “Functions and Call Routines” section of SAS 9.1 Language Reference: Dictionary.
Working with Formats. See “Formats and Informats” in “SAS Language Elements” in the “SAS System Concepts” section of SAS 9.1 Language Reference: Concepts, and “Formats,” in SAS 9.1 Language Reference: Dictionary.