
Example 6.15. Organizing Results into Tables Using ODS
Goal
Organize into tables selected analyses saved in the output data set created by Example 3.2. Send the results to a nonlisting destination.
Report

Example Features
| Data Set | BREADSTATS |
| Report Example | Output data set created by Example 3.2 |
| Featured Steps and Statement | PROC TEMPLATE
DATA step ODS statement |
| Featured Step Statements and Options | PROC TEMPLATE
Statements within table definition:
ODS statement: STARTPAGE= option DATA step: FILE PRINT ODS= statement |
| Output Destination of Example | RTF |
| Doing More with ODS | |
| Other Examples That Use This Data Set | Examples 3.2 and 6.5 |
Example Overview
The program in Example 3.2 summarized nutritional data for a sample of bread products. Its goal was to identify products with the lowest calories and highest dietary fiber in several categories. The results of analyses of specific combinations of the four classification variables were saved in an output data set.
A simple PROC PRINT of the output data set created by Example 3.2 would adequately display the results. Figure 3.2b presents such a listing. This example, however, selects specific analyses from the output data set and presents them in a customized tabular format using ODS and DATA steps.
The DATA steps select observations from the output data set based on the variable _TYPE_ that PROC MEANS adds to the output data set. The variable _TYPE_ identifies the analysis classification to which the observation belongs. Each classification is assigned a number.
The report in this example shows one table with overall statistics, two tables with one classification variable, and one table with two classification variables. A separate DATA step creates each of the four tables.
PROC TEMPLATE creates one table definition that each of the DATA steps references. The table definition specifies columns for the most complex of the four analyses, which is the one with the two classification variables. The other three tables each reference the same definition, but only use the necessary number of classification columns found in the specific analysis.
The ODS STARTPAGE=NO statement keeps the three simplest tables on one page. The final table, the one with the two classification variables, is on its own page. The ODS STARTPAGE=NOW statement forces the fourth table to a new page.
Program
| Run PROC TEMPLATE to create a table definition for the output from this report. | proc template; |
| Begin the table definition and assign it the name “categories.” | define table categories; |
| Name a macro variable that the table definition will reference. | mvar titleone; |
| Define a symbol whose value will be assigned when the DATA step executes. | dynamic categoryheader; |
| Specify the columns in the order they should appear in the tables. Enclose the column symbols in parentheses so that the results within a symbol are listed in rows rather than columns. In this example, there are three results for the minimum calories and three results for the maximum fiber. If the symbols were not enclosed in parentheses, the values for the three results would be listed side-by-side in column cells rather than sequentially in rows. | column (category1) (category2)
(calories) (mincal)
(fiber) (maxfiber); |
| Declare a symbol as a header in the table. | header table_header_1; |
| Specify a definition for the symbol TABLE_HEADER_1, which is the header for the table. | define table_header_1; |
| Specify the text of the header. When the definition executes, insert the resolved value of the macro variable TITLEONE in the text. (The macro variable TITLEONE was referenced above on the MVAR statement.) Note that in this context, do not precede the macro variable name with an ampersand so that the macro variable will resolve whenever the definition executes. An ampersand used with a macro variable in a definition causes the macro variable to be resolved when the definition is compiled instead of when the definition executes. | text 'Results ' titleone;
end; |
| Specify a definition for the symbol CATEGORY1, which is the first column in the table definition. | define category1; |
| Designate that the column definition can be used by more than one column definition. | generic=on; |
| Specify that the text for the header associated with CATEGORY1 is the dynamic symbol CATEGORYHEADER, which will be resolved when the DATA step executes. | header=categoryheader;
end; |
| Specify a definition for the symbol CATEGORY2, which is the second column in the table definition. | define category2; |
| Designate that the column definition can be used by more than one column definition. | generic=on; |
| Specify that the text for the header associated with CATEGORY2 is the dynamic symbol CATEGORYHEADER, which will be resolved when the DATA step executes. | header=categoryheader;
end; |
| Specify the definitions for the remaining columns in the table. Supply text for the headings and add the attribute of center justification to two of the columns. | define calories;
generic=on;
header='Lowest Calories';
end;
define mincal;
generic=on;
header='kcal';
style={just=center};
end;
define fiber;
generic=on;
header='Highest Fiber';
end;
define maxfiber;
generic=on;
header='grams';
style={just=center};
end;
end;
run; |
| Do not send results to the LISTING destination. | ods listing close; |
| Send subsequent results to the RTF destination and save the results in a file. | ods rtf file='c: eportsexample32b.rtf' |
| Suppress the automatic insertion of new pages at the start of each procedure. | startpage=no; |
| Display the first table, which contains the overall statistics and no classification columns. | /* Start Table 1 */ |
| Assign a value to the macro variable that is referenced on the MVAR statement in the CATEGORIES table definition, which in turn places the resolved value of the macro variable in the table header. | %let titleone=Overall; |
| Do not create a data set and instead just process the observations in the BREADSTATS data set. | data _null_; |
| Select results from the data set that was created in Example 3.2 by referencing the automatic variable _TYPE_ that PROC MEANS creates. Select the overall results, which correspond to _TYPE_=0. | set breadstats(where=(_type_=0)); |
| Define six character variables that will contain the identifiers of the three products with the lowest calories and the three products with the highest fiber. For each of the three products with the lowest calories and for each of the three products with the highest fiber create one variable that fully identifies a product by concatenating the three identifiers. | length fullcal1 fullcal2 fullcal3
fullfiber1 fullfiber2 fullfiber3 $ 50;
fullcal1=catx(' ',wherecal_1,flourcal_1,typecal_1);
fullcal2=catx(' ',wherecal_2,flourcal_2,typecal_2);
fullcal3=catx(' ',wherecal_3,flourcal_3,typecal_3);
fullfiber1=catx(' ',
wherefiber_1,flourfiber_1,typefiber_1);
fullfiber2=catx(' ',
wherefiber_2,flourfiber_2,typefiber_2);
fullfiber3=catx(' ',
wherefiber_3,flourfiber_3,typefiber_3); |
| Create an ODS output object by binding the variables in the data set to the CATEGORIES table definition. | file print ods=(template='categories' |
| Repeat the column symbols three times and assign a different variable each time to the symbol. For the CALORIES and MINCAL symbols, list the product identifiers and calories for the three products with the lowest calories. For the FIBER and MAXFIBER symbols, list the product identifiers and fiber values for the three products with the highest fiber. Since each of these symbols was enclosed in parentheses in the table definition, ODS stacks the three values for each symbol in the same column. | columns=(calories=fullcal1(generic=on)
calories=fullcal2(generic=on)
calories=fullcal3(generic=on)
mincal=mincal_1(generic=on)
mincal=mincal_2(generic=on)
mincal=mincal_3(generic=on)
fiber=fullfiber1(generic=on)
fiber=fullfiber2(generic=on)
fiber=fullfiber3(generic=on)
maxfiber=maxfiber_1(generic=on)
maxfiber=maxfiber_2(generic=on)
maxfiber=maxfiber_3(generic=on))); |
| Write the observation’s data to the report using the template specified on the FILE PRINT statement. | put _ods_; run; |
| Display the second table, which contains statistics for one classification variable, SOURCE, the source of the product. | /* Start Table 2 */ %let titleone=by Source; data _null_; |
| Select the results for the categories of SOURCE, which correspond to _TYPE_=8. | set breadstats(where=(_type_=8)); |
| Repeat the process of defining identifiers as was shown in the DATA step that created the first table. | length fullcal1 fullcal2 fullcal3
fullfiber1 fullfiber2 fullfiber3 $ 50;
fullcal1=catx(' ',wherecal_1,flourcal_1,typecal_1);
fullcal2=catx(' ',wherecal_2,flourcal_2,typecal_2);
fullcal3=catx(' ',wherecal_3,flourcal_3,typecal_3);
fullfiber1=catx(' ',
wherefiber_1,flourfiber_1,typefiber_1);
fullfiber2=catx(' ',
wherefiber_2,flourfiber_2,typefiber_2);
fullfiber3=catx(' ',
wherefiber_3,flourfiber_3,typefiber_3); |
| Create an ODS output object by binding the variables in the data set to the CATEGORIES table definition. | file print ods=(template='categories' |
| Place the values of the classification variable, SOURCE, in the column that corresponds to CATEGORY2. | columns=(category2=source(generic=on |
| Assign a heading to the column that contains the values of the classification variable SOURCE. | dynamic=(categoryheader='Source')) |
| Repeat the column symbols three times as was described for the same code for the first table. | calories=fullcal1(generic=on)
calories=fullcal2(generic=on)
calories=fullcal3(generic=on)
mincal=mincal_1(generic=on)
mincal=mincal_2(generic=on)
mincal=mincal_3(generic=on)
fiber=fullfiber1(generic=on)
fiber=fullfiber2(generic=on)
fiber=fullfiber3(generic=on)
maxfiber=maxfiber_1(generic=on)
maxfiber=maxfiber_2(generic=on)
maxfiber=maxfiber_3(generic=on))); |
| Write the observation’s data to the report using the template specified on the FILE PRINT statement. | put _ods_; run; |
| Display the third table, which contains statistics for one classification variable, TYPE, the bread type. | /* Start Table 3 */ %let titleone=by Type; data _null_; |
| Select the results for the categories of TYPE, which correspond to _TYPE_=1. | set breadstats(where=(_type_=1)); |
| Repeat the process of defining identifiers as was shown in the DATA step that created the first table. Do not include TYPE in the identifier, since its values will be placed instead in the CATEGORY2 column. | length fullcal1 fullcal2 fullcal3
fullfiber1 fullfiber2 fullfiber3 $ 30;
fullcal1=catx(' ',wherecal_1,flourcal_1);
fullcal2=catx(' ',wherecal_2,flourcal_2);
fullcal3=catx(' ',wherecal_3,flourcal_3);
fullfiber1=catx(' ',wherefiber_1,flourfiber_1);
fullfiber2=catx(' ',wherefiber_2,flourfiber_2);
fullfiber3=catx(' ',wherefiber_3,flourfiber_3); |
| Create an ODS output object by binding the variables in the data set to the CATEGORIES table definition. | file print ods=(template='categories' |
| Place the values of the classification variable, TYPE, in the column that corresponds to CATEGORY2. | columns=(category2=type(generic=on |
| Assign a heading to the column that contains the values of the classification variable TYPE. | dynamic=(categoryheader='Source'))dynamic= |
| Repeat the column symbols three times as was described for the same code for the first table. | calories=fullcal1(generic=on)
calories=fullcal2(generic=on)
calories=fullcal3(generic=on)
mincal=mincal_1(generic=on)
mincal=mincal_2(generic=on)
mincal=mincal_3(generic=on)
fiber=fullfiber1(generic=on)
fiber=fullfiber2(generic=on)
fiber=fullfiber3(generic=on)
maxfiber=maxfiber_1(generic=on)
maxfiber=maxfiber_2(generic=on)
maxfiber=maxfiber_3(generic=on))); |
| Write the observation’s data to the report using the template specified on the FILE PRINT statement. | put _ods_; run; |
| Force the next table to start on a new page. | ods rtf startpage=now; |
| Display the fourth table, which should contain statistics for two classification variables, SOURCE and BRAND. | /* Start Table 4 */ %let titleone=by Source and Brand; data _null_; |
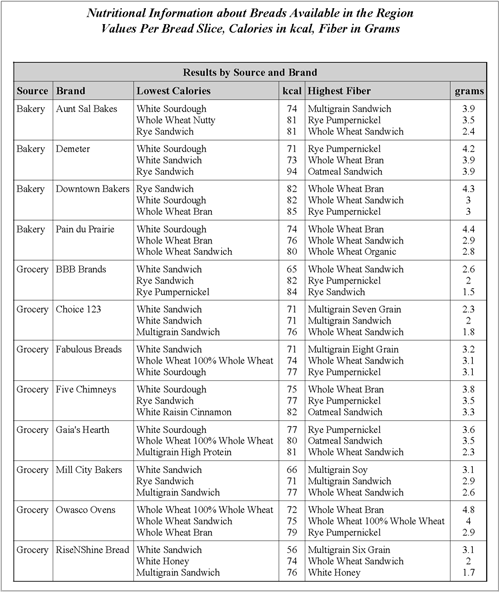
| Select the results for the categories of the combinations of the two variables, SOURCE and BRAND, which correspond to _TYPE_=12. | set breadstats(where=(_type_=12));
length fullcal1 fullcal2 fullcal3
fullfiber1 fullfiber2 fullfiber3 $ 30; |
| Repeat the process of defining identifiers as was shown in the DATA step that created the first table. Do not include BRAND in the identifier, since its values will be placed instead in the CATEGORY2 column. | fullcal1=catx(' ',flourcal_1,typecal_1);
fullcal2=catx(' ',flourcal_2,typecal_2);
fullcal3=catx(' ',flourcal_3,typecal_3);
fullfiber1=catx(' ',flourfiber_1,typefiber_1);
fullfiber2=catx(' ',flourfiber_2,typefiber_2);
fullfiber3=catx(' ',flourfiber_3,typefiber_3); |
| Create an ODS output object by binding the variables in the data set to the CATEGORIES table definition. | file print ods=(template='categories' |
| Place the values of the classification variable SOURCE in the column that corresponds to CATEGORY1. | columns=(category1=source(generic=on
dynamic=(categoryheader='Source'))
category2=brand(generic=on |
| Place the values of the classification variable BRAND in the column that corresponds to CATEGORY2. | dynamic=(categoryheader='Brand')) |
| Repeat the column symbols three times as was described for the same code for the first table. | calories=fullcal1(generic=on)
calories=fullcal2(generic=on)
calories=fullcal3(generic=on)
mincal=mincal_1(generic=on)
mincal=mincal_2(generic=on)
mincal=mincal_3(generic=on)
fiber=fullfiber1(generic=on)
fiber=fullfiber2(generic=on)
fiber=fullfiber3(generic=on)
maxfiber=maxfiber_1(generic=on)
maxfiber=maxfiber_2(generic=on)
maxfiber=maxfiber_3(generic=on))); |
| Write the observation’s data to the report using the template specified on the FILE PRINT statement. | put _ods_; run; |
| Terminate sending output to the RTF destination. | ods rtf close; |
| Send subsequent output to the LISTING destination. | ods listing; |
|
| A Closer Look |
Doing More with ODS
This example demonstrates that when you use ODS, the more difficult part of programming your analyses can be the presentation of the output rather than the production of the analyses. ODS provides you with many ways to present your reports. This example showed you that you can create a template that can be reused.
A thorough discussion of ODS features is beyond the scope of this book. For more information, consult these references:
| □ | SAS 9.1 Output Delivery System: User’s Guide (support.sas.com/v9doc) |
| □ | SAS Press books (support.sas.com/saspress) |
| □ | SUGI conference proceedings (support.sas.com) |