Chapter 1: Introduction to Creating Graphs
Creating Graphs Using the Graph Template Language
Creating Graphs Using the Statistical Graphics Procedures
Creating Graphs Using the SAS ODS Graphics Designer
Effective Graphics and the Use of Decorative Skins
The Value of a Graph
A picture is worth a thousand words. It is debatable whether this is an old Chinese proverb, or whether it is an adage attributable to a notable historic figure such as Napoleon Bonaparte or Ivan Turgenev in 1862 or Fred R. Barnard in 1927. Whoever said it, the message is clear. For modern data analysis, information is easier to grasp and decode when it is presented in an appropriate visual form.
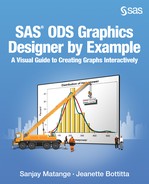
Figure 1.1 shows a table of the mean city and highway mileage, along with upper and lower confidence limits by car type for all cars in the Sashelp.Cars data set. The program to create this data set is shown in “Code for the First Example in Chapter 1” the appendix. Even for this small data set, it is not easy to get a good feel of city and highway mileage across car types.
Figure 1.1 Table of Car Data
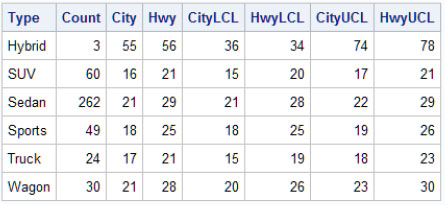
Figure 1.2 shows a simple bar chart of the same data. The graph plots the mean city and highway mileage by car type. It displays the upper and lower confidence limits and the sample size for each car type.
Figure 1.2 Same Car Data Shown in a Graph

Some inferences can be drawn from the graph in Figure 1.2 that are not obvious in the tabular view of the same data in Figure 1.1:
● Mileage for hybrid cars is significantly higher than for the other car types.
● Highway mileage is significantly higher than city mileage for all car types except hybrid.
● Confidence limits and sample size for each car type indicate reliability of the data.
SAS ODS Graphics software, first released with SAS 9.2, has made it very easy to obtain high-quality graphs with little effort in the following ways:
● Obtain automatic graphs from SAS analytical procedures.
● Create custom graphs using the Graph Template Language (GTL).
● Create custom graphs using the statistical graphics (SG) procedures.
● Create custom graphs using the interactive ODS Graphics Designer (the designer).
All of these methods create graphs using a common underlying graphics system based on GTL. Graphs from any method can be used together in your reports with a consistent appearance. Let’s now take a brief look at the benefits and audience for each of the methods.
Automatic Graphs
Starting with SAS 9.2, high-quality graphs are automatically produced by many Base SAS, SAS/STAT, SAS/QC, SAS/ETS, and SAS High-Performance Forecasting procedures by merely switching on the ODS Graphics system. No additional graphics coding is required by the user.
Automatic graphs are produced by using the following statements in your program:
ods graphics on / options;
procedure statements;
ods graphics off;
Note: Starting with SAS 9.3, ODS Graphics is set to ON by default for SAS procedures that support ODS Graphics when the procedures are executed in the SAS windowing environment.
When ODS Graphics is enabled, graphs and tables are created in the right order and written to the output destination as shown in the following example:
ods html;
ods graphics on;
ods select 'Analysis of Variance';
ods select 'Fit Plot';
proc reg data=sashelp.class;
model Weight = Height;
quit;
ods graphics off;
Figure 1.3 Output from the REG Procedure

The audience for these types of graphs is analysts or statisticians.
With SAS 9.2, for both the command line and windowing environment modes, ODS Graphics is off by default and graphics are not created automatically. The default destination is LISTING. In the previous code, the HTML destination is specified and ODS Graphics are enabled.
With SAS 9.3, in command line mode, ODS Graphics is off by default. The default destination is LISTING just like it is for SAS 9.2. However, in the windowing environment mode, ODS Graphics is on by default, and the default destination is HTML. This is a change from SAS 9.2.
For more information about automatic graphs produced from procedures, refer to the product documentation for SAS/STAT or for the SAS Output Delivery System.
Creating Graphs Using the Graph Template Language
Graph Template Language (GTL) syntax is the foundation of ODS Graphics. GTL is the syntax used to define the structure of a graph. GTL supports many different statements to define graphs that generally fall into one of the following categories:
● Single-cell graphs. Such graphs are commonly used in various domains, and they can span from the simple scatter plot to complex model-fit plots with multiple overlaid plots, legends, and statistics.
Figure 1.4 Single-Cell Graph
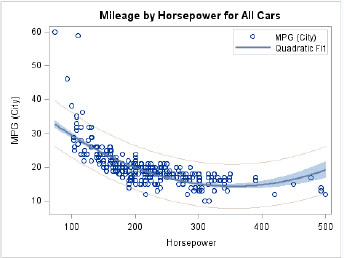
● Multi-cell ad hoc graphs with or without uniform axes. These graphs have multiple cells that can display data. The cells in this layout are in a regular grid that is specified by the user. Each cell can contain multiple overlaid graphs. The graph can have uniform or shared axes.
Figure 1.5 Multi-Cell Graph
● Multi-cell classification panels that are driven by one or more classification variables. The layout contains a regular grid of cells determined by the classification variables.
Figure 1.6 Classification Panel

The automatic graphs produced by SAS procedures like the one shown in Figure 1.3 use pre-defined GTL templates.
You can create your own graph templates using the TEMPLATE procedure and GTL. Then, you can associate the GTL template with your data using the SGRENDER procedure to create the graph.
GTL is a powerful and flexible language for defining the structure of many graphs, from the simplest single-cell graph to very complex paneled graphs. If you want to make persistent changes to the automatic graphs created by procedures, you need to modify the associated template. To do that, you need to have a good understanding of GTL. The audience for GTL is the advanced graph programmer.
The details of GTL can be found in SAS documentation. A detailed description of GTL is beyond the scope of this book.
Note: For SAS 9.3 and SAS 9.4, documentation for ODS Graphics is included in Base SAS documentation. For earlier releases of SAS, it is included in SAS/GRAPH documentation. This change was made because ODS Graphics became part of Base SAS starting with SAS 9.3. SAS/GRAPH is no longer required to use ODS Graphics.
Creating Graphs Using the Statistical Graphics Procedures
If you want to create custom graphs, and you don’t really need to make persistent changes to the automatic graphs created by procedures, you can often use the statistical graphics (SG) procedures. These are a set of value-added procedures that are built on top of GTL. These procedures surface a concise syntax to create most of the commonly used graphs in many usage domains. Here are the procedures:
● SGPLOT procedure for single-cell graphs
● SGPANEL procedure for classification panel graphs
● SGSCATTER procedure for comparative scatter plots and matrices
The details of these SG procedures can be found in SAS documentation. For SAS 9.3 and SAS 9.4, details are included in Base SAS documentation. For earlier releases, they are included in SAS/GRAPH documentation. Detailed descriptions of the SG procedures are beyond the scope of this book.
If you prefer to create graphs using procedure syntax, the SG procedures might be the right tools for you. The book Statistical Graphics Procedures by Example: Effective Graphs Using SAS provides a quick start to creating graphs using the SG procedures.
The audience for the SG procedures is the graph programmer.
Creating Graphs Using the SAS ODS Graphics Designer
By far, the easiest and fastest way to create a custom graph is by using the SAS ODS Graphics Designer (the designer). The designer is an interactive application, built on top of GTL, which you can use to easily create and design custom graphs.
The designer was developed for a user with one or more of the following characteristics:
● wants to quickly create a graph using an interactive application
● is not familiar with graph syntax and has no desire to learn it
● currently exports data to third-party software just to create graphs
● wants to create quick prototype graphs
● wants to learn the basics of GTL
The designer surfaces the necessary features of GTL in an interactive graphical interface application to create the most commonly used graphs in many domains with zero programming.
The following list highlights some of the tasks that you can accomplish using the interactive designer:
● begin a graph from a gallery of commonly used graphs for a quick start
● customize your graph by adding more plots and insets
● create single-cell graphs, classification panels, and ad hoc layouts
● view GTL code, which is generated while creating the graph
● save your custom graphs to the Graph Gallery for quick access
● save your graphs as SAS ODS Graphics Designer (SGD) files for future use or to share with others
● save your graphs as image files or in the following formats: HTML, PDF, EMF, and PS
● create a graph from the SGD file using the SGDESIGN procedure and send the output to the open ODS destinations with the same or different data
In this book, you learn how to do all of the above tasks and more. The designer is not only a great tool to create your graph, it is a great tool for learning GTL. You can see how GTL is put together every time you make a change to the graph. You can copy GTL code from the code window into the SAS program window and run the code.
By necessity, the designer does not support every feature in GTL. There might come a time when you are unable to make a customization using the designer that might be available in GTL. In this case, you can do most of your work in the designer, and then you can take the generated GTL code into the SAS program window for further customization.
The primary audience for the designer is the user who wants to create a graph using an interactive application. This user is often not familiar with procedure syntax for creating graphs. Users who are familiar with SG procedures or GTL syntax often find the designer useful for rapid prototyping.
Note: You cannot use the designer to customize GTL templates created by the TEMPLATE procedure. Also, you cannot use the designer to customize templates used by SAS procedures to create automatic graphs like the one in Figure 1.3. The reason is that the designer does not support all the features available in GTL, including conditional logic, function evaluation, and more. The templates used for automatic graphs are quite complex and specialized. Furthermore, the designer saves and reads only SGD files, which are essentially ZIP files of the various assets needed by the designer to create graphs. The designer does not read or write template files.
Effective Graphics and the Use of Decorative Skins
Graphs created by the designer are built with the principles of effective graphics in mind. By default, the designer always strives to create a graph that delivers the information with maximum clarity and minimum clutter.
Though initially designed with the statistical user in mind, these graphs are finding increasing usage in non-statistical domains. In these domains, there is often a desire for a flashier graph.
In SAS 9.3 and SAS 9.4, several plot types in the designer support an option that enables you to apply a decorative skin to the plot. For example, the bar chart type includes this option. This option does not change the shape of the bar; instead, it provides a flashier rendering. This option can be used at the discretion of the user. Some examples in this book use this option, such as Figure 1.6.