
Chapter 12 Intrusion Detection
Intrusion detection is an aspect of system management that lies, like many others, somewhere between a science and an art form. The main focus in this chapter is on enumerating a number of tools that generate information. This information is about the past and present state of your corporate IT infrastructure. Interpreting the information and understanding what it says are the most difficult parts of the process.
In this chapter, we rehash the ideas expressed in other sections of this book in terms of system hardening. Because servers are created to offer their services, they are exposed to various levels of risk. The task of the various intrusion detection tools is to monitor and, one hopes, maintain the integrity of these hosts.
The topic of intrusion detection is broken down into the following components:
![]() Reduction of a host’s risk
Reduction of a host’s risk
![]() Network intrusion detection
Network intrusion detection
![]() Host intrusion detection
Host intrusion detection
![]() Additional tools of the trade
Additional tools of the trade
By the end of this chapter, you should have a good grasp of the different aspects of monitoring for intrusions. In most cases, the best teacher is experience. This is true for both your ability to use the tools and the mindset you have as you work with them.
Defining Intrusions
For the purpose of this chapter, we expand on the standard definition of the term intrusion detection. Typically, intrusion detection is understood to be the ability to recognize that, at some point in time, unexpected access to resources was obtained. In most cases, it is assumed that there is a human driving the exploit. A broader, more general definition should also include malware. Though not a pure intrusion, malware can cause significant problems for systems and services.
MALWARE
Malware is defined as a category of software that, by design, attempts to inflict harm or damage to systems. Included in this class of programs are viruses and Trojans.
Other important members of the malware family are spyware, keyloggers, and password grabbers.
In the context of intrusion, malware can often be detected, not by its presence, but by the network traffic it generates.
The most commonly known form of intrusion is that obtained through a known vulnerability in an application. What is less advertised is access obtained by attackers through applications that were inadvertently exposed beyond their intended scope.
As long as there are hackers and requirements for machines to share information, there will be incidents of intrusion. What is important, therefore, is the ability to detect such trespasses and adjust defenses accordingly to mitigate a recurrence. Evaluating the depth of the penetration and the sensitivity of information exposed to the breach is beyond the scope of this chapter. Its importance, however, cannot be overstated. Additional reading on this topic can be found in several places on the Internet. You can find a good article that is a bit Windows centric at http://www.nsa.gov/snac/support/WORMPAPER.pdf.
The successful exploit of a vulnerability can only be achieved by first discovering that the target application is available. This implies that in most cases a certain amount of preparatory work, or reconnaissance, is required by the attacker. A proactive approach for preventing intrusions should include watching for reconnaissance scans. It is often impossible to find a single request for service among normal day-to-day traffic, unless of course, it comes from an unexpected source. Diligence in monitoring activities often yields the first hits of an intrusion attempt.
Intrusion detection efforts are typically segregated into two camps; both categories are complementary and must be addressed in a proper detection solution. Tools for managing both of these approaches are covered further in later sections.
The first category is called Network Intrusion Detection Systems (NIDS). This approach requires the deployment of sensors or appliances in strategic locations throughout the network. The sensors passively monitor network traffic for anomalies and can trigger alerts when unexpected events occur.
Similarly, Host-based Intrusion Detection Systems (HIDS) watch for changes on individual hosts. Unlike NIDS, HIDS solutions are, for the most part, not run in real-time. Detecting changes in machine content can therefore go undetected for a period of time.
A complete HIDS and NIDS approach allows for weaknesses in the one technique to be lessened by the other. In many cases, exploited systems start conversations on atypical ports and therefore get caught by the NIDS. If the exploit uses only known, allowed ports, the HIDS system will catch unauthorized changes to the system’s content.
Before delving into the various tools available for HIDS and NIDS, we need to examine possible ways to reduce the exposure of systems.
Reducing Your Target Size
At a system level, successful intrusions require access to vulnerable targets. The aim of this section is to ask a number of questions that should be asked for every system on your network. Doing this will help you reduce your overall exposure to exploits.
Several times throughout this book we have discussed the need to run the minimum number of processes possible. If a service is not available on a system, it cannot be exploited. Conceptually, you can think of all the services run on your system as targets. The services that offer up network ports are larger targets because their exposure is greater. Those that only run locally are, in theory, protected by system authentication mechanisms and represent smaller targets. If you add up all the services, the privileges the services are running under, and their exposure, you can get a measure for the total exposure of your system.
A first approach to securing a system is to look at the number of processes running at startup. In the default install of the various flavors of SUSE, great care has been taken to ensure that a full-featured environment is available. Though this provides for maximum flexibility, if not all components are configured properly, it could lead to inadvertent exposure of the system. A process review should be undertaken after a system has been tasked for a specific purpose. Applications not related to the specific tasking of the server should be removed. This reasoning does not just apply to the server environment. Workstations are just as vulnerable to attacks and should therefore be hardened as well.
The second step in reducing exposure is to ensure that your software is kept up to date. Patches and bug fixes occur constantly. It is imperative to replace known defective software as soon as possible. Sometimes, however, a specific fix to one application triggers unexpected incompatibilities in related components. The burden and cost of the development, staging, and production rollover of many fixes often delay their implementation beyond what you, as a system administrator, might deem reasonable. Other avenues should therefore be implemented as well.
NOTE
The YaST firewall configuration tool provides for a quick method for allow-deny rules on specific ports and protocols. It does not allow for more granular definitions for allowed traffic. These definitions have to be implemented directly using iptables commands. With such commands, it is possible to restrict the availability of service ports to specific machines, thus further reducing the service’s exposure.
The next step in protecting your system is to properly configure the local firewall. In many cases, network-capable services are required for the proper functioning of a local application. As an example, a local database server may require a listener process. If left in the default configuration, the listener may inadvertently be listening for network connections as well as local connections on the loopback address. A properly configured firewall rejects incoming connections before the listener application has a chance to be affected by them. The firewall should not be used as an excuse for an improperly configured application. It is an extra layer of protection. The same is true for many other applications. All systems capable of running a local firewall should do so. Properly configured firewalls don’t conflict with business requirements. They are part of a properly configured environment.
After these steps have been performed, they need to be reviewed. As with all aspects of security, everything is a process of continual refinement. Checking a configuration for weaknesses is just as important as, if not more so than, the original security checklist. Vulnerabilities in your defenses are visible to all those who care to look. Verifying the work described here against hardening tools such as Bastille (described in Chapter 13, “System Security”) can be quite enlightening.
Vulnerability Assessments
After you have configured your system and believe it is ready for prime time, you need to test it. There are two main categories of tests that should be performed.
The first is a measurement of the target profile your machine presents. This means probing your server for each and every port it presents to the world. In the examples here, we use the nmap tool available from www.insecure.org.
The second group of tests involves verifying your server for published vulnerabilities in the services it offers. A number of tools are available to perform this task. In this chapter, we concentrate on the Nessus tool (www.nessus.org).
Both of these tools are present on your SLES distribution media. You should verify that the versions you have installed are up to date. Scanning for vulnerabilities with an outdated tool will leave you with a false sense of security. Verify with the websites shown here that you have the latest software versions and vulnerability signatures.
Both series of tests should be run with your firewall up as well as with your firewall down. While it is comforting to think that the local firewall software will never fail, it never hurts to be cautious. Only by fully testing listener applications will you have a sense of your exposure. If anything, always lean to the side of the paranoid when testing systems.
TESTING VERSUS HACKING!
The tools presented here are excellent professional-grade applications. They can be used to probe your network for weaknesses and vulnerabilities.
Most companies have an explicit policy against running such tools on their production network. Even if such a policy is not written down, any type of vulnerability scanning is considered an attack.
To use these tools, you must receive written permission to conduct your tests. It is also critical that the person giving you permission to run the scans is a recognized agent of the company with the authority to grant such permissions. Also, ensure that strict timelines associated with the scanning event are adhered to.
nmap
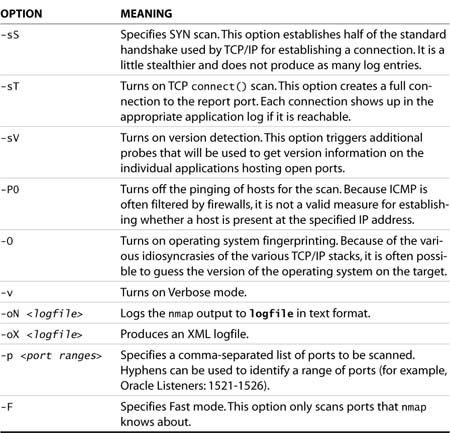
The nmap tool is a network mapping tool. Designed to scan full networks, nmap can return a list of all the ports available on individual machines. It can also be used to probe a single machine for network-accessible ports. Though it can be used in stealth mode, the testing presented here does not have to traverse firewalls, and we are not concerned about having this scan activity logged. The nmap options used in this section are shown in Table 12.1.
Table 12.1. nmap Command-Line Switches
The following two examples represent nmap scans of the same server. In the first instance, the firewall is down, and you can see a number of services accepting connections:
Athena:~ # nmap -O -n -sT 192.168.1.243
Starting nmap 3.50 ( http://www.insecure.org/nmap/ ) at![]() 2005-03-01 08:31 EST
2005-03-01 08:31 EST
Interesting ports on 192.168.1.243:
(The 1654 ports scanned but not shown below are in state:![]() closed)
closed)
In this second instance, we have brought up the firewall. As you can see, all but the ssh port have been removed from access as expected. Port 113 is accessible but left closed because it is used by some mail services for authentication:
Athena:~ # nmap -O -n -sT 192.168.1.243
Starting nmap 3.50 ( http://www.insecure.org/nmap/ ) at![]() 2005-03-01 08:40 EST
2005-03-01 08:40 EST
Interesting ports on 192.168.1.243:
(The 1657 ports scanned but not shown below are in state:![]() filtered)
filtered)
PORT STATE SERVICE
22/tcp open ssh
113/tcp closed auth
Device type: general purpose
Running: Linux 2.4.X|2.5.X|2.6.X
OS details: Linux Kernel 2.4.18 - 2.5.70 (X86), Linux 2.4.20
Uptime 0.003 days (since Tue Mar 1 08:37:54 2005)
Nmap run completed -- 1 IP address (1 host up) scanned in![]() 77.250 seconds
77.250 seconds
Athena:~ #
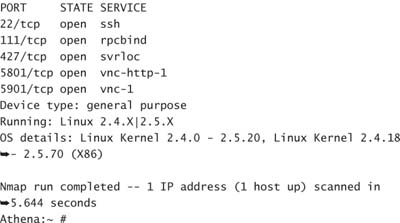
What is missing from the second example are ports 5801 and 5901. Referring back to the no-firewall example, you can see that these ports have been enabled to allow remote VNC connections to the server. If this service is not required, the appropriate applications should be disabled. If, however, you want to allow for VNC connections to the server, you could open the ports on the firewall. A more secure option would be to tunnel VNC over ssh as discussed in Chapter 8, “Network Services.” Such tunneling would require the listeners on the local machine for local connections only.
In both examples, nmap was able to guess that the operating system was a Linux variant. With the reduced number of ports available in the second example, nmap took a lot longer to forge a guess of the remote operating system.
This section shows that it is possible to probe a significant amount of information from a system using nmap. By testing the server with the firewall down, you can inventory the ports offered by the server and ensure that the firewall is tuned appropriately. Keep in mind that the nmap tool is also available to others.
Nessus
The Nessus tool is an open source vulnerability scanner that is composed of both server and client components. This permits a single client workstation to perform testing using several different servers. All the actual communications to the target machine are driven from the server.
The Nessus tool can be used to probe a target machine for services exposed to the network. For each of the ports it finds, it performs a number of tests. Each test is designed to attempt to discover the purpose of the open port and what protocols are supported. The tests also allow for the detection of the application version hosting the port.
Scan results are cross-referenced against a list of known application version vulnerabilities. When this is done, Nessus reports its findings in a number of different formats.
When you are installing SLES, it is possible to include Nessus as one of the components. Before you can use it, however, you must perform a couple of setup steps.
Because the purpose of the Nessus tool is to report back on machine vulnerabilities, the information passed between the server and the client is considered sensitive and should be protected from interception. For this purpose, Nessus encrypts client/server communications. The nessus-mkcert command is used to generate the appropriate certificates. When it is invoked, you are asked the following questions:
![]() CA certificate lifetime in days
CA certificate lifetime in days
![]() Server certificate lifetime in days
Server certificate lifetime in days
![]() Your country (two-letter code)
Your country (two-letter code)
![]() Your state or province name
Your state or province name
![]() Your location (for example, city or town)
Your location (for example, city or town)
![]() Your organization
Your organization
Nessus then creates the appropriate files in /var/lib/nessus/CA. After this is done, you are ready to grant end-user access to the application.
The following shows nessus-mkcert in action:
Creation of the Nessus SSL Certificate
This script will now ask you the relevant information to create
the SSL certificate of Nessus. Note that this information will
*NOT* be sent to anybody (everything stays local), but anyone
with the ability to connect to your Nessus daemon will be able
to retrieve this information.
CA certificate life time in days [1460]:
Server certificate life time in days [365]:
Your country (two letter code) [FR]: CA
Your state or province name [none]: Ontario
Your location (e.g. town) [Paris]: Peterborough
Your organization [Nessus Users United]: UniversalExport.ca
---------------------------------------------------------------------
Creation of the Nessus SSL Certificate
---------------------------------------------------------------------
Congratulations. Your server certificate was properly created.
/usr/local/etc/nessus/nessusd.conf updated
The following files were created :
. Certification authority :
Certificate = /usr/local/com/nessus/CA/cacert.pem
Private key = /usr/local/var/nessus/CA/cakey.pem
. Nessus Server :
Certificate = /usr/local/com/nessus/CA/servercert.pem
Private key = /usr/local/var/nessus/CA/serverkey.pem
Press [ENTER] to exit
Before Nessus can be used, individual accounts called “logins” must be created within it. Using these accounts, users will be able to probe machines for vulnerabilities. Because of the nature of these probes, some being potentially fatal to some services, great care should be exercised when selecting targets and granting access to Nessus.
To grant access to Nessus, you use nessus-adduser. When it is executed, you are prompted for
![]() Login
Login
![]() Authentication (password/certificate)
Authentication (password/certificate)
![]() password
password
![]() User rules
User rules
The login prompt requests the username to be used to establish new client sessions. Authentication can be done by password or certificate. You have to select the appropriate choice for your environment. When you are selecting a login password, ensure that it is sufficiently complex. The user rules section can restrict individuals to specific IP ranges. In most cases, the few individuals allowed to run these scans are granted access to the whole of Nessus.
The following is a transcript of a nessus-adduser session. In this example, the user Carol is given the rights to use the Nessus tool to scan all the machines in her branch office (subnet 10.0.17.0/25, which is the short form of 10.0.17.0 netmask 255.255.255.0). Scanning of any other subnets is explicitly denied for this user.
Athena:~ # nessus-adduser
Using /var/tmp as a temporary file holder
Add a new nessusd user
----------------------
Login : carol
Authentication (pass/cert) [pass] : pass
Login password :
Login password (again) :
User rules
----------
nessusd has a rules system which allows you to restrict the
hosts that carol has the right to test. For instance, you may
want him to be able to scan his own host only.
Please see the nessus-adduser(8) man page for the rules syntax
Enter the rules for this user, and hit ctrl-D once you are
done : (the user can have an empty rules set)
accept 10.0.17.0/25
default deny
^D
Login : carol
Password : ***********
DN :
Rules :
accept 10.0.17.0/25
default deny
Is that ok ? (y/n) [y] y
user added.
Athena:~ #
Before the server side of Nessus is invoked, you should perform one important step. Vulnerabilities are being discovered on a regular basis. A list of known weaknesses from the original install CDs will most certainly be out of date by the time you install Nessus. Therefore, before you start Nessus as well as on a regular interval, it is important to update the list of known vulnerabilities. This ensures the validity of the scan results. Nessus uses plug-ins for scanning. These plug-ins are brought up to date using the nessus-update-plugins command. At the time of writing, there were more than 7,200 Nessus plug-ins.
After you run the update command, you can start the Nessus server daemon by issuing the following command:
Athena:~ # nessusd -D
Loading the plugins... 1224 (out of 7297)
After the server has loaded all the plug-ins, the system prompt will return. The client can now be invoked, as follows:
Athena:~ # nessus &
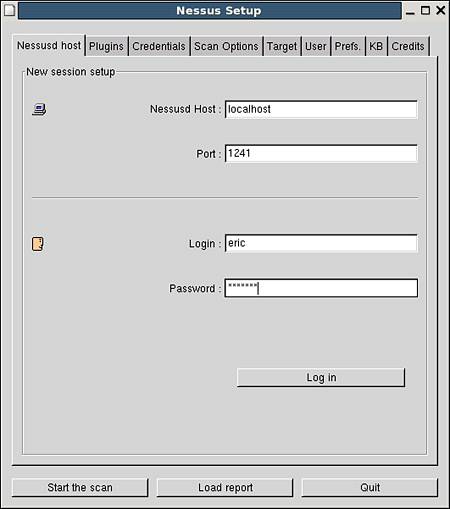
On startup, the client requires credentials for authenticating against the Nessus scanner on the server side. In addition, if firewalls are in place, allowances for port 1241 will have to be made for client/server communications. The default login screen is shown in Figure 12.1.
Figure 12.1. The Nessus Client login screen.
The Nessus client interface is composed of a number of tabs. Each tab represents a family of options allowing you to customize your scans. The major tabs are
![]() Plugins—This tab allows you to define the series of tests that will be performed on the selected target.
Plugins—This tab allows you to define the series of tests that will be performed on the selected target.
![]() Credentials—This tab allows you to define valid application accounts (SMB and
Credentials—This tab allows you to define valid application accounts (SMB and ssh) to be used to probe for known vulnerabilities available to authenticated users.
![]() Scan Options—On this tab, you can select the number of hosts and tests to run simultaneously. This tab also allows you to select which options are used for port discovery on the target.
Scan Options—On this tab, you can select the number of hosts and tests to run simultaneously. This tab also allows you to select which options are used for port discovery on the target.
![]() Target—You can simply specify a name or address for the target system on this tab. The software also supports defining multiple targets and retrieving a target list from a disk file.
Target—You can simply specify a name or address for the target system on this tab. The software also supports defining multiple targets and retrieving a target list from a disk file.
![]() User—User-customized rules can be included using this selection.
User—User-customized rules can be included using this selection.
![]() Prefs.—This tab permits fine-tuning of the various aspects of the port scanning options. This is also the place where the SNMP community string used for scanning can be changed from public to a more appropriate value. Using this tab, you can also define accounts to be used for insecure services such as FTP, POP, and HTTP.
Prefs.—This tab permits fine-tuning of the various aspects of the port scanning options. This is also the place where the SNMP community string used for scanning can be changed from public to a more appropriate value. Using this tab, you can also define accounts to be used for insecure services such as FTP, POP, and HTTP.
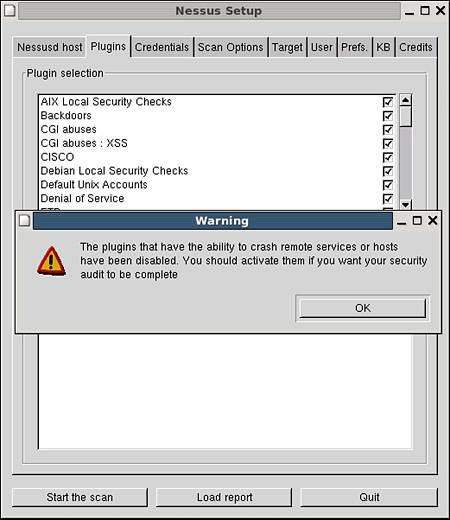
Upon successful login, you are presented with the Plugins tab as well as a warning message (see Figure 12.2). A number of known exploits are Denial of Service exploits (DoS) that cause services to fail. To properly measure the exposure of a system, you must test for the vulnerability using the same approach as the attack. If the system is vulnerable, the service will fail, causing an outage. By default, Nessus disables these tests.
Figure 12.2. The Nessus Plugins tab and warning message.
A more detailed version of the Plugins tab is shown in Figure 12.3. In the upper portion of the tab is a list of the different families of tests. If you want to reduce network load and unnecessary alarm, it is best to customize the plug-in selection to match the host type. When you are testing a SUSE server, looking for operating-system–specific vulnerabilities, such as those for Solaris or Windows, is wasteful.
Figure 12.3. The Nessus SUSE Local Security Checks options.

The lower portion of the Plugins tab shows the tests available for a SUSE server. Notice that these are local security checks. This means that if given the proper credentials, Nessus can create a valid ssh client session to your server and test for the SUSE vulnerabilities listed.
Selecting the appropriate options for scanning requires a certain amount of fine-tuning. Once you have chosen the appropriate values, you can proceed to the Target tab. After choosing the appropriate target, you can select the Start the Scan button at the bottom of the window.
For the purpose of this section, we have started a number of extra services on the server Athena. We have also selected to run the tests without the local server-side firewall. If the services are present and unprotected, it is best to know whether any vulnerabilities exist.
Nessus will proceed to scan the target for open ports, and for each, it will run a number of tests. A typical report is shown in Figure 12.4. When the report window opens, you are presented with a number of blank panes. Selecting the appropriate subnet in the upper-left pane presents a list of valid scanned hosts in the lower-left pane. Selecting the appropriate host populates the report portion of the window.
Figure 12.4. A Nessus report for Athena.
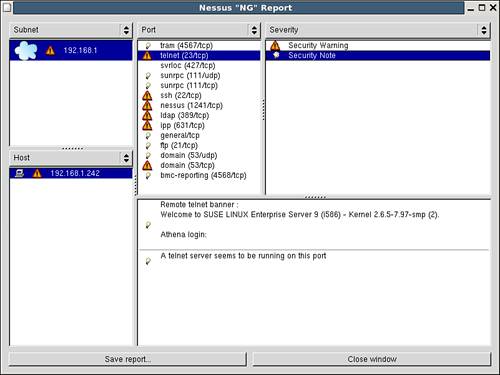
Figure 12.4 presents the information gleaned from finding an open Telnet service on the server. Throughout this book, we have discussed using ssh over Telnet. In this example, the security warning option in the Severity pane rehashes the perils of using Telnet. The Security Note portion of the Severity pane presents information that a hacker could collect if Telnet were accessible. From the Telnet banner alone, a hacker can determine not only the flavor of the operating system, but also which version of the kernel it is running.
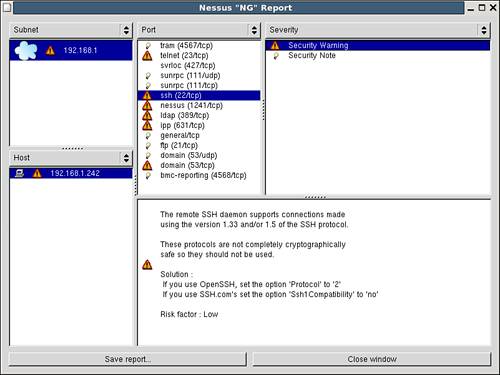
To reduce this exposure and that of traffic intercept, we have suggested many times replacing Telnet with ssh. If you then view the Nessus results for ssh, you find the information presented in Figure 12.5. Though ssh is a more secure protocol, certain incarnations of the protocols have been found to have weaknesses over time. Currently, ssh versions earlier than version 2 are not considered totally safe. In this case, Nessus has revealed that simply turning on ssh might leave a false sense of security. Nessus also offers the appropriate configuration changes required to secure the solution.
Figure 12.5. A Nessus report for the ssh service on Athena.
This discussion illustrates how Nessus can be used to probe for vulnerabilities on your servers. Selecting the appropriate scanning options allows for efficient, customized scanning for your infrastructure. It is important to remember that a number of scanning options are known to crash services. Great care should be exercised to restrict the use of such selections.
In most cases, a valid corporate IT policy will prohibit the unscheduled use of scanning tools such as Nessus on the live network. It is not difficult to imagine the chaos that would result from having the uncontrolled use of vulnerability scanners crashing production environments. The next section describes how such scans can be tracked. Whenever possible, a preproduction environment should exist where these tests can be performed on staging servers. This ensures that the soon-to-be-rolled-out changes are secure. If not, the tests will generate downtime in the development section, not in production.
Detecting a Network-based Intrusion
Attackers use application vulnerabilities to gain unauthorized access to systems. We saw in the preceding section how tools such as Nessus help identify vulnerable services and, when possible, recommend ways to remedy the problem. Before attackers can exploit a vulnerable system, they must know it exists.
The following sections examine a number of different methods that can be used to protect a network environment. We also examine techniques that can be used to detect the presence of unwanted guests.
Know Your Traffic, Tune Your Firewall
Applications and users require a transport mechanism for communicating with each other. In a standard network environment, this is handled by using a number of network protocols such as TCP/IP, ICMP, and UDP. For each of these, applications require predefined ports over which the communications will take place.
The file /etc/services contains a number of well-known, predefined protocol-port pairs and the applications they support. If you know the applications that are being run within your environment, you should be able to generate a list of required ports. /etc/services is a static ASCII file used for referencing ports and applications. It does not prevent the binding of services to any specific port. Restricting network traffic flow to only these select ports will reduce your overall exposure. In addition, a proper review of requirements may identify that some services can be restricted to specific clients. Further constraints can be placed on network flow to allow only these conversations.
As an extra level of complexity, some applications initiate conversations only on a specific port. After the appropriate handshake has been performed, the communications exchange is shifted to a different, sometimes random, port.
When you are finished with the application-port mapping exercise, you will have a list of valid client/server/port relationships that are required to support your applications. Layered on top of the business list of ports is the more transparent layer. Protocols such as DHCP, DNS, and NNTP are often forgotten in the application lists. If they are not included at this step in the process, a number of critical applications may fail. The availability of each of these relationships on the network can be controlled by placing the services in question behind an appropriately configured firewall.
Knowing which ports are in use on your network allows you to identify unsanctioned traffic more readily. Keyloggers and password-stealing Trojans often use IRC channels to report their findings to a remote server. If your network doesn’t allow chat traffic, you will quickly be able to identify potentially infected machines that use this mechanism.
A properly configured firewall should monitor not only incoming traffic, but it also should be able to monitor and control the port and contents of both inward-and outward-bound packets. If this can be achieved, the first step in mitigating a successful attack has been taken.
Network Intrusion Detection Systems
The preceding section explained how a properly configured firewall allows clients to access only specific target servers. Using such a firewall, coupled with stateful packet inspection, you can be fairly confident that packets reaching the servers contain data that is valid for the target service.
STATEFUL PACKET INSPECTION
A number of firewalls filter traffic based only on the ports used in the conversation. A number of exploits, however, occur when malformed packets are sent to a server over allowed ports.
Stateful Packet Inspection is a tool used to examine information passed between a client and a host. When this tool is enabled, all the packets that make up a single transmission are assembled by the firewall. Once they are assembled, the original message is checked for consistency and correctness of all the appropriate headers. When a packet is considered safe, it is passed along to the target server.
Stateful Packet Inspection also monitors the current state of a conversation between two hosts. If a packet attempts to traverse a firewall claiming to be part of a specific conversation, it is checked against a known list of current connections. If the conversation is active and the packet was expected, it is allowed through.
This process should not be confused with Application Layer packet filtering. Such filtering actually examines the content of the data portion of packets looking for known application-level exploits.
The issue at hand now becomes determining whether the traffic sent to a server is a valid request, and not an attempt to exploit a known vulnerability of the service. Services are exploited when they are sent specially crafted streams of data that cause them to malfunction in predictable ways. As they malfunction, they inadvertently give an attacker access to resources that, in turn, can lead to a system compromise.
A Network Intrusion Detection System (NIDS) is a service that monitors network traffic flow looking for known exploit attempts. In some cases, NIDS is implemented as an appliance; in other cases, as a piece of software. In either case, because NIDS requires access to all network conversations, it must be placed in a network where it can be allowed to intercept all traffic. In most cases, it will therefore require the programming of a switch to allow one port to listen to all traffic.
NIDS inspects each packet and compares the content against a set of known exploits. If a match is found, an alert is generated and the packet is logged. One of the major difficulties in tuning an NIDS environment is determining which alerts are real and which are false positives. There is a fine balance between defining the parameters of an exploit attempt and the necessary resources required to implement a 100% match. Since NIDS must be running in real-time, the processing load of deep inspection of all packet content is not possible. Packet rules configured to recognize particular exploits are therefore potentially prone to incorrectly identify innocent packets as attacks. When they are tuned to an existing environment, however, it is possible to reduce the error rate to an acceptable level. Caution must be taken to find a proper balance between too many alerts versus insufficient protection.
Snort
Bundled with SLES, is an NIDS called Snort. Originally designed as a lightweight NIDS, Snort has become one of the most widely used systems for detecting intrusions. Snort rules are constantly being developed by the Snort community and shared through their website. In addition to using community rules, you also can create your own rules.
Before looking at results from Snort in action, let’s first examine how it can be configured to suit your environment. The Snort software can be found in /etc/snort. Table 12.2 lists the files found in this directory.
Table 12.2. Snort Configuration Files in /etc/snort
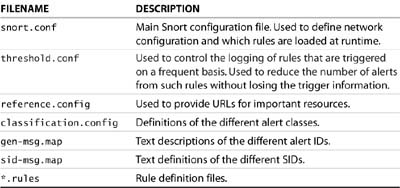
Though there are many files in the snort directory, most of the configuration of Snort is done through snort.conf. This file is split into four major sections:
![]() Network definition—This section allows you to define a set of variables that describe the networking environment within which the Snort sensor finds itself. These variables are applied to the rules files as they are loaded. Definitions in this section include the identification of valid servers for specific types of traffic such as SMTP, HTTP, DNS, and so on.
Network definition—This section allows you to define a set of variables that describe the networking environment within which the Snort sensor finds itself. These variables are applied to the rules files as they are loaded. Definitions in this section include the identification of valid servers for specific types of traffic such as SMTP, HTTP, DNS, and so on.
![]() Preprocessors—This section allows you to define if and how related packets are treated. It also allows for the configuration of the way the packets are inspected for content.
Preprocessors—This section allows you to define if and how related packets are treated. It also allows for the configuration of the way the packets are inspected for content.
![]() Logging options—This section allows you to define where the Snort alerts are to be placed. By default, the alerts go to the system log facility. You can change the behavior here to log to
Logging options—This section allows you to define where the Snort alerts are to be placed. By default, the alerts go to the system log facility. You can change the behavior here to log to /var/log/snort and/or to a database.
![]() Rules—This section allows you to control which rules are activated by the system. Each family of rules is maintained in a separate file. Variables defined in the first section are interpreted and inserted into the rules.
Rules—This section allows you to control which rules are activated by the system. Each family of rules is maintained in a separate file. Variables defined in the first section are interpreted and inserted into the rules.
You can activate Snort by running its script in /etc/init.d. To have Snort initialized at boot time, you need to use YaST and configure the Runlevel Editor option. By default, the SUSE implementation of Snort can see only network traffic destined to the local host server. You can change this by modifying the Snort startup script in /etc/init.d and defining a variable called SNORT_PROMISC and setting its value to yes. When this is done, Snort will change the mode of the network card to promiscuous. In this mode, Snort can monitor all traffic seen by the network card, and not just the traffic destined for its host system.
When a packet arrives on the interface card that Snort is listening on, Snort intercepts it for analysis. When a packet is found to satisfy the requirements of one of the rules, an alert is issued. An example of such an alert is shown in Listing 12.1.
LISTING 12.1. A Snort Alert Found in /var/log/snort/alert
[**] [1:1256:7] WEB-IIS CodeRed v2 root.exe access [**]
[Classification: Web Application Attack] [Priority: 1]
04/16-19:32:41.639229 10.0.131.168:4105 -> 192.168.1.240:80
TCP TTL:113 TOS:0x0 ID:40087 IpLen:20 DgmLen:112 DF
***AP*** Seq: 0x8721649F Ack: 0x95199331 Win: 0x4470![]() TcpLen: 20
TcpLen: 20
[Xref => http://www.cert.org/advisories/CA-2001-19.html]
In this listing, you see that Code Red attacks are still happening on the Internet. As you can see from this example, Snort registers a fair amount of information in the local log file. Scanning through the log file manually can be a tedious task and prone to missing important information.
Analysis Console for Intrusion Databases
A more flexible tool is required to quickly look at the events triggered by Snort. There are a number of tools for reviewing Snort logs. In this section, we implement a tool called Analysis Console for Intrusion Databases (ACID). This tool can be used to review logged events and present the summarized findings on a web page. Through the web environment, it is possible to drill down using a number of different avenues to obtain event-specific information.
As its name implies, ACID relies on having Snort events collected in a database. The following will help you set up a MySQL repository for your Snort logs as well as implement the ACID tool.
To get ACID running on your system, you need to install the following packages:
![]() Snort—An NIDS tool
Snort—An NIDS tool
![]() MySQL—A logging database
MySQL—A logging database
![]() PHP—A web interface scripting language
PHP—A web interface scripting language
![]() ADODB—A database access interface
ADODB—A database access interface
![]() JPGRAPH—A tool that creates charts for websites
JPGRAPH—A tool that creates charts for websites
![]() PCRE—PERL Compatible Regular Expression library
PCRE—PERL Compatible Regular Expression library
![]() ACID—An analysis tool
ACID—An analysis tool
Both Snort and MySQL are included in the original distribution media for your SLES server. If they were not included in the original install, you can add them to your system using the YaST software option. Newer versions of the software are available from their respective websites.
As mentioned earlier, configuring Snort requires making changes to /etc/snort/snort.conf. The version of this file supplied with the default install will suffice for the original install. You may, however, want to modify the /etc/init.sd/snort startup script as mentioned previously to monitor events beyond the local server.
Once snort has been configured and is logging alerts to /var/log/snort/alert, you can proceed with the configuration of MySQL. Similarly to Snort, installing the MySQL database does not enable the startup of the database when the machine starts. To enable this feature and the associated clean shutdown, you must use the YaST Runlevel Editor.
By default, MySQL does not set a local administrator password. To set a password to protect the database, use the following command:
Athena:~ # mysqladmin –u root password newpassword
The results of a Snort scan should be stored in a Snort-specific database. To create such a database within MySQL, sign into MySQL using the root account just defined and use commands similar to these:
use mysql;
create database snort;
use snort;
grant ALL on snort.* to [email protected]![]() identified by ’mspiggy’;
identified by ’mspiggy’;
grant ALL on snort.* to snort@localhost identified![]() by ’mspiggy’;
by ’mspiggy’;
exit
These commands create an empty database for the Snort alerts. Before you can make Snort point to MySQL, you need to create the tables it is expecting. In the original installation of Snort, a script is provided to create all the required structures. The file containing the script is /usr/share.docs.packages.snort/ create_mysql. Enter MySQL using the Snort account this time and execute the preceding script:
Athena:~ # mysql -u snort -p
Enter password:
Welcome to the MySQL monitor.
Commands end with ; or g.
Your MySQL connection id is 14 to server version: 4.0.18
Type ’help;’ or ’h’ for help. Type ’c’ to clear the buffer.
mysql> use snort;
Database changed
mysql> . /usr/share/doc/packages/snort/create_mysql
This script creates a MySQL database to contain the Snort alerts. You can now proceed to configure Snort to enable logging to MySQL. In the snort.conf file, you need to find the section that contains a number of lines beginning with output database. In this section, you create a new entry like this:
output database: log, mysql, user=snort password=mspiggy![]() dbname=snort host=localhost
dbname=snort host=localhost
This allows Snort to log to both /var/log/snort/alert as well as the MySQL Snort instance. With this change in place, it is now possible to restart Snort to activate the new logging feature:
Athena:~ # /etc/init.d/snort restart
The next step is to validate that you are logging events into MySQL. You can verify this by entering the MySQL Snort database and looking for entries in the tables of the Snort instance.
The configuration of the other components can be done quite easily. The PHP install is done through YaST and must include the PHP modules for Apache and MySQL. The ACID tool can be found at the following URL: http://www.andrew.cmu.edu/user/rdanyliw/snort/snortacid.html.
ACID REQUIREMENTS
The ACID tool is a great addition to Snort. It’s easier to detect patterns graphically than to scan pages of logs visually. The graphical representation of alerts within ACID, coupled with the ability to drill down through the data to a specific event, allows an administrator to quickly determine the source of a threat.
The drawback, however, is that configuring all the components of ACID can be quite challenging. The distribution kit for ACID identifies a number of dependencies. ACID is written in PHP, but specific application hooks must be compiled into the executable. If you want to upgrade your version of PHP, you need to verify that dependencies such as gd and MySQL must be satisfied at compile time.
Though they are a bit tricky to set up, Snort and ACID are essential tools in your NIDS strategy.
Before proceeding any further, you need to secure your MySQL database. By design, database servers are network aware. With MySQL, a listener is created looking for network connections on port 3306. If your Snort sensor is co-located on the same server as your MySQL server, port 3306 need not be made available to the network. You can secure this port by ensuring it is blocked at the firewall level. Snort can log events to the database using the localhost network.
If you deploy a number of Snort sensors throughout your network, you will have to open port 3306 on the firewall. In the preferred scenario, only specific static IP addresses will be allowed to connect through the firewall. In addition, when granting permission to the Snort database, MySQL allows you to specify allowed client hostnames.
Included in the install kit for ACID is the necessary documentation for accessing the other required components. ACID, ADODB, and JPGRAPH are simple to un-tar and move into the default web root, /srv/www/htdocs. It is prudent to trim out all the sample and documentation folders that are not required for the proper functioning of the application. PCRE, on the other hand, requires a compiler environment and must be built through the .configure and make stages. All of this is well documented inside each package.
When all these packages are installed, you should find acid, adodb, and jpgraph-1.16 directories.
The ACID tool relies on a configuration file called acid_conf.php that resides in /srv/www/htdocs/acid. You must edit this file and customize it for your environment. The following variables must be defined to match your installation:
$DBlib_path = "/srv/www/htdocs/adodb";
$DBtype = "mysql";
$alert_dbname = "snort";
$alert_host = "localhost";
$alert_port = "";
$alert_user = "snort";
$alert_password = "mspiggy";
$ChartLib_path = "/srv/www/htdocs/jpgraph-1.16";
After saving the modifications for the ACID configuration, you should be able to view your Snort alerts through the web. You can access the web page through http://localhost/acid/acid_main.php. An example of this page is shown in Figure 12.6.
Figure 12.6. The ACID main menu.

NOTE
Visibility is an important factor to keep in mind when you are deploying web-based tools. When you deploy an ACID website, ask yourself who has access to it. By default, websites are available to anyone who finds them.
Is it acceptable for you to show the world which events tripped your Snort sensor? If an attacker can also monitor your monitoring of network activity, could he change his approach and become more stealthy?
There are a number of steps you might want to take to secure your website:
![]() You can set up a firewall rule to accept connections only from specific TCP/IP addresses.
You can set up a firewall rule to accept connections only from specific TCP/IP addresses.
![]() You can also set up a
You can also set up a robots.txt file. This keeps spiders from adding your website to Google and other search engines. It does not, however, prevent spiders that do not obey robots.txt files.
![]() You can enable SSL on the site and configure your web browser to support
You can enable SSL on the site and configure your web browser to support .htaccess files. This encrypts your HTTP conversations and adds a simple level of challenge-response protection to your site’s content.
Keep in mind that the tools you deploy, unless secured, can be used against you.
On this page, you immediately get a significant amount of information not immediately apparent from the flat log files. You can quickly see the alert distribution across the various protocols (TCP, UDP, or ICMP). ACID also summarizes the alerts by category, alert type, ports, source, destination, and links.
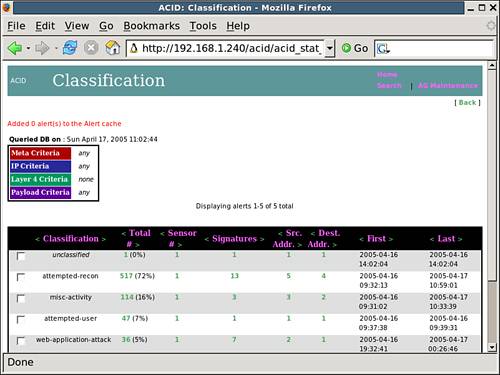
Figure 12.7 represents the alerts broken down by category. You can see the five separate types of alerts as well as the number of alerts, the number of sources/destinations, and the time span over which the alerts were generated.
Figure 12.7. The ACID alert by category menu.
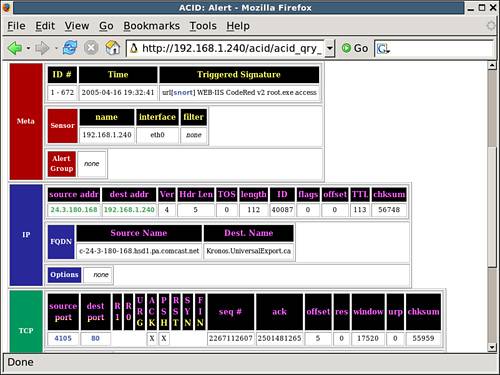
If you want to drill down further, you can find the alert used earlier in Listing 12.1. If you select the 36 members of the web-application-attack category, you can further refine the view of the Snort database down to the event level. After doing this, you can examine the details of the alert in a slightly more readable manner, as shown in Figure 12.8.
Figure 12.8. The ACID version of the Code Red example.
The ACID tool allows for a number of additional features unavailable directly through the log file. Since all of the data used by ACID is in MySQL, a number of queries can be launched directly on the database from the Search menu. In addition, it is possible to configure an archive database to keep specific events on file for future reference.
In this section, we discussed the importance of knowing what traffic is flowing across your network. It is important to understand the characteristics of your application-generated traffic. This allows for the appropriate firewall implementations. Traffic that is out of these norms should be refused. If a valid business requirement exists for this new format of traffic, the appropriate changes will have to be made at the firewall level. Measuring out-of-the-normal traffic permits the identification of potentially compromised systems.
For traffic that does fit within the allowed patterns of traffic, it is still important to remain vigilant. Application exploits will use an application’s default port settings when attacking a service. Monitoring the content of the traffic can help determine whether it is malicious.
It is important to also note that, just as in the case for the Nessus tool, many corporate policies may prevent the application of network monitoring tools that actually capture packets.
Detecting a Host Intrusion
In the preceding section, we looked at protecting systems through controlling the network. If attackers cannot reach a system, in theory they cannot compromise it. All servers on a network, however, are there to offer a service. If a vulnerability exists in the code on which the service relies, it may be exploited by an attacker to gain access to the server.
Tools such as Snort and ACID can be used to look for exploit attempts within network packets. If the attacker is using a technique not yet known to these tools, the compromise may go undetected at the network level. In cases such as these, other techniques will have to be employed in an attempt to find possible exploits.
Log Files
One method for looking for traces of an intrusion is to look for clues in log files. Depending on the activity level of the server, this can be a Herculean task. If the attacker was a novice and left traces of his presence, possibly only one log entry in thousands may reflect that fact. If the attack is successful, deliberate modification of the log file could hide any sign of an intrusion.
Placing the log files on a remote syslog server can mitigate against this type of cleanup attempt. Tools such as logsurfer can help sift through the many entries looking for known patterns. The problem is, not all patterns are known, and in many cases the log files are tweaked to erase tracks.
The value of log files should not be dismissed as a valuable tool for detecting intrusions. What they can provide, in some cases, is early warning that an attack is being set up. A careful review of the logs can reveal abnormal login failures from unexpected sources or port scans from other systems. Such information should not be ignored. Repeated failures of a particular service may indicate knowledge of vulnerabilities with the code. A quick check for newer, patched versions should be done.
chkrootkit
As soon as a system is compromised, it is not uncommon for an attacker to install what is commonly known as a rootkit. A rootkit is essentially a backdoor environment that allows the attacker to continue to access the compromised system. Often this is done through replacement of known executables with modified versions. This permits the attacker to connect to the system through a more comfortable interface.
Detecting a rootkit can be very difficult. Knowing which executable has been replaced with a hacked version can be almost impossible.
The chkrootkit program has been made available for just such a task and is available for download from www.chkrootkit.org. As new rootkits are discovered, this utility is modified to allow it to detect the subtle nuances in hacked versions of known executables.
Once compiled for your system, the chkrootkit program can be run with the -h flag to receive a list of available options. When run with no flags, it will scan all the executables it knows of and generate a lengthy report of its findings. Portions of such a report are shown here:
Athena:~ # ./chkrootkit
ROOTDIR is `/’
Checking `amd’... not found
Checking `basename’... not infected
Checking `biff’... not found
Checking `chfn’... not infected
Checking `chsh’... not infected
Checking `cron’... not infected
Checking `date’... not infected
Checking `du’... not infected
Checking `dirname’... not infected
Checking `echo’... not infected
.
.
.
Searching for HiDrootkit’s default dir... nothing found
Searching for t0rn’s default files and dirs... nothing found
Searching for t0rn’s v8 defaults... nothing found
Searching for Lion Worm default files and dirs... nothing found
Searching for RSHA’s default files and dir... nothing found
Searching for RH-Sharpe’s default files... nothing found
.
.
.
Searching for LPD Worm files and dirs... nothing found
Searching for Ramen Worm files and dirs... nothing found
Searching for Maniac files and dirs... nothing found
Searching for RK17 files and dirs... nothing found
Searching for Ducoci rootkit... nothing found
Searching for Adore Worm... nothing found
.
.
.
Checking `lkm’... chkproc: nothing detected
Checking `rexedcs’... not found
Checking `sniffer’... eth0: PF_PACKET(/usr/bin/snort)
Checking `w55808’... not infected
Checking `wted’... chkwtmp: nothing deleted
Checking `scalper’... not infected
Checking `slapper’... not infected
Checking `z2’... chklastlog: nothing deleted
Checking `chkutmp’... chkutmp: nothing deleted
In the report produced on Athena, more than 100 lines of output were generated. As you can see from this listing, the machine is clean. As expected, however, the sniffer check found that eth0 was in promiscuous mode and that the responsible binary was /usr/bin/snort. Because we knew Snort was running, this was not a problem. If we found something unexpected, it may be an indication of an intrusion.
The chkrootkit utility can be very useful in detecting a number of known backdoors. It can also look for known behaviors of backdoors such as the sniffer example shown in this section. What it cannot guarantee, however, is protection from other modifications beyond its designed scope.
Advanced Intrusion Detection Environment (AIDE)
Tools such as chkrootkit are very good at detecting changes in applications they have been designed to check. Because new backdoor techniques are constantly being developed, however, countermeasures such as these are forever playing catchup.
One approach for detecting unauthorized changes to a system is to take a snapshot of its content on a regular basis. Comparing these snapshots over time can provide a time-lapse reconstruction of changes. Such is the approach taken by applications such as the Advanced Intrusion Detection Environment (AIDE).
TRIPWIRE
One of the first HIDS products available on Linux is called Tripwire. Both free and commercial versions are available. The free version of this tool is included in the SLES distribution.
This product delivers essentially the same functionality as AIDE. It is, however, multiplatform. Based on the architecture of your site, you may decide that you want a common tool for all platforms. In such cases, Tripwire would be an ideal candidate. More information on the Tripwire tool is available from the website at http://www.tripwire.org.
The AIDE utility is a file integrity checker. It does not know about different attack algorithms or how backdoors get implanted on a system. It does, however, know how to keep track of files and notice whether changes have been made.
The main strength of tools such as AIDE is their ability to detect changes in patterns. When a system is built from known, trusted media, it can be considered safe and unexploited. The moment the machine is placed on a network, it is potentially vulnerable to exploits. Before exposing the system, you must record selected characteristics of your files. You will therefore know what they looked like when they were in pristine condition. On a regular basis, you can then compare the same characteristics from the live system with your time-zero snapshot. Changes in the attributes might reflect a machine compromise.
This is essentially what AIDE permits you to do. The behavior of AIDE is controlled through its configuration file aide.conf, which contains three different types of directives.
The first line type can be used to set a number of configuration options. With these options, you can set path values for database, database_new, and report_url. Defining these values within the configuration file means they do not have to be defined on the command line.
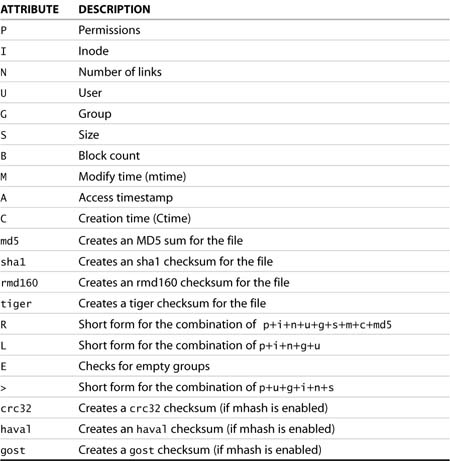
Macro lines allow you to specify short forms to define which characteristics will be recorded for each file. Attributes such as permission, inode, ownership, time stamps, and hash values for files can be registered in the AIDE database.
The last line type contains directives regarding which portions of the directory structure will be present in the AIDE database. Directories are included in the list using regular expressions. These expressions can allow for portions of directories or even specific files to be ignored.
The following is a portion of the default aide.conf file, supplied with SLES, located in the /etc directory:
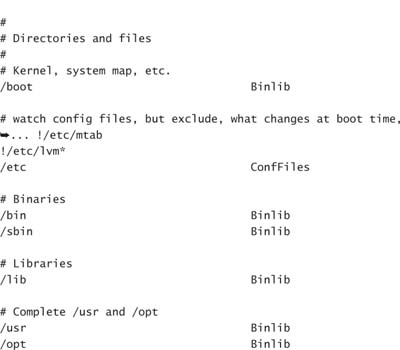
In this example, you can clearly see where a number of command-line parameters have been predefined. Also, the BinLib macro has been created to identify the file attributes we would like AIDE to track. A list of the attributes AIDE is capable of tracking is shown in Table 12.3.
Table 12.3. Tracking AIDE Attributes
AIDE can be invoked in four different modes, as listed in Table 12.4.
Table 12.4. AIDE Run-Time Modes

The --init version of AIDE needs to be run only once. It creates the initial database. Subsequent calls to AIDE should use the --check option. As an example, after configuring AIDE and initializing the database, we manually changed a file in our system. When we ran the check phase, AIDE generated the following:
Athena:/var/lib/aide # aide -C
AIDE found differences between database and filesystem!!
Summary:s
Total number of files=3679,added files=1,removed files=0,![]() changed files=4
changed files=4
Athena:/var/lib/aide #
Checking the resulting logs revealed this change:
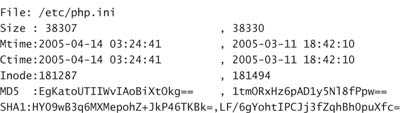
Though this is a simple example, it provides a fair amount of comfort that AIDE is capable of finding changes.
The AIDE tool was created to allow for a flexible system to provide a consistent and robust method for tracking changes to a server. It is important to remember that, as configured, the AIDE tool stores all its results within the filesystem. Given sufficient time, attackers may realize that AIDE is installed. This would give them ample opportunity to maintain the AIDE database, covering their tracks as they go.
It is imperative that copies of both the configuration file and the databases be kept on offline storage devices. If the databases are kept on read-only mount points, an attacker with root privileges could simply remount the volume, make changes, and switch it back again. Placing the information on CD is a good idea unless the CD is left in the burner. Multiple session CDs could be used to overwrite previous versions of the database. Additionally, leaving the CD in the drive might also allow an attacker to view the configuration file. Once the attacker has that information, he will know exactly where to place the exploit code to make it invisible to your scans.
Though much of this may sound paranoid, any information stored on, or accessible to, a compromised system must be considered tainted. By placing the AIDE files out of reach of the running system, you have a more reliable comparison snapshot.
It is also important to remember that the AIDE database will have to be maintained every time new applications are applied to the system. This includes patches to the operating system and its underlying services.
Additional Tools
A number of other tools can be used to your advantage in detecting possible intrusions. Though not directly related to HIDS or NIDS, a number of these tools are capable of alerting you to out-of-the-ordinary events.
Scan Detection Tools
PortSentry and Scanlogd are examples of applications that can be run on a local host to monitor connection attempts.
Scanlogd is supplied with your SLES distribution. This tool is run as a daemon so that it monitors activity at all times. Because the tool must be able to monitor all possible ports on an interface, including those that are not active, Scanlogd must be started with root privileges. Once activated and access to the interface has been secured, Scanlogd switches to using a local, unprivileged account called scanlogd.
Scanlogd is a passive tool and only listens for connection attempts. If a remote host attempts to connect to a number of ports within a short time window, Scanlogd logs the attempt. Scanlogd then ignores connection attempts from that host for a brief period of time to prevent a logfile-full brute-force attack.
More information on Scanlogd is available in the local man pages. You should verify that your version is up to date by checking the project website at http://www.openwall.com/scanlogd.
The following is a typical Scanlogd entry that can be found in the system log when a host is scanned by a tool such as nmap:
Mar 12 03:33:59 Athena scanlogd: 192.168.1.243:63218 to![]() 192.168.1.242 ports 5303, 514, 179, 877, 5999,
192.168.1.242 ports 5303, 514, 179, 877, 5999,![]() 5301, 2112, 1384, ..., fSrpauxy, TOS 00 @03:33:59
5301, 2112, 1384, ..., fSrpauxy, TOS 00 @03:33:59
In this single log file entry, you can determine the source of the scan as well as the ports of interest to the intruder. Using a tool such as logsurfer, an administrator can receive an alert and take appropriate action.
A more advanced tool for monitoring network scans is called PostSentry. This tool is not included in your SLES distribution but is available at http://sourceforge.net/projects/sentrytools/.
PortSentry also runs as a daemon and listens for inbound network connection attempts. This tool can be targeted to listen for access attempts on a specific list of ports or to listen for connections on all but a predetermined list of ports. An additional feature of PostSentry is that it can be placed in-line between a potential attacker and the target host. In this mode, PortSentry can filter packets and packet responses. If you are going to use PortSentry, read the documentation provided with the tool and ensure that you are running the latest version.
MRTG and Cacti
A different approach to detecting unexpected network traffic could include monitoring packet volumes at various interfaces. MRTG (http://people.ee.ethz.ch/~oetiker/webtools/mrtg/) and, more recently, Cacti (http://www.cacti.net/) are both tools that can be used to quickly display important network characteristics.
It is possible to configure SNMP on various devices to report on traffic statistics. The devices in question could be routers, switches, or network interface cards. Both of these tools rely on a number of processes to harvest the data from the various devices. The data is then massaged by MRTG or Cacti and presented in a graphical format.
SNMP
SNMP is a great technology for monitoring your devices. It does, however, have a number of characteristics that should make you nervous. SNMP is a cleartext protocol for transmitting status information.
Keep in mind that if there is a chance these packets are intercepted, you will be divulging a great deal of information about your network architecture. It will be fairly easy for someone listening to determine which packets belong to routers and which belong to servers.
There have also been a number of serious vulnerabilities discovered in SNMP. You should ensure that you are running the most recent versions available for your separate platforms.
If you decide to run SNMP, ensure that the environment is configured in such a way as to ensure that the information packets do not leak beyond the confines of your local network.
The graphs are presented through the web. Comparison can be made between current traffic loads, trends, and historical data. When a graph indicates that traffic volumes are outside the expected norm, an investigation can be launched.
Properly configured installations of this software can group devices and mimic the actual network topology. It is therefore rather simple to drill down through the graphs and statistics to find the individual machine that is causing the bottlenecks.
Ethereal
An additional tool that can be useful in monitoring network activity is Ethereal. This tool is an advanced packet-capturing tool capable of capturing all the conversations being transmitted across a network. Once conversations are captured, the stream of these packets can be reassembled, and both sides of the network conversation can be viewed. It is therefore possible to reconstruct Telnet and FTP sessions in their entirety. This includes the transmission of cleartext usernames and passwords. It is also possible to reconstruct web pages and binary transfers. Without the proper authority, running Ethereal may be interpreted as wiretapping. For this reason, it may be in conflict with a great many IT policies. In the proper hands, when used with the approval and knowledge of responsible parties, it can be instrumental in tracking down spurious traffic.
When used in conjunction with tools such as MRTG and Cacti, Ethereal can be used to further identify the source of traffic. As an example, assume that a known non-SNMP capable switch is hosting a machine that is causing network congestion. It is difficult to tell which of the hosts is generating the traffic because SNMP is unavailable to generate port-based statistics. Placing an Ethereal sniffer downstream from the switch will quickly identify which device is the most active.
ETHERAPE
An additional tool not bundled with SLES might be of great interest: This tool, called EtherApe, can be downloaded from the project home page at http://etherape.sourceforge.net/.
This application monitors network traffic and tracks conversations between hosts. It presents all its information in a graphical mode, tracing actual lines between the different hosts as conversations take place. The more traffic passed between the hosts, the more intense the line is drawn.
EtherApe is also capable of monitoring for specific types of traffic. From the information displayed and the protocols seen, it is fairly easy to deduce the tasking of the multiple hosts.
Again, such network monitoring should be done only with the written consent of the owners of the network.
Additionally, because Ethereal can capture whole conversations, it can be used to reconstruct network events. As you can imagine, the amount of traffic carried over a network is tremendous. Ethereal allows for the selection of packets for particular conversations and filters for specific traffic types. It is then possible to reconstruct whole sessions and examine the individual packet content.
ETHEREAL HOME PAGE
Your SLES installation comes with a version of Ethereal. Information on how to run it can be found in the local man pages.
You will probably want to visit the Ethereal home page to get an up-to-date version of the product. As new versions are introduced, it will be important to keep up with the documentation supplied. You can find the Ethereal home page at http://www.ethereal.com.
Keep in mind that written authorization by a individual who is allowed to give such permission should be obtained before this tool is used on any network.
Ethereal can be quite intrusive in terms of data privacy. Packets containing cleartext data can easily be reconstructed and sensitive information divulged. This is why most corporate IT security policies emphatically state that such applications are forbidden. In the proper hands and in the right circumstances, Ethereal can allow you to solve a myriad of network issues.
Summary
After reading this chapter, you should have a good comfort level with the concept of both host-and network-based intrusion detection systems. The tools presented here are all part of the SLES environment. Deploying these solutions can vastly improve your chances of detecting unwelcome visitors.
The tools presented here are an essential part of a proper HIDS and NIDS environment. On the host intrusion side, you saw tools that are capable of determining whether changes have been made to the content of the filesystem. You also saw other tools that can be used to monitor port scans of your systems.
On the network side, you looked at tools such as Snort and ACID and how you can use them to raise alerts when suspicious traffic is detected. You can watch for abnormal network loads using tools such as MRTG and Cacti. Such traffic can alert you to machines that might be compromised or at the very least are behaving in an unexpected fashion.
All these tools participate together in protecting your environment and contribute to a robust, layered defense against attacks.
The most difficult portion of intrusion detection is fine-tuning the various solutions. Improperly tuned environments generate a large number of false-positive results. This can lead to situations in which valid results are missed. Alternately, solutions that have been overtuned may become blind to a whole family of attack mechanisms.
Patience, vigilance, and a good knowledge of what is supposed to be present on your network infrastructure are the key factors to a successful implementation.