
Chapter 7 System Management and Monitoring
The main focus of this chapter is to introduce you to a number of processes that should be included in daily checks of the server environment. The level of attention given to a specific system depends on the system being managed. Some long-established static systems may require little attention. Other, newer, or more dynamic systems may need to be monitored much more closely. Only time will tell how much monitoring you need to do. Keep in mind, however, that the older, more static systems are also running on older hardware. Monitoring their health is just as important, if not more so.
This chapter describes the following topics:
![]() Common Linux commands
Common Linux commands
![]() A review of the root directory
A review of the root directory
![]() Health checks and system monitoring
Health checks and system monitoring
![]() System tuning opportunities
System tuning opportunities
It is impossible to eliminate all aspects of hardware failures from an environment. Applying redundancy such as RAID for disk subsystems and, when possible, clustering will enhance the robustness of the services offered. In the following sections, we look at a number of techniques that you can use to monitor a system’s health. Proper monitoring allows you to take more proactive measures when logs indicate resource consumption issues or problematic hardware.
Common Linux Commands
In the following sections, we look at a number of the basic commands you will use in the day-to-day management of your server. You can use these commands in conjunction with each other to gain quick access to detailed information on a process or an event. The output from the various commands can be piped through tools such as grep to further refine the scope of the information.
A Linux server can be conceptually subdivided into three main categories. Though this subdivision is not rigorous, we have categorized the basic commands into these distinct areas of interest: system control, the filesystem, memory, and processes.
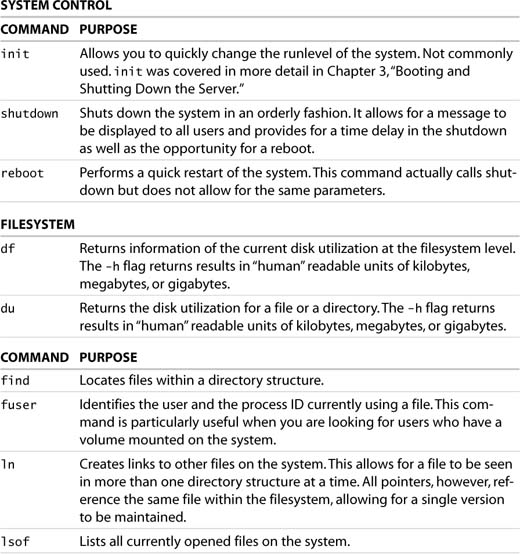
A number of these commands have been used in examples throughout this book. Table 7.1 provides a quick synopsis of the most commonly used commands, and we expand on a number of them in upcoming sections within this chapter. You can find a more detailed explanation of the various command-line parameters for each in the man and info pages.
Table 7.1. Commonly Used Linux Commands

Additional Tools
You also can use the following tools:

The preceding certainly does not provide an exhaustive list of the available commands. As you gain experience using these commands individually, combining the pipe tool with grep, awk, or wc will become second nature.
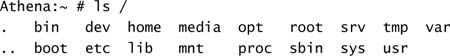
The Linux filesystem is logically one large directory structure. In a default install of SLES, unless otherwise specified, the entirety of the file structure is placed on a single disk partition. Because the / partition is the parent to all other portions of the filesystem, it is called the root. When a system is originally installed, the root is populated by directories only. The following directories are present by default:
In Linux, you can add additional disk capacity to a system. To do this, you attach the new disk by mapping its contents into the directory tree and providing a unique directory from which it can be accessed. This directory is called a mount point. Adding disk capacity is identical to adding removable media to the system and temporarily associating it with the /mnt directory. In the case of a permanent mount, the disk information is associated with the mount point in /etc/fstab.
In essence, any directory on the system can be associated, either temporarily or permanently, to additional storage. The root of the filesystem is bound to the selected target disk at install time. All the other directories under the root, however, are considered not only directories but possible mount points. In Chapter 2, “Updating the Server,” we discussed the addition of extra storage and how it was possible to migrate the contents of /home and /srv from simple directories and convert them to individual disk partition mount points. Table 7.2 lists the directories in the root and summarizes their purpose.
Table 7.2. Default Mount Points
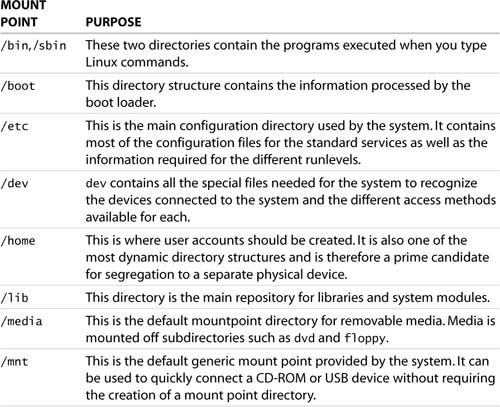

All these mount points are candidates for conversion to separate physical devices. It is important to note that if the root partition becomes full, the system will no longer be able to log activity or create any temporary files and will simply cease functioning until it can resume these two tasks. It is therefore imperative to prevent this from happening by segregating the more dynamic directory structures, such as /srv, /var, and /home, onto separate physical partitions. Segregating the structures alleviates disk space contention on the root volume. As the system matures, growth of the individual mount points will also be easier to monitor.
Health Checks and System Monitoring
In previous chapters, we described how to install and configure the system and its software components. We also covered the steps required to add users to the system. In the following sections, we monitor how the two interact.
Daily cycle checks of machines and equipment are an important facet of offering robust services. Only by knowing what is going on can you get a feel for what may need attention. The frequency and depth of these checks depend on your comfort level with the system and its importance to the organization. As a rule of thumb, daily checks are a good starting point. Here is a suggested list of what should be checked:
![]() Machine uptime
Machine uptime
![]() Log review
Log review
![]() Top consumers
Top consumers
![]() Application checks
Application checks
![]() User login activity
User login activity
![]() System resource checks
System resource checks
The examples given in this chapter are based on our own personal preferences. They are intended as a quick guide for extracting system information on the fly. The examples are in no way an exhaustive list of the tools available—just our favorites. As you become more knowledgeable with the system, you will almost certainly progress beyond simple commands and move into scripts or third-party layered applications. However, we believe these tools will suffice as a starting point.
Machine Uptime
Though current versions of Linux are very robust, it is important to check how long the system has been running. System reboots can be caused by hardware failures, software failures, or human intervention. If an unscheduled reboot occurred, it is important to find out why.
The uptime command provides a quick snapshot of the state of the system, including the current time, the time the system has been running, and user load:
Athena:~ # uptime
8:47am up 3:18, 3 users, load average: 0.30, 0.29, 0.21
Athena:~ #
As this example illustrates, the machine has been running for just over three hours. Because we require our system to be very robust, such a short uptime should lead to some sort of investigation. Typically, this will be due to a scheduled shutdown for hardware maintenance. If this is not the case, a review of the logs might indicate what is going on.
Load averages are supplied to provide a quick verification of the status of the system. Dramatic shifts in load between the 1-, 5-, and 15-minute figures could alert the system administrator to potential problems. Increases can indicate a runaway process, whereas drops in activity can indicate that clients can no longer reach the server.
Log Review
When you are reviewing the health of a system, it is important to look through the logs. Each system component places information in the appropriate log file. This information can be as simple as a time stamp or process milestone marker, or the log may contain information on the pending failure of a hardware component.
You can find system boot information in two ways. First, you can use the dmesg command to examine the content of the kernel ring buffer. This buffer contains the most current messages generated by the kernel. At boot time, many of the important hardware discovery phases are logged here. A review of this information yields detailed hardware information on BIOS, memory, disk, and IRQs. The boot information is available in a secondary location that provides yet again more detail. The /var/log/boot.msg file contains all the messages from various sources generated during a system startup. It is a good idea to review these sources periodically to ensure that the expected hardware matches and that no warning messages are present that might affect system performance.
Linux maintains application-specific log files. The location of the log files and their content can be controlled through the /etc/syslog.conf file. In a default install of SLES, you can find all application-specific log information under the /var/log directory structure.
Within this structure, many individual services such as YaST, Samba, and Apache maintain distinct directories of application-specific messages. It is important to review many of these service log files periodically. They can not only reveal local configuration errors within the system, but they also log connection information from all sources.
To identify attack vectors such as infected machines and system probes, you can review connection failure logs. Additionally, you should check Internet-facing machine logs frequently for signs of valid connections requesting nonexistent resources such as login attempts on default account names or requests for invalid web pages.
NOTE
To get an appreciation for the information contained in log files, simply review the Apache failure logs for an Internet-facing machine. The number of errors generated by requests for nonexistent pages can be staggering. A large number of these requests come from script kiddies who launch IIS-specific attacks against Apache servers. Once these individuals discover your site, it is a good idea to keep a vigilant eye on these logs.
It is also very important to check the firewall logs. By default, they are merged into the standard /var/log/messages file. We have stated many times how important it is to offer only services that are required. A periodic review of the firewall logs will expose connection failures. The source of the failure and the nature of the access requested could bring to light misconfigured client machines and possibly exploit attempts. In many instances, infected desktop computers are capable of generating volumes of traffic and probes as the worm or virus tries to replicate. A proper review of server-side firewall logs for internal (trusted network) events is just as important as dissecting the external firewall logs. This topic is explored further in Chapter 12, “Intrusion Detection.”
Two log files that you will reference the most often are warn and messages in /var/log. These files contain most of the regular error messages generated by applications and users. Some of the important messages you will want to scan for could be requests for elevated privileges such as
Mar 13 11:26:23 Athena sudo: hart : 3 incorrect password![]() attempts ; TTY=ptst
attempts ; TTY=ptst
It will take a second to verify that hart is allowed access to sudo and that this user is just having a hard day. On the other hand, if a different username were to show up, it may be an indication of someone trying to gain unsanctioned access.
This section emphasized the importance of log files in tracking system activities. It is important to note that as these log files grow, they will also need to be maintained. Log file retention is essential in guaranteeing that you have a continuous log of system activity.
In the event of an incident that seems to indicate a system compromise, archived logs are essential in tracking down the history of the intrusion. Often, daily reviews of the log files are not possible. Using a utility such as logrotate can ensure that logs are stored in a central location in a manageable format.
Top Consumers
Log files are important for tracing historical events. Unless a process generates a fault or an informational message, it may exist for quite some time unnoticed. As part of your daily exercise, it is a good idea to get a feel for the load on a server. This type of monitoring will help you understand the resource consumption on a typical day, forecast when a resource upgrade may be required, and quickly identify abnormal loads.
You can use the top command to generate a dynamic listing of the current processes load of a system. As applications require more resources, they percolate up the list. Listing 7.1 shows an example of the output generated by top. The information presented is dynamic; this is, of course, just a snapshot in time.
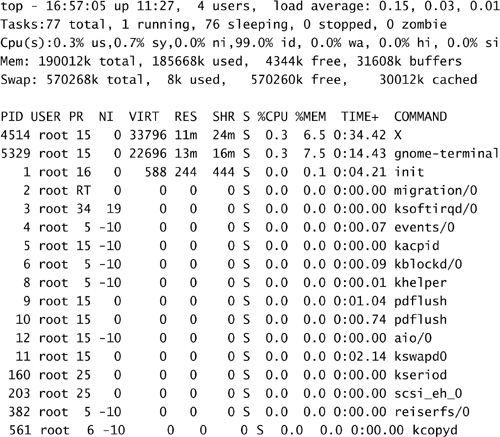
The top command is very useful when the machine appears to be sluggish. A quick glance at its output can reveal whether the situation is due to CPU consumption, excessive swapping, or particular processes running at odd priorities.
The top process also lists the name of the running executable. As you become familiar with the most common names, odd user-written application names may appear in the list. By matching the user and application columns, you can quickly identify the rogue application.
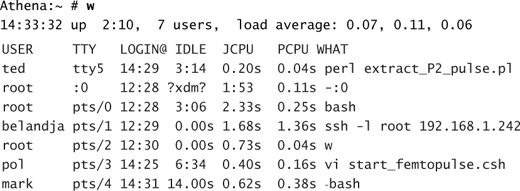
Another tool that is very useful is the w command. This command provides a quick summary of who is currently logged on to the system and what programs they are running. On the current system, w returns the following output:

From this, you can get a good idea as to who is currently working on the system, what they are doing, and what type of resource impact they are having on the system.
Application Check
When applications become unresponsive to the end user, it typically does not take a long time for the operations crew to be made aware of the situation. Before you forage through the appropriate log file, though, a quick glance at the running processes might be in order.
One method for checking on the presence of an application is to use the ps command. The Process Status command (ps) generates a list of all the running processes on a system. In addition, you can use modifiers to selectively extract information for the target service. One method for checking on an application is to use the ps command and filter the output through grep:

In this example, the -e (every process) and -f (full listing format) modifiers were used to qualify the ps verb. The output from the ps verb was then filtered through grep to extract only the records containing the Telnet process. It is important to remember that, in this case, Telnet does not have its own daemon process. It is part of the xinetd server offerings. As such, the preceding command returns existing Telnet connections, not the presence of the actual server process.
A different method for checking the existence of a service is to verify whether their characteristic port is being advertised by the server. Because each protocol, be it httpd, sshd, or telnetd, offers a specific port to the network, you can quickly check for an open listener process on the port. The netstat command can list various attributes of a server’s networking environment. You can specify the -l parameter to list all listeners and the -p parameter to identify the program offering the service. The result would look like the following:
Athena:~ # netstat -lp | grep -e http
tcp 0 0 *:https *:* LISTEN 4601/httpd2-prefork
Athena:~ #
By using the process ID, you can find all related processes and identify the routines offering the service:

Using this approach , you can quickly verify the presence of a service through its process name or port offerings. You can now verify the application-specific log files for possible errors. If none are present, the application unresponsiveness may be due to resource constraints from other processes.
System Resource Check
A server can be thought of as a container for resources. Application programs, in turn, consume these resources. Well-behaved applications start up, allocate a portion of available memory, utilize a moderate amount of CPU, write a controlled amount of information back to the appropriate files, and then terminate.
Of the resources used by an application, only the CPU resource can be thought of as unlimited. Though only so much processing power is available at any moment in time, a well-behaved application consumes only a little bit at a time. The faster the CPU, the faster the job completes. After the job has terminated, the portion of the CPU’s time spent processing the application is now available for other processes.
The same cannot be said for memory and disk resources. When their total complement is consumed, no further processing can take place until some of these resources are freed. In most cases, a well-behaved program releases all its allocated memory upon exit. When this does not happen properly, the application is said to have a memory leak. If the application is run a sufficient number of times, eventually the memory leak will consume all the available process memory on the machines.
Similarly, applications that create large output data files and log files often consume vast amounts of disk space. Though disk quotas mitigate against user applications from filling the disk, typical services are not constrained in regards to disk space consumption. In the event of a misbehaving client application or an attack, it is quite possible that the service log files consume all available disk space in a partition.
The preceding describes what could be considered the worst-case scenario. Diligence will ensure that these conditions are less likely to happen. The following commands are suggested additions to your daily server health checks.
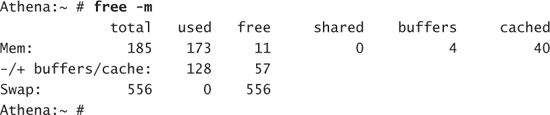
You can address memory consumption using the top command discussed earlier in the chapter. You also can use a number of other commands to determine the current memory demands:
free lists the current amount of free memory on the system. The -m parameter lists the amounts in megabytes.
procinfo displays the system status information contained within the /proc filesystem. The following is a truncated version of the information returned:

Bootup:Sun Mar 13 04:29:44 2005 Load average:0.06 0.09 0.04![]() 1/99 8152
1/99 8152
Disk space consumption can be tracked using the following commands:
df displays disk usage by mounted filesystem:

mount, though typically used for adding resources, can be typed without parameters to display a list of what is currently mounted on the system. A systematic review of this information, coupled with the content of /etc/fstab, may identify missing partitions or mount points:
Athena:~ # mount
/dev/sda2 on / type reiserfs (rw,acl,user_xattr)
proc on /proc type proc (rw)
tmpfs on /dev/shm type tmpfs (rw)
devpts on /dev/pts type devpts (rw,mode=0620,gid=5)
/dev/hdc on /media/dvd type subfs (ro,nosuid,nodev, fs=cdfss,procuid,iocharset=ut
f8)
/dev/fd0 on /media/floppy type subfs (rw,nosuid,nodev,sync, fs=floppyfss,procuid)
/dev/sdb1 on /home type ext3 (rw,acl,user_xattr,usrquota)
usbfs on /proc/bus/usb type usbfs (rw)
Athena:
User Login Activity
Several situations require auditing system access. Auditing is not done to invade anyone’s privacy but is a requirement for tracking both system performance and application access. Knowing system load, response times, and processes generating the load is important in order to provide satisfactory service. Another reason for tracking users is to facilitate the investigation of spurious and inappropriate activity that might indicate a compromise of the system. This topic will be explored further in Chapter 12. In this section, we examine a number of commands that can provide user access information.
The w or who commands display which accounts are currently logged in to the system. Here’s an example:
If more information is required for the currently signed-on users, you need to access the information more indirectly. Each user on the running system creates a login session. This login session is the parent for additional child processes. Additional user information can be extracted by accessing the currently active process information. You can do this in a number of ways. Each of the following examples reports information with varying amounts of detail.
pstree displays a tree of processes:
Athena:~ # pstree -U pol
sshd???bash???vi
ps reports process status:

lsof lists open files:
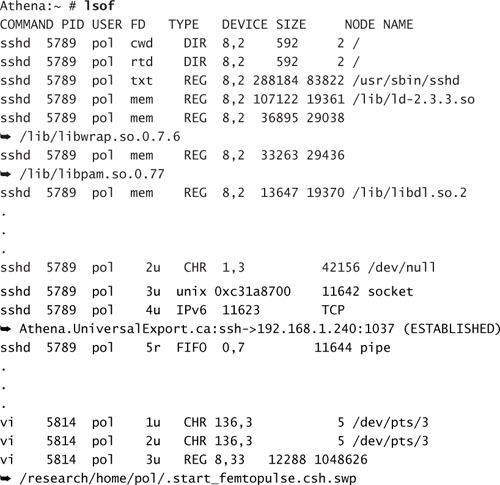
The lsof command returns a great deal of information about the selected user. A majority of the files listed are standard system libraries and modules. Depending on the details required, this command may yield too much information to be useful.
NOTE
The lsof command will prove itself quite useful in Chapter 13, “System Security.” In that chapter, we will be required to enumerate all files used by a specific application. lsof can perform this task quite easily.
Other commands can be used to extract information indicating when users accessed the server in the past. This information may be important if you are trying to find out who was on the system at a specific point in time. The last command provides information on all logins, their source, as well as the period of time the session was active. A couple of examples of the last command are shown here:

Without specifying a username, it is possible to generate a login log for all users on the system:

You can use a separate command to quickly extract the last login times of certain accounts. This can be a quick way to check for unused accounts or accounts that are being used but shouldn’t be. Here’s an example of the lastlog command:
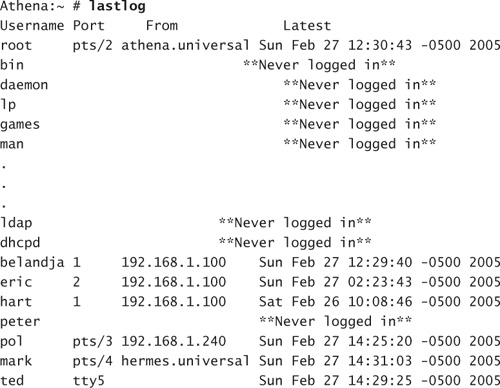
This command provides a listing of all the accounts on the system as well as times they were last logged in to the system and the source of the login. Because of the large number of system process accounts, the list can grow quite large. You might be tempted to parse the output of this command using grep to remove all accounts that have never been used:

Parsing the output this way is an acceptable practice if you are looking for individual accounts that you know have been active. The raw lastlog command does, however, provide additional information about the system process accounts. Verifying that they have not been used for an interactive login could prove quite useful.
Knowing that a specific account was used in an inappropriate manner is one thing. Being able to identify the individual who used the account is much more difficult. Verifying the number of login failures for an account is an important step. Excessive login failures might be an indication of a password hack attack—possibly a successful one. The faillog command allows you to check the number of times a login attempt was unsuccessful against each account:

An indication of a large number of login failures on an account might indicate that the password on the account was hacked. It may also be a ruse. Having a sound account password policy and including the PAM module pam_tally to lock out accounts after a set number of failed attempts are important steps you can take. This way, you can mitigate some of the exposure to password-harvesting attacks. This also helps you in ensuring that the person who last logged in to a specific account knew the password.
In this section, you saw numerous methods for extracting user login information. You can use this information to help investigate resource issues. This information can also be used as a starting point in investigating suspect behavior on the system.
System Tuning
The initial performance of a server is based on a number of parameters set by the supplier of the operating system. In the case of SLES, these parameters are chosen to satisfy a broad range of server types. Each service can require different resources. Some services are memory or bandwidth intensive, whereas others are CPU intensive. These various factors are balanced by default to provide a responsive server regardless of its initial tasking.
What cannot be anticipated, however, are the resources available from the hardware supplied. SUSE specifies a number of minimum requirements to provide a stable environment. In most cases, meeting these minimum requirements is not an issue. As resource limits start contributing to performance issues, memory or disk space can be added to a server.
In some situations, however, the tasking of a server is outside the designed norm. In these cases, you must entertain changes to the fundamental assumptions in the original configuration.
In Linux- and Unix-based systems, the core program of the operating system is called the kernel. The kernel is built just like any other program. It incorporates within its structure the original assumptions of the configuration team. These assumptions govern which device types are available such as IDE or SCSI disks, how memory will be managed, and if additional modules can be loaded dynamically. Adding and removing capabilities within the configuration of the kernel can increase flexibility and performance.
When such situations arise, you often need to alter the actual Linux kernel itself. This can be done in a couple of different ways. One option is to recompile the kernel to include additional functionality. The preferred method, when available, is to take advantage of the flexibility of the default kernel and simply tune some of its runtime parameters.
Tuning Kernel Parameters
A number of applications have been ported to Linux. Some of them, such as database applications, have resource requirements that are significantly different from those of typical Linux services. To satisfy these needs, you must make changes to the way the kernel operates by tuning application-specific parameters.
In older versions of Unix, these changes required a rebuild of the kernel itself. Though not an insurmountable feat, rebuilding the kernel is certainly a daunting task for someone who has never done it. Luckily, the Linux kernel is flexible and dynamic. Changes to the Linux kernel can be made in real-time without requiring a reboot.
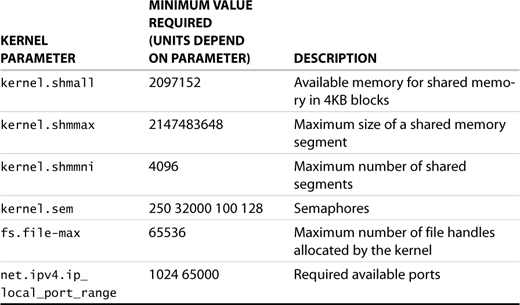
As an example, let’s look at the changes required to the Linux kernel for it to be able to run Oracle 10g. These changes are supplied in a script run at install time; for argument’s sake, say you want to make these changes manually. The Oracle 10g requirements are shown in Table 7.3.
Table 7.3. Oracle 10g SUSE LINUX Kernel Requirements
NOTE
Tuning the kernel is a task that should only be undertaken with great care. Changes made could generate an environment that is unable to function. There are a number of sites on the Internet that discuss the Linux kernel and its parameters. Visit one of these for more information:
You can use the sysctl command to query the values currently in use by the running kernel. Specifying the -a switch lists all the parameters. Each individual parameter can be checked using syntax similar to the following:
Athena:~ # sysctl kernel.shmmax
kernel.shmmax = 33554432
As you can see, this parameter value is well below the minimum required for Oracle. To set the value, use the following syntax:
Athena:~ # sysctl -w kernel.shmmax=2147483648
kernel.shmmax = 2147483648
This syntax sets the new value for the kernel parameter and acknowledges the new value.
Most typical installations of SLES come with well-configured kernel parameters. It is not necessary to change these values unless the server in question is running an atypical configuration. In most cases, like Oracle, you will be given the necessary minimum values and most probably a script to make the changes. If not, following the procedure shown here, you can check for compliance to the minimum recommended values as well as set the parameters as recommended.
Tuning Filesystem Access
Previously, we discussed how the Linux filesystem is considered one large logical tree. Table 7.2 identifies the directories created under the root in a standard installation. Sometimes, however, the default install does not satisfy your needs.
In Chapter 2, we presented an overview on how to migrate two of the standard directories in the root to a different disk resource. This process is typically performed when the disk consumption in those branches is expected to impact the overall system. When these directories are part of the same physical partition as the root, should they fill all available space, the system would become unresponsive. The process of adjusting the availability of different directories is known as tuning the filesystem.
When the disk makeup of a production server is designed, directories with dynamic content such as /usr, /home, and /var are often placed on separate physical disk partitions. When possible, they are also placed on different physical devices to distribute I/O operations. Though modern disk subsystems are very fast, extracting every bit of performance possible is a good practice. One added benefit to placing them on separate physical devices is that in the event of a disk subsystem failure, fewer partitions may need to be restored.
An additional aspect to filesystem tuning is that of granting access to portions of the directory tree. The initial owner and the group membership of a mount point are root. The rights mask allows for nonroot users to access the contents of directories under the mount point. This is a necessary condition when a mount point contains portions of the standard tree.
Previously, we constrained ourselves to the default directory structure in the root of the filesystem. Because this is just a simple directory, there are no set limitations on the creation of additional directories or mount points in the root. Additionally, there are no limitations that state all mount points must be in the root. It is an important system management practice to keep the root as clean a possible, but that doesn’t mean it must be pristine. The following two examples explore methods for adding additional storage to a server and limiting access to the new resource.
If a group of research users are working on a collaborative project, they may need to be segregated onto separate storage for the server to reduce their impact on other users. As part of the process, they should have their home directories placed there. Also, due to the nature of the research, only members of the group may have access to the mount point.
This result can be accomplished by specifying a new mount point in the root /research. A number of filesystems permit restricting access to the mounted partition to specific UID and GID. Mount does not support these features for ext3 or Reiser partitions. Access to specific individuals or groups therefore must be restricted a different way. The following steps can serve as a guide to creating a directory structure specific to the research group:
1. Create a group called research for the project.
2. Prepare the new partition using fdisk and mkfs.
3. Create a standard directory named /research for mounting the new resource.
4. Modify /etc/fstab to allow the partition to be mounted at boot time.
5. Execute a mount -a command to verify that the partition is mounted correctly.
6. Change the group membership of the mount point directory using chgrp research /research.
7. Change the access permissions on the mount point directory using chmod 6770 /research.
8. Create containers for the home directories of the users and one for the project data using mkdir /research/home and mkdir /research/project.
9. Adjust the permissions on these directories using chmod 6770 /research/home and chmod 6770 /research/project.
NOTE
In the preceding set of steps, the ownership of the root directory is left as root. This might seem counter-intuitive because you would probably like it to belong to a member of the group.
Making a group member the owner of the directory generates another issue. If the selected individual leaves, his or her account will be deleted and the UID orphaned. Any new account accidentally given the same UID would automatically be granted access.
You could create a placeholder account, set it so that it is not allowed to log on, and make it a member of the group. Since this service account is never used and unable to log in, the UID associated would remain in service. If, however, the account is changed, maliciously or not, access to the information would be granted without any way of tracking the access.
It is best in this case to leave the ownership as root. Individuals will have access to the directory structure through the group permissions.
At this stage, you can relocate existing users to the new location for their home directories by updating their account information and moving the contents of their directories. Existing users will also have to be added to the group research. New users can be created directly into the new structure and added to the research group. The resulting directories will look like the following:
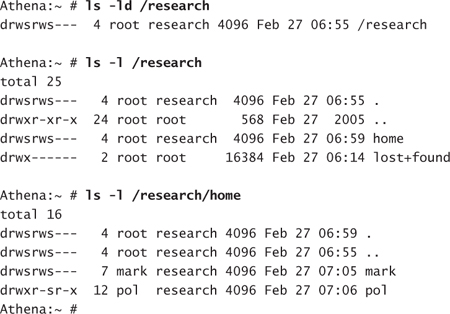
The protection on these directories allows for full access to root and members of the group research. At the same time, all other users of the system are denied access. It is imperative to adjust the backup utility to permit access to the contents of the structure.
NOTE
The man page for mount goes into more detail about the various options available for the various filesystem types. A number of filesystem types allow for the ownership of a mounted volume to be specified by UID/GID. This certainly makes things easier for restricting access. In some cases, however, the ownership of all files is forced to the same user or group as that specified in the mount options. In addition, the robustness of Reiserfs and ext3 are lost. We certainly encourage choosing the more robust filesystem.
Another typical request is for a large dataset to be made available to everyone on the system. The catch is that the dataset must be available in a read-only format. You can accomplish this by creating a mount point off the root—for example, /gisdata—and specifying that the partition in question be mounted using the ro option in fstab. It would look something like this:
/dev/sdc1 /gisdata ext3 ro 1 2
The resulting directory will be available to all users for read access. If additional information needs to be added to the structure, the partition can be dismounted, remounted on a different mount point with write privileges, and updated. mount can also use the user option to specify an individual who is allowed to mount/umount the mount point. Combined with the sudo granting of mount/umount, the maintenance of the dataset could be delegated to an individual within the user group responsible for the data.
This section examined the splitting of the typical root directory structure across multiple disk partitions. This is often done to segregate dynamic directory structures from the more static ones. Multiple devices also allow for distributing I/O operations, resulting in improved performance. The other aspect of filesystem management is restricting access to certain areas of the directory. This restriction can be applied across the board or to a specific group. The flexibility this capability offers allows you, the system administrator, more granularity in delivering storage to your customers.
Summary
In this chapter, we covered many aspects of system management. Topics such as system backups and user account management are covered in separate chapters. Here, we focused on the day-to-day aspects of maintaining the server.
We reviewed a number of common commands used to extract resource information from the system. Also, we examined the base directory structure of the root directory and explained the contents of the directories. In addition, we suggested a number of steps to help you in your day-to-day monitoring checks for servers. In the case of resource consumption, we also suggested a number of remedies.