
Creating a Windows Forms Report
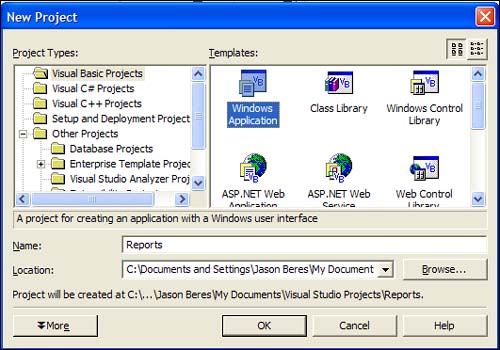
The first report you're going to write is a simple bound report using the Windows Forms viewer. To begin, start Visual Studio .NET and create a new Windows Forms application. Change the name of the application to Reports, as Figure 18.1 demonstrates.
Figure 18.1. Creating the Reports Windows Forms application.
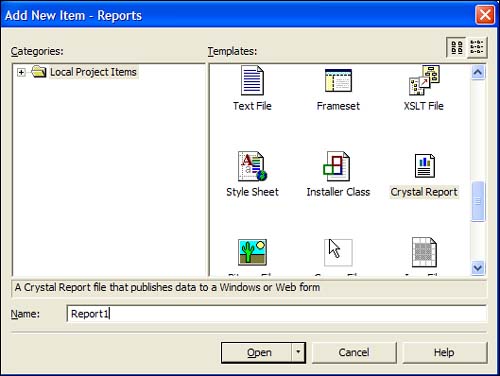
After the application is loaded, right-click on the Reports project name in the Solution Explorer and select Add, New Item from the contextual menu. When the New Item dialog box pops up, scroll down until you see the Crystal Report item. Select the Crystal Report item and change its name to Report1, as shown in Figure 18.2.
Figure 18.2. Adding a new Crystal Report to your application.
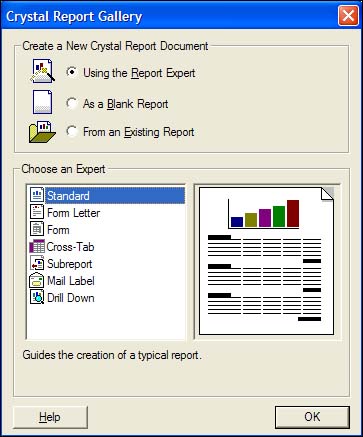
At this point, the Crystal Report Gallery dialog box pops up. Each time you add a new report to your solution, you're prompted with the Report Gallery dialog box from which you can select the type of report you want to create. Most of the time, you'll use the Report Export. The Blank Report option gives you a blank designer with which you can add fields manually. If you choose Existing Report, you can add a report created by someone else in Visual Studio .NET or you can import an existing report that was created with the full version of Crystal Reports.
By choosing either Report Expert or Blank Report, you can select from the list of templates that give you the basic look and feel of the report. These include
Standard
Form Letter
Form
Cross-Tab
Subreport
Mail Label
Drill Down
For the purpose of your first report, choose the Report Expert option and then select the Standard expert, as Figure 18.3 demonstrates.
Figure 18.3. Choosing the Report Type from the Report Gallery.
After you choose the Standard Report type, you're taken to the Standard Report Expert. The Expert is a tabbed dialog wizard that guides you through the definition of your report. The Report Experts are what make using Crystal so easy: You answer some questions and, like magic, you have a report that's ready to go.
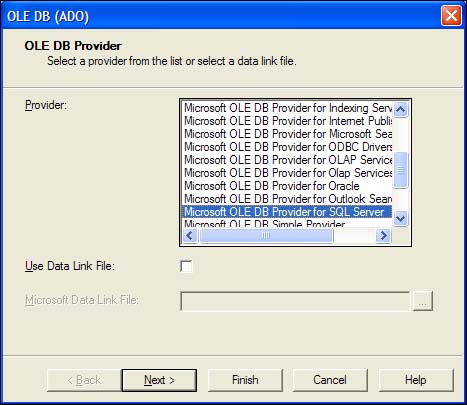
The first step of the wizard is to set the data source information. Based on the type of report you're creating, the data source can be any type of ODBC connection, OLE DB connections, RDO connection, XML files, an ADO.NET dataset, and so on. For this report, no datasets are defined in the application, so you're going to drill into the OLE DB connections node. When you drill into the node, the OLE DB provider dialog pops up. If you had existing reports with OLE DB connections, they would be listed there. Because this is the first time you're running the Expert, you must fill out the information to get a database connection. Figure 18.4 shows the initial selection screen for the OLE DB provider. Select the SQL Server OLE DB provider as shown.
Figure 18.4. Selecting the OLE DB provider for your report.
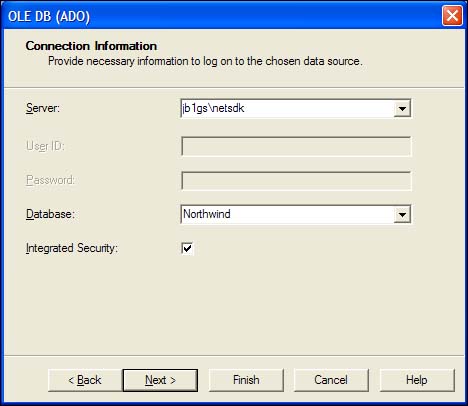
When you click Next after selecting the SQL Server OLE DB provider, you're prompted for the connection information to the SQL Server or MSDE database. For this report, you're going to use the Northwind database in MSDE, so enter the correct machine nameNETSDK database, select the Integrated Security check box, and then select Northwind from the Database drop-down list as shown in Figure 18.5.
Figure 18.5. Setting the connection parameters for the OLE DB connection.
After you've set the correct login information and selected the Northwind database, click the Finish button on the OLE DB provider dialog.
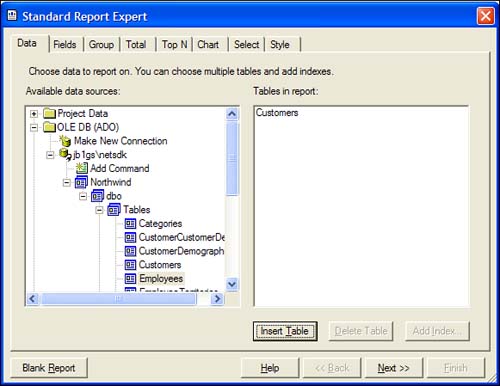
Now that you've defined the connection parameters, the objects from the connection are displayed in the OLE DB node of the Expert. At this point, you have the option to create a command to retrieve the data from the database or select one or more tables from the Tables under the Northwind node. For this report, you're going to create a simple list of names from the Customers table, so select the Customers table from the Northwind database and click the Insert Table button as Figure 18.6 demonstrates.
Figure 18.6. Selecting the Customers table for the report.
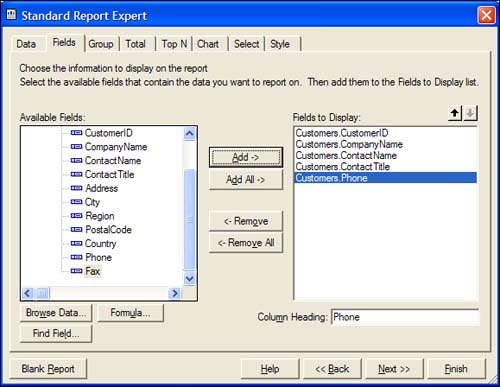
After you click the Next button, you're taken to the Fields tab. Now you can select the fields that you want to bind to your report. From this tab, you can also view the data from SQL Server by clicking the Browse Data button or you can create a formula field by clicking the Formula button. A formula is composed of simple or complex selection criteria that you can set for any field in a report. Using either the Crystal Syntax or Basic Syntax, you can create formulas to select data, format data, or create custom summary or aggregate fields. In this report, you won't be using any formulas. Select the following fields and click the Add button:
CustomerID
CompanyName
ContactName
ContactTitle
Phone
The Fields tab should now resemble Figure 18.7.
Figure 18.7. Selecting the bound fields for your report.
As you select the fields on the Fields tab, you can also modify the Column Heading text box for each corresponding field that you select. This is an easy way to make the column names more user friendly.
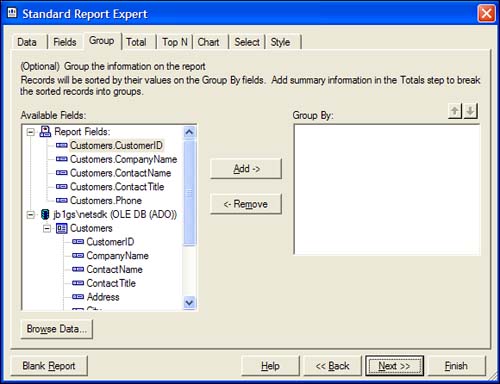
After you click the Next button, you're on the Group tab. Grouping is normally a pain in the neck when writing code, but with Crystal it's a simple field selection. Because there's only one table in this report, there's no need to do any grouping. But if you had added the Customers and Orders tables, you could select the CustomerID field to group by. This would automatically create a group hierarchy in your report. Your Group tab should look like Figure 18.8.
Figure 18.8. Selecting the Group By field.
The next tab is the Total tab. In this report, the data is all alphanumeric customer information, so no automatic summary or total fields are needed. If you click Next again, you're at the Top N tab. From here, you can select the Top N values for any of the calculated fields you selected in the Total tab. These include the Top N, Bottom N, Top Percentage, and Bottom Percentage of the selected fields based on the selected total fields. Because you didn't select any Total fields, the Top N tab won't be available.
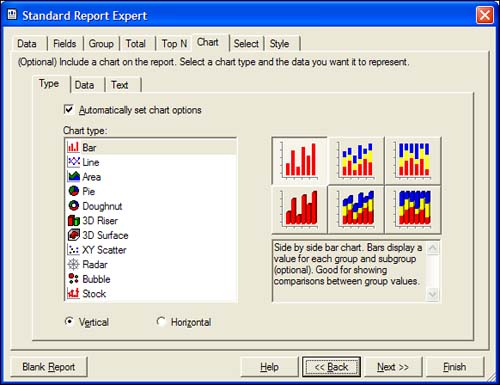
The next step in the wizard is selecting the type of chart you want to display on your report. Charting is a very powerful feature of Crystal that enables you to select a wide variety of chart, including bar, pie, stock, and 3D. Based on the fields selected in a report, you can specify what data you want to display in the chart. Figure 18.9 gives you an idea of what you can do with charting. For this report, you won't need a chart.
Figure 18.9. Selecting the charting option in the Report Expert.
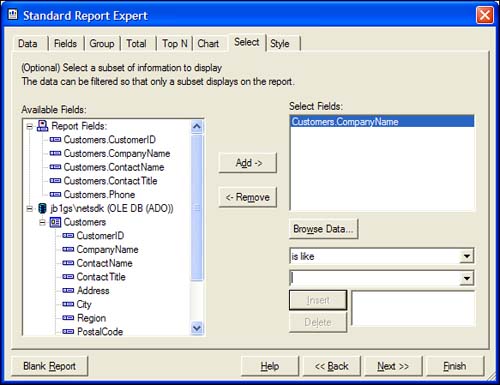
The next tab, Select, enables you to filter data for the report. By choosing fields to select or filter, you can improve the speed of a report or limit the data the end user is expecting. After you've selected a field, either from the Report Fields node or the Connection node, you can specify a number of filtering statements. For example, you can select the CompanyName field, and then set the criteria to “greater than or equal to C,” which returns all records in the report with a CompanyName that start with the letter C or any letter after C. You can also have multiple criteria, and include filters that are fields not selected for the report itself. For this report, you aren't filtering any data, but Figure 18.10 gives you an idea of the power and flexibility of using the Select tab to define report requirements.
Figure 18.10. Using the Select tab to filter records for the report.
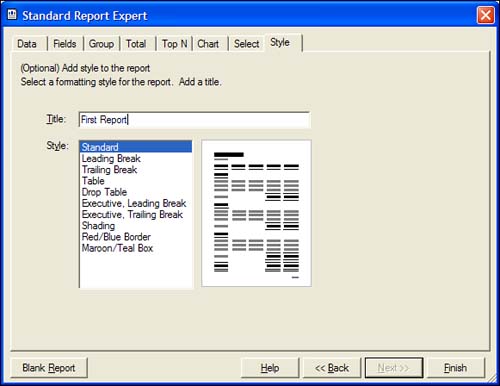
If you click Next, you're at the last step of the Expert. On this tab, you can define the title of your report and select the formatting of the report. The options specified here are most useful in a group report, where there are a number of levels of data to display. You can decide whether you want the report data displayed in a table, a drop table, or in different colors and shading. For this report, enter First Report as the title and select the Standard report option, as Figure 18.11 demonstrates.
Figure 18.11. Selecting the report format and setting the title.
After you click finish, the Expert takes the information you entered and creates your report. Figure 18.12 is what you should see.
Figure 18.12. The completed Report1 in the Crystal Designer.
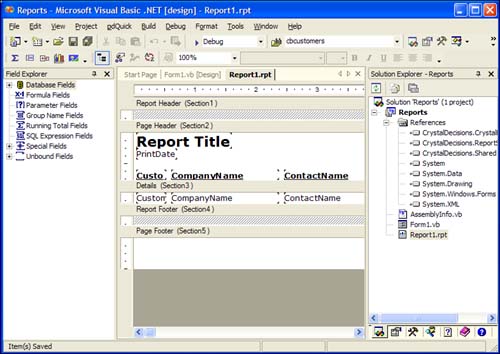
Look in the Solution Explorer, and you'll see that you have a Report1.rpt file. This is the Crystal Report that's in the designer. Each .rpt file works like a Web Form; there's a code-behind class file that the .rpt file uses to create the report. This class file is automatically generated by the wizard and shouldn't be messed with. This file is altered each time you modify something on the report, so you'd most likely lose any changes that you make to this file.
The Crystal Designer is laid out similarly to any other designer in .NET, and you have the ability to move controls on the designer and change properties. When working with reports, the designer is broken down by the printable sections for a report. Each report contains a
Report header
Page header
Details section
Report footer
Page footer
Group headers and footers
Based on the type of report that you're designing, you can show or hide any of the sections. For example, when you create a Summary report, you may have a group on a month field from the database. To just display the group summary calculations, you can suppress or hide the Details section of the report. Each different report has a Format Section option that you can access by right-clicking the gray bar that represents the section in the designer. From the Section Expert, you can set different print, page break, and section suppression settings.
The true data manipulation power of Crystal is in the File Explorer, which is docked on the left of the Visual Studio .NET IDE. The File Explorer has the features of the Toolbox, Properties window, and more—all in the window—giving you complete customization of the report you're designing. Let's take a look at each section of the File Explorer to get an idea of what you can do.
Using the Database Fields Node
If you drill into the Database Fields node, you have access to all the fields from the tables you selected in the Expert. The fields that are actually used in the report have a red check mark to the left of each field name. For the report you're creating now, you'll see the Customers table. If there were multiple tables in the report, each table would be listed in the Database Fields node.
From this node, you can drag fields to the designer to include in the report, just as you would drag a control from the Toolbox onto a form. If you right-click any of the fields in the table, you can browse the field data from the data source, or rerun the Select Expert to filter or select specific records. If you decide that you want to add another table to your report, you can select the Add/Remove Database menu item from the right-click contextual menu to modify the database tables. If you remove an existing database that has fields on the report, you must manually remove the fields from the report designer.
Using the Formula Fields Node
By right-clicking the Formula Fields node and selecting New from the context menu, you bring up a prompt for a formula name. After you enter a name and click OK, the Formula Editor dialog pops up. Using the editor, you can define special formula fields to use in your reports. For example, in Figure 18.13, I used the Formula Editor to create a formula that creates a field named @@formula, which makes the CompanyName field all uppercase if it starts with the letter C.
Figure 18.13. Adding a custom formula using the Formula Editor.
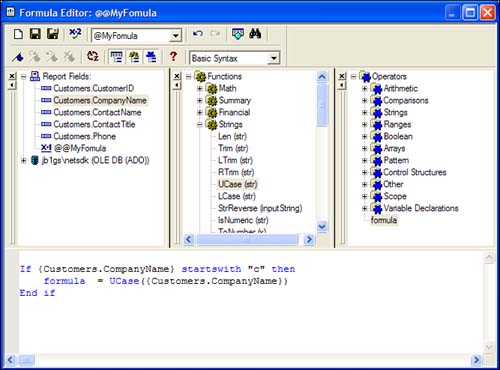
I mentioned earlier that the syntax can be Basic or Crystal, so depending on your preference, you can use either one. The great thing about the editor is that you can simply double-click any of the hundreds of predefined functions or operators and then just place the database fields that you want to manipulate.
After you've verified the syntax of the formula by using the Verify Syntax button, clicking the Save button adds the formula under the Formula Fields node. From here, you can drag the formula field onto your report as you would any other database field.
Using the Parameter Fields Node
Parameter fields enable you to specify parameters that can be passed to a report. For example, you can create a parameter named @CustomerID. Then from your C# or Visual Basic .NET code, you could use the Crystal classes to pass the correct values to the report, and the report would filter data based on your parameter. This makes a filtered or multiselect report very easy to implement. If you don't want to write the code to do the filtering, you can use the tools in the Parameter Fields dialog to specify filtering options.
When you right-click on the Parameter Fields node and select New, you're prompted with the Create Parameter Field dialog box shown in Figure 18.14.
Figure 18.14. The Create Parameter Field dialog box.
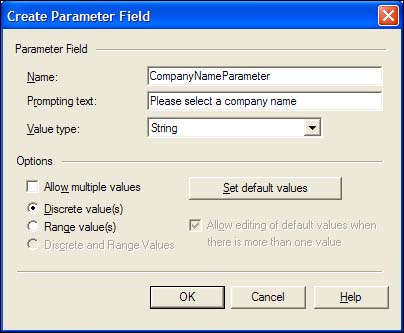
From this dialog, you specify a name, data type, and type of parameter selection that will occur. If you're passing parameter values in code, you can simply click the OK button and the parameter field will be added to the Parameter Fields node. If you want Crystal to handle the dialog for filtering, you can click the Set Default Values button, which brings up the Set Default Values dialog. From this screen, you can define the filters that you want to occur. In Figure 18.15, I created a filter that will prompt the user with a sorted list of the CompanyName fields to choose from. After the user selects a value, Crystal filters the report accordingly. This is a very powerful tool for doing all kinds of filtering for a report.
Figure 18.15. Setting the default values for a parameter field.

Using the Group Name Fields Node
When you run the Expert for each report, you're given the option of setting groupings on a report. At the initial stage of creation, you might not know exactly how the report will look or what other groupings you might need. By adding a new group from the Group Name Fields dialog, you can further group the data in your report and specify how it should look when grouped. By right-clicking the node and selecting Insert Group, you bring up the Insert Group dialog in Figure 18.16.
Figure 18.16. Inserting a new group into a report.
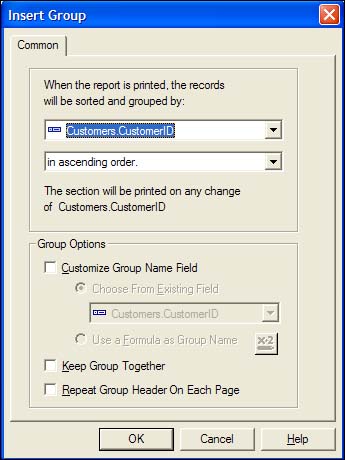
The nice thing about this dialog is that you can customize the group by using a formula. For example, if you want to create a new group if the OrderPrice of a record is greater than $100.00, you can specify that in a formula, and that group will be created in the report only if the data matches that criteria.
Using the Running Total Fields Node
When dealing with numeric values, a running total is always a nice feature. Using the Running Totals dialog, you can create a number of fancy running total fields that you can add to your report. When you right-click on the Running Total Fields node and select New, you're prompted with the Create Running Total Field dialog shown in Figure 18.17.
Figure 18.17. Creating a running totals field.
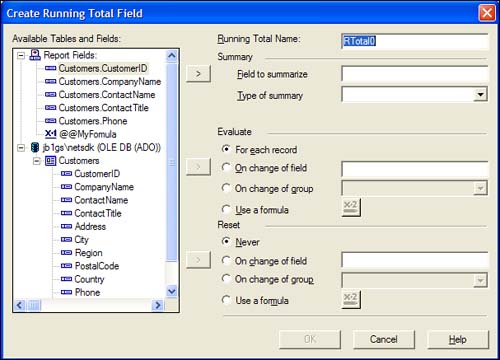
Depending on your requirements, you can specify running totals based on each record, a specific value of a record, or when a group changes. You can also reset the running total. Using a combination of a running total field and a group name field, you could drill very deep into data for a report, giving as much grouping and total information as is required.
Using the SQL Expression Fields Node
Adding a SQL expression is similar to using the Formula Editor, but with fewer options. The SQL Expression Editor gives you only SQL-specific syntax options for manipulating data for a field. You can do simple arithmetic or string concatenation of field data, or you can cast and format data in a field. Most of the time you're much better off adding a formula field instead of a SQL expression.
Using the Special Fields Node
The Special Fields node gives you fields that make the report seem like you went the extra mile to make it look good. From this node, you can drag any of the fields in the following list to your report to enhance the output:
| Print Date | Page Number | Group Selection Formula |
| Print Time | Group Number | File Path and Name |
| Modification Date | Total Page Count | File Author |
| Modification Time | Report Title | File Creation Date |
| Data Date | Report Comments | Page N of M |
| Data Time | Report Selection Formula | Record Number |
Using the Unbound Fields Node
Adding an unbound field to your report enables you to programmatically pass fields from your application to the report. When you drag an unbound field to a report, you can specify the data type of the unbound field. You also can use any of the formatting options that you normally have for any other field you add to a report.