
Chapter 8. The Data Aspect
We don’t eat lollipops, do we mommy? They’re not true.
Alison Brown, Fear, Truth, Writing
The API and the data model represent the most obvious ways in which your concept is practically realized in the software.
In this chapter, we examine some of the tenets for us as semantic designers to keep in mind when creating data services. Following these ideas, we can create very resilient, scalable, available, manageable, portable, and extensible systems.
We don’t skip the crucial step that is the one real difference between successful software and failures: first we decide what ideas will populate our world and what they mean.
Business Glossary
This is the single most effective thing you can do to help your software and your business.
Identify key terms within your business. Make a spreadsheet. Put it on the wiki. What is “Inventory” as opposed to “Availability”?
Be very clear on the distinctions. Leave no ambiguity. Make them mutually exclusive. Don’t allow fudging.
Sometimes this is called a “Data Dictionary.” That’s fine, too. Either way. For us, this is not a difference that makes a difference. Call the document what you like, but be ruthlessly exacting with respect to defining its constituent elements.
After you define them, use them consistently with their definition when it’s time to make a data model or API.
Strategies for Semantic Data Modeling
Throughout this book, we have been sometimes practical and sometimes abstract. That is on purpose because I want to spur your imagination and thinking. It is also because the semantic design method, by definition, is not a prescriptive method. It is holistic. It is a mindset, a shift in mental models, supported by accompanying processes, practices, and templates. Examples are sometimes useful.
Here are some tenets, or oblique strategies, questions to ask yourself to make sure that your data model is rich, robust, and correct. The book has given us the context, the description of the semantic mindset. Refer back to Chapter 3 on sets.
Here are the kinds of things that, having that semantic mindset, we ask when making our data model.
You are representing the world. Your job is to make a clear depiction of the actual facts about the actual world. That mostly means thinking about fine distinctions and understanding relations and attributes.
Your first job is to ask: what is true? What is the actual case about each thing, their constituent things, and how they relate?
Then ask, what is important about all of those things? What is significant, which (literally) means what here is capable of making signs, of participating in the language?
Then ask, to whom? This gains you a vector of perspective.
The main lesson that all of these roll up to is this one: be clear on where you are drawing the boundary in your semantic field.
Here’s an example. Your restaurant might serve different kinds of wine and beer and soft drinks. The wine and beer are regulated differently, and sold both individually (by the bottle) and by a pour (from kegs or in glasses of wine). So tracking is easy in one case and difficult in the other. You might care very much from an inventory perspective about tracking the specific bottles of each kind of wine sold and print them on the check so that the customer knows that the 2012 Cakebread Napa Cab was $25 per glass and the Merlot was $18. But you aren’t interested in tracking whether you sold a Coke or a Diet Coke, because it’s self-serve and you order it by the syrup box, not the bottle: you have less of a match between how you order it and how you sell it. Your customers get free refills. So you think you can call that a “Fountain Drink” and roll up all of the brands of soda together under that name.
That moment right there, where you posit the name “Fountain Drink” into your world so you can dim the horizon and get on with life instead of tracking each individually has lost details that still exist in the actual world. Your representation in this moment degrades to being a little bit less true. This idea is not that important to the customers and is not that important to the inventory keeper. But computers understand only True or False. Thus, you have made a fuzziness on purpose so that you can ship software. “Coke” versus “Diet Coke” are now beyond the boundary: they no longer have identities and are outside the inventory field. The real world in its infinite conjuncts carries on merrily with Coke and Diet Coke, however. I can’t tell you whether it’s right or wrong to say Fountain Drink here. I’m just saying to be clear and purposive, that this is where you created the semantic boundary. Because this is the place where the representation stops matching the real world and our semantics become incorrectly dimmed or inconsistent, and therefore this is where software starts to go wrong. We must do it. We need to ship. Just be aware, is all we’re saying; live on this line.
With that context, here are some questions and simple guidelines:
-
Next turn to your business glossary. That will be an easy anchor. You want to be consistent with it. “Availability” in your glossary should reflect what it means in your data model or there is a different word.
-
If you’re struggling to understand a word, break it into two words. Does that work better?
-
What is the perspective of this database table? That is, who is the use-case driver? Who makes data enter this table and why? Perhaps you’re looking at an Order table and a Vendor table, and you have them both pointing to a set of OrderReferences.
-
Can you delete this table or column completely from the semantic field, the vocabulary? What do you lose if you do that? Do you gain anything?
-
Try to make everything NOT NULL. Any column in the data model that wants to be NULL might be in the wrong table. Anything that wants to be allowed to have null values must claw and fight its way to earn that status for a very clear reason. If you have a column in your order table for “PointsPaid,” because you reason that customers can pay with cash or with points, but they’re different, so you need a column for each, and the one they didn’t pay with will always be null, this is lazy. Allowing null columns should be very rare. Consider any column with a null constraint a red flag. Can you decompose further?
-
Be suspicious of anything called “Type.” “Type” doesn’t mean anything. It’s a programmer overlay. Modelers who say “type” a lot also use enums a lot. Wrongly. If a valid value in your “WhateverType” column is “Other,” you don’t have a type. Break it out into a referenced list. There is no such thing as “other.”
-
Avoid false sectioning. A false section is much related to the Type problem. This is an antipattern when you take something that’s on a spectrum and break it into multiple categories: “Child, Adult.” These are two sections of the idea of “age.” But you could have Toddler, Senior Citizen. What is a “child,” anyway? Is that a person age five to twelve? Three to seventeen? What if one vendor defines it the first way and another vendor the second way? Did you provide for them to do that in your data model, or presume one universal idea of these sections that are false overlays? Childhood didn’t even exist until it was invented 250 years ago. What about Infant? What about Minor? “Minor” doesn’t mean the same thing across different states in the US, or across the world. When you section a spectrum, it’s always an overlay. Overlays are almost always false. That’s where your semantics will fail, and consequently that’s where the maintenance programmers will need to build a lot of time-consuming, expensive workarounds that will chip away at the integrity of your model. It’s where entropy alights.
-
Consider who will input this data? Why? Who will use this data after it’s there? Why do they care and when do they no longer care? Can you state that as a universal truth across all time, space, and dimensions? Be culturally sensitive to make it right the first time. That usually means making your previously binary distinction into a list and separating it into a referenced table. It’s free and takes 30 seconds to do now, and it takes a million dollars and six months to do in three years.
-
Always test, interrogate, and challenge common words. If you have a column for CurrencyType what precisely does that include: Bitcoin? Is Bitcoin flat with USD and Yen in your semantic space? What if loyalty members can pay with points? Are the valid values of that column “Bitcoin, USD, Yen (and so forth), and Points”? What if you have multiple customers each with their own loyalty program? Decompose and refine away any assumptions.
-
“Customer” and “User” or “Guest” are not the same. If I buy two ice cream cones, and give one to Alison, the vendor sees one customer with one order with one name on the credit card, and two ordered items. There are two guests. Don’t conflate things unless you’re doing it on purpose because you know that’s your boundary. Because at a restaurant you might have one order (the “check”), and the table might want to split the bill either 50/50 or by which customer ordered what items: one table, two customers, two checks.
-
Narrow to the lowest possible scope you can for a single data item until it feels like you’re considering the most obviously useless detail. Then, start to edge back up in your scope until you get to where it feels still tight but also useful. This helps to ensure significance. Do the same again, but on the trajectory of who it’s important to, who the use-case driver is.
-
Don’t make vague distinctions. “ShortDescription” and “LongDescription” don’t exist in the world. Assign a stronger type based on the context in which they’re used to better match the real world. The real world doesn’t have short and long descriptions.
-
Be careful when you write “PrimaryChannel” and “SecondaryChannel.” What’s the difference? From whose perspective? This is a hierarchy and it’s a common software guy overlay. There is no such thing in the real world as primary and secondary channels. They are channels. What about the “TertiaryChannel”? This is a cousin of the “ShortDescription” and “LongDescription” problem.
-
There are only three numbers in the universe: zero, one, and many.
-
Does “Price” really belong on the Product table? It seems like with only the input of the Product table we don’t have enough information: we need Vendor, too, because the same hose at Alice’s Hardware might cost $30, whereas at Bob’s Hardware, it’s $25. That’s because even though colloquially we speak that way, it is a false representation of the world that a Product has a Price. An InventoryItem has a price—that’s the moment in time the product meets the vendor. So it’s truer and therefore less error prone. Also, a Product doesn’t typically have one price, but the “rack rate” or “base price” and then a military price, or educator discounts apply, and so on. The point is that things are almost always more complicated. Examine the complexity so that you can make the truest statement that makes sense for what you’re doing. Usually things come in lists.
-
You make a split brain when you make something referenced at two levels. Consider who is the use-case driver and how they enter the data model and then make the reference only at the lowest level from that actor if you can. Sometimes, there are multiple valid perspectives on the same table, and you need to accommodate them. Then that’s not making a split brain, and it’s fine.
Polyglot Persistence
Consider the relational database, invented more or less by Dr. E.F. Codd in 1970. In a relational database, you define entities as the nouns represented in your tables: Customer, Product, ProductGroup, and so forth. It seems to me that “relational” has always been a bit of a misnomer given that the relations are not even defined as first-class citizens in the model and are only apparent in the join routes in the SQL code. Even the so-called “join table” that provides a many-to-many definition (such as StudentsToClasses) is not defined any differently in the model than any other table. Which is to say that the relations are often thought of secondarily, and as a result, we can have a pristine data model with perfect entities and queries that require 10 or 15 joins or considerable processing logic to get the work done. Such queries can be quite slow.
The relational model has become the de facto standard in our industry, and many teams jump directly to thinking in a relational model without first considering whether it is the optimal model for their design. In the past decade, however, the NoSQL movement has seen dozens of very different kinds of persistence models, each with their own set of advantages and use cases for which they are well suited.
My hope here is that you survey the landscape of available persistent stores, look at what they’re good at, and thoughtfully pick the ones that make the most sense for your use cases.
Notice that I did not say to pick the one, or the one most appropriate for your application. Instead, we recognize that the data is really the rocket fuel of any modern application. Data is the backbone of machine learning and artificial intelligence (AI). Data is the point of any application.
Applications, for all the drama surrounding them, are really simply window dressing on the data. We don’t use a single language for our applications and services: we regularly and unquestioningly use HTML, CSS, JavaScript, Java, Python, JSON, and myriad frameworks supporting all of those in our application code. No one hardcodes HTML into a Java servlet for their display, or, worse, uses a Java applet for the display layer because that’s the One Language you’ve chosen for your application. It’s absurd. Yet we often still maintain an idea that there is the One True Data Store to Rule Them All. Why the application should enjoy all these tools that are very well suited to the specific job they perform, and the data, which represents the real purpose of any application, should be crammed into one store suitable to do one job well is beyond me.
We have columnar databases such as Vertica, time-series and row-oriented databases such as Cassandra, document stores such as MongoDB and Couchbase, key/value stores such as Dynamo, object databases such as Postgres, graph databases such as Neo4J, hybrid “NewSQL” databases such as Google Spanner, and more. They’re all good at different things, and selecting the ones that make the right sense for your use cases will help your system scale in the best and most cost-effective manner.
You might have an Oracle database for your set of tables hosting your services. But then you need a place to store the denormalized BLOBs representing your orders each time they are confirmed or updated, or need an Audit table so you know when things were changed. Those can be separate, in something that is optimized for writes and rarely read. Cassandra is perfect for that. Use the best tool for the job that you can afford and that your team knows or that you can hire for.
Persistence Scorecard
As you consider the appropriate persistence implementations, you might create a scorecard or grid of your own that illustrates the advantages and disadvantages of different implementations. Table 8-1 presents one to get you started down the path of thinking about having a scorecard like this.
| Tool | Hosting | Storage type | Replication | Modeling | Transaction support | Scaling model | Master/ slave |
|---|---|---|---|---|---|---|---|
| Mongo Atlas | Cloud-only | Document | Good | Easy | Document level | Horiz. | Yes |
| Cassandra | Cloud/on-prem. | Wide row | Best | Worst | Row level | Horiz. | Peer to peer |
| Neo4J | Self-managed | Graph | Good | Best | Good | Horiz. | Yes |
Of course you can be more scientific in your approach, run tests in a lab and do a real bake-off, score things more numerically, and use more criteria. The idea here is just for you to consider polyglot persistence, and to have some way to judge in a rubric which are right for your different services, depending on your actual needs.
With polyglot persistence, you will gain improved scalability, performance, and suitability, and be encouraged to follow the “database per service” dictum. You will also encounter additional challenges with manageability (dealing with multiple vendors) and maintainability (having development teams need to learn more than one system and model). Architecture is always about trade-offs, so just be sure that you’re picking what’s right for your business.
Multimodeling
Extend the idea of polyglot persistence into the realm of your modeling. Here, we’re not referring so much to the daily work of doing modeling in a tool such as Embarcadero or something similar. If you get hung up on your tool, however, and assume that the tool you have for modeling is your allowed universe of possibilities for modeling, that’s a category mistake that will cost you. For this reason, I generally avoid data modeling tools and instead use, on purpose, the wrong tool for the job. I use a whiteboard, paper and pencil, spreadsheets, plain text files, and drawing programs. I like these tools for data modeling because they force me to never mistake the tool for the concept I am trying to express.
As a data modeler, you are creating the concept of the data and their relations, not filling in forms in a predefined tool that might restrict and severely modify how freely and imaginatively you think about your data.
You do not want to consider your data as a static light, which having one database, especially a relational one, strongly urges us to do. We want to design for evolution, for change, for fluidity as best we can. To do so, we want to consider what the data will become and how it will evolve and be augmented and changed over time. Consider the time vector of your data. I don’t mean timestamps of when that row was written. I mean the stages of life through which it will evolve.
Your application might feature 20 services, and each service has its own database, and perhaps there are three different databases you use for the different primary benefits a group of services would realize: a wide row, a graph, and a document store. You will need a different data model per service, and the models will need to be created very differently in accordance with each of those database types.
Because we cherish first the concept of our data, consider it as a whole, including the typically marginalized aspects of it, and are not led around by a tool, we have the following models to make:
-
A distinct data model per database implementation, per service to run the application.
-
A model for each service’s data according to a temporal trajectory within the runtime: how it will enter the world of the software, how and when it will be cleaned, stored, moved to long-term storage and purged. What is the source of batch data, and what are the sources and destinations and uses of it?
-
A security data model per service: where are the Personally Identifiable Information (PII), Payment Card Industry (PCI), and Service Organization Control 2 (SOC 2)–controlled systems? How will the data be encrypted? How will it be surfaced in APIs, for reporting, auditing, compliance checks, or machine learning consumption?
-
A model for logs-as-data. Developers must be mentored to not think of logs as the disposable runoff or leftovers from an application that they are grudgingly asked to provide. Instead, consider the life cycle of logs. How do they tell a story if read in trace or debug or info mode? How will they be rotated, shipped, aggregated, stored, and removed? What regulatory restrictions surround values in them?
-
A model for each service’s data according to temporal trajectory as a roadmap. We make roadmaps for our products all the time, stating that we’ll release this set of features on this rough timeline. We can make roadmaps for our data as well, stating what data we can add at what stages of the service evolution and what new sources we can get for it.
-
A model per machine learning use case, per service, to map the machine learning use case to the data you will need to support your feature engineering.
-
A model for the cache. We often don’t model the cache itself because we think it is a mere reflection in memory of what we’ve already modeled. In a wonderful deconstructive move, the old application Coherence (created by the very smart Cameron Purdy and eventually sold to Oracle) inverted the database, moving the “primary” store into memory, with the persistent on-disk layer as the secondary. This can also include how will you create indexes, materialized views, and denormalization strategies.
-
A model for events. What events are published, what Claim Checks are needed by what services to fulfill event subscriber needs, and where will they retrieve that data? Complex Event Processing systems invert the database, too: they essentially store the queries and let the data flow on top of it, and when a match is noticed between the criteria in the query and the data, a function is executed.
-
A model for streams. We will examine this separately below because it might be newer to you.
The modeling job can’t stop with dutifully enumerating the nouns in your application, making join tables between ones that seem to matter to each other, and policing developers on column name conventions.
Data Models for Streams
Data streams allow you to perform real-time analysis on a continuously flowing series of events, without having to store the data first. The data may flow from a variety of sources.
There are several common use cases for streaming data, including the following:
- Finance
-
Stock tickers provide a continuous stream of changing financial data. Trackers can update and rebalance portfolios in real time and make robotic trades.
- Media streaming services and video games
-
Here the content of music or movies or audio books comprise the data stream. Metadata regarding usage of the content, such as when it is paused, rewound, the resolution viewed, the receiving devices, and so forth can be examined to improve your services.
- Web ecommerce clickstreams
-
On an ecommerce website, applications can capture each click, and even each mouse hover, as an event and stream them for processing in order to understand user behavior.
- Social media
-
You can capture tweets and other posts from social media outlets in real time and filter on hashtags or use natural language processing (NLP) in order to gain real-time understanding of customer sentiment or current news updates and take action.
- Power grids
-
The grid can stream usage by location to improve planning and generate alerts if a threshold is exceeded.
- Internet of Things (IoT)
-
In the hotel domain, for example, a property might capture stream data from a variety of on-premises sources, including thermostats, mobile key usage, minibars, and other guest activities and make management adjustments.
This is data; it’s often not stored at all or is likely not stored in the same way as typical data in applications. It requires a different kind of thinking from the traditional model, which is all about understood entities and on-disk persistent storage.
There are several wonderful tools available to get you started with stream processing.
- Apache Kafka
-
Kafka, created originally at LinkedIn, is a distributed publish/subscribe messaging system that integrates applications and data streams.
- Apache Storm
-
Storm is a distributed, real-time computation framework written in Clojure. Its model is a directed acyclic graph (DAG) in which the edges of the graph are the stream data, which is moved from one node to another for processing. In Storm, the data sources are proxied by spouts and the nodes that perform the processing are called bolts. Taken together, the graph acts as a data transformation pipeline. Storm excels at distributed machine learning and real-time analytics.
- Apache Spark Streaming
-
Spark Streaming reuses Spark’s Resilient Distributed Dataset (RDD) component to perform real-time analytics over small batches of data. Because of this mini-batching, the Spark Streaming library can be susceptible to latency bursts. Spark Streaming has built-in support to consume data from Kafka, Twitter, TCP/IP, Kinesis, and other sources.
- Apache Flink
-
Written in Java and Scala, Flink is a high-throughput, low-latency streaming data-flow engine with support for parallel processing, bulk/batch processing such as Extract, Transform, and Load (ETL), and real-time event processing. Flink supports exactly-once semantics and fault tolerance. It does not provide its own storage system, but instead features data sources and sinks for Cassandra, Hadoop Distributed File System (HDFS), Kinesis, Kafka, and others.
All of these systems have a basic variation on a theme: they are data pipelines that accept unbounded streams of data and have a particular way of representing that data to nodes that provide an opportunity to do some processing, filtering, enrichment, and transformation. They must start with a source where the data comes from and end with a sink, where the transformed or processed data ends up.
In your streaming model, consider the following:
-
The data source and destination (sink).
-
The interval by which the data is updated or at which you want a snapshot.
-
Your near-term and long-term storage needs and restrictions.
-
Your durability requirements.
-
Your scalability requirements: what is the math on the data volume and the processing time/response immediacy requirements? Consider processing in parallel and batches for their server footprint, cost, and management implications. Does your chosen library support scale-out?
-
Your fault tolerance in the storage layer as well as in your processing layer.
-
Many of these have a SQL-like language that allows the developer to express matches. Consider your guidelines for developers regarding its usage.
These tools are rather young, and so are rapidly changing. They are also complex to use well and keep manageable. But don’t assume that streaming data is at all what you’re used to from thinking of data as a passive element at rest in a persistent store that gets operated on by application code. By designing your stream architecture in its own light, given its own special and separate concerns, you can do amazing things.
Feature Engineering for Machine Learning
Machine learning is becoming a more typical aspect of any modern application. Understanding how you as a data designer can assist the data scientists and machine learning engineers with a basic skill in feature engineering is important. It will prompt you to see machine learning more as a capability to be used throughout your application as opposed an exotic separate project that you tack on to the existing application design.
When you get data to be used in machine learning, you’ll need to clean it. You’ll need to fix structural errors, impute values to missing data elements, and otherwise prepare it for processing. In data science and machine learning endeavors, feature engineering is probably where most time is spent. This is where your domain expertise and understanding of how customers use your data as a data architect can be of terrific service.
In machine learning, a feature is a numeric representation of real-world data. The purpose of feature engineering is to develop the data you have to the point where it’s most useful to your machine learning model, given the use case. It’s a matter of determining what is most relevant and differentiating to the model for it to make accurate predictions. You take the raw data, clean it up, engineer the features, create the model, and gain the insights and predictions it outputs.
In this way, feature engineering is a creative process. You are imaginatively figuring out what features are needed in your machine learning model and developing them from existing values that you have in your raw data. In this sense, it is much more like application developing. You must approach feature engineering with equal measures of imagination, creativity, and analysis. Here, you as a data architect/data designer/feature engineer are inventing something rather than figuring out where to put something.
One of the primary theses of this book is that you are a designer of concepts, that architecture is about the generation and illumination of the concept of the system, and that the best approach for making better software is the mindset shift afforded by a deconstructive analysis. That is certainly the case for feature engineering.
Done well, feature engineering goes far beyond the typical concerns of the data architect who is tuning queries for performance given intimate knowledge of a particular database platform. With feature engineering, yes, it’s a matter of analysis, but, done well, you quickly can get into the varied realms of marketing, semantics, philosophy, politics, ethics, and bias.
The basic overview of the steps in feature engineering are as follows:
-
From the scrubbed raw data, determine which terms matter the most. Isolate these and highlight them with an aim toward focusing the machine learning algorithms on these.
-
Use your domain expertise to combine the data into more usable inputs. These are called interaction features because they combine multiple data points into a new one. At this stage, you’re examining the data to see whether two features can be combined to discover one that might be more useful. For example, in a real estate model you might assume that the number of schools is important to predicting housing market prices in an area. But combining this point with the quality rating of each school to create a new idea of school richness (number and quality) is smart feature engineering. You’re making the distinction, a value judgment, a determination in the world of the concept that quantity of schools doesn’t matter to the question at hand if they aren’t very good. These interactions will result in mathematical products, sums, or differences.
-
Use your domain expertise to combine values that are sparse. That is, if you don’t have enough data points across a variety of categories in your dataset, determine how the sparse values can possibly be combined into one category that abstracts them up so that you have enough data points you can count as the same for the purposes of your model.
-
Remove unused values such as IDs or other columns that add to the size and noise of your dataset.
-
Use your business knowledge to frame all of this feature engineering work by always relating it back to the underlying, fundamental question of what specific task this particular machine learning model is intended to execute. What question does it exist to answer? All feature engineering must clearly map back to the question of the model. Are you hoping to predict stock prices to determine where to invest? Or predict which product offers will delight your customers the most? Traffic and purchasing patterns due to external related events?
Feature Engineering for Machine Learning
For an in-depth and hands-on examination of this field (with plenty of code), see the excellent book Feature Engineering for Machine Learning by Amanda Casari and Alice Zheng (O’Reilly).
The field of feature engineering merits entire books on its own, and requires a strong understanding of the mathematics required to feed machine learning models. Our aim here is to provide our particular perspective on it as something to add to your toolbox with a caution to start with the concept and the language and then do the math later. Do not let feature engineering be mathematics-driven. The math is just a mechanism for representing one format concept, no different than JSON as an exchange format.
Classpath Deployment and Network Proxies
Data accessor services should provide a network-reachable API endpoint that your engines can connect to. In this way, they present as services like any other, exchanging data via JSON or ProtoBuf.
But they should also present a native API such that you can compile the data accessor services into a binary artifact and either add them to the classpath of the engines that use them or directly bundle them into the engines’ deployment artifacts. Providing the option makes a little extra work, but will likely prove necessary if you need the flexibility of network access as well as the faster performance you get from avoiding a network hop and translation.
You can implement this using a Facade pattern. Your default option is to simply provide the native interface for direct access as a library via the classpath. Then, provide a facade interface that wraps the data accessor service with a service endpoint to exchange JSON or ProtoBuf, or what have you.
The Proxy pattern provides a simple way to change the behavior of an object without changing the original object. To do this, implement the original data accessor and deploy it with an alternative proxy that exposes the same functions but adds the necessary translations for the HTTP endpoint to receive requests and post responses via JSON messages.
Peer-to-Peer Persistent Stores
The master/slave paradigm for scaling databases is popular because it has obvious benefits: you can usually see good performance and response times while also replicating data to prevent significant downtime. You can perform reporting and analytics off of the slave databases.
Beyond the unfortunate name, master/slave databases suffer from the obvious problem of the single point of failure. This is common when you have such a clear and obvious binary opposition with a privileged term. In deconstruction design, we question underlying structures to see how we can overturn and subvert power relations like this to arrive at what will hopefully be an improved design.
The obvious solution is a peer-to-peer database, such as Apache Cassandra. In Cassandra, every node is identical to every other in its function within the topology. There are no privileged nodes. Because the data is distributed and replicated across multiple nodes, it is incredibly fault tolerant. It is also tuneably consistent, so that depending on how you define your quorum, you can set the consistency level to be strong or weak, depending on your use case needs.
Follow-Up with Cassandra the Definitive Guide
To read more on Cassandra and get into the details of how to set it up, model it, and operate it, see the book Cassandra: The Definitive Guide (O’Reilly), which I wrote (the second edition was by me and Jeff Carpenter).
Because we want to use the appropriate database given the use case the service supports, use the following checklist to determine whether Cassandra might be suitable for your service. Instead of choosing a database because it’s what you already have or it seems like the exciting new technology, ask yourself if you have these needs:
-
High availability.
-
Linear horizontal scaling.
-
Global distribution (you can define clusters regionally).
-
Ultra-fast writes are much more important to your use case than reads.
-
You can do most or all of your reading only by primary key.
-
You have little need for any joins: data tables match the queries very closely.
-
Time-series and log journaling.
-
Data with a defined lifetime; after a time-to-live (TTL) threshold is reached, the data is automatically deleted, which is a great feature as long as you’re clear on its behavior.
Because of these features, Cassandra is a great choice for workloads such as these:
-
IoT updates and event logging
-
Transaction logging
-
Status tracking such as package location, delivery status
-
Health status tracking
-
Stock update tracking
-
Time-series data
Keep in mind that Cassandra is probably the wrong choice if you have the following needs in the service you expect it to support:
-
Tables will have multiple access paths, causing you to employ considerable secondary indexes. This will slow your performance.
-
ACID support. Atomic, Consistent, Isolated, Durable transactions have been, from the beginning, a nongoal for Cassandra.
-
Locks. These are not supported in Cassandra.
-
Intense reading. Cassandra is far more performant on writes than on reads. If your data can likely have a very strong cache read hit ratio, you probably will be better off with another implementation.
When we find a technology exciting, it is tempting to tell ourselves a story about how we can use it for use cases that don’t quite seem to fit and to make up for shortcomings ourselves. We might suppose that we will write our own locks and transactions on top of Cassandra, for instance. This rarely works out. Pick the appropriate tool for the business use case.
When you have a write-intensive application, and need massive horizontal scaling, global distribution, and unbeatable fault tolerance, Cassandra is an excellent choice. Using a database with a flat peer-to-peer design as opposed to a hierarchical master/slave design is in keeping with our overall deconstructive design paradigm.
Graph Databases
A graph database has three major conceptual components: nodes, edges, and properties. Nodes are the entities in the model (such as user or product), and edges represent the named relations between the nodes. The relations can be one way or bidirectional, and multiple relations can be defined between nodes. Properties are attributes that can be assigned to both the nodes and the relations. Nodes are typically called vertices and the relations are typically called edges.
The underlying storage model holds these all as first-order components in the implementation. Queries in a graph database can be very fast, because the relations are stored as first-order objects along with the nodes. This means that data in the store is linked together directly according to the relations and can therefore often be retrieved with a single operation.
Graph databases also allow you to readily visualize the data model because it closely and intuitively mirrors the actual world in its representation. They support and even promote the idea of modeling heavily interrelated data. Moreover, they are perfectly suited for semantic querying.
For all these reasons, graph databases are an outstanding example of the deconstructive design paradigm.
A key concept of the system is the graph (or edge or relationship), which directly relates data items in the store to a collection of nodes of data and edges representing the relationships between the nodes.
Popular graph databases include OrientDB and Neo4J, which we take a look at shortly.
When would you want to consider using a graph database? If you have any of the following use cases, it is worth checking out:
-
Social media graphs (understanding relationships between users and making recommendations)
-
Ecommerce (understanding relationships between disparate products and other datasets, and making richer recommendations)
-
Fraud and security detection by identifying patterns in real time
-
Personalized news stories
-
Data governance and master data management
Check the Licensing
Be sure to check the licensing on your graph database selection. For example, Neo4J is a popular choice, but has a General Public License (GPL) license and is “freemium registerware.” OrientDB, on the other hand, has a more friendly Apache license. Both have commercial support from parent companies.
Graph databases are a terrific choice as the underlying support for your service if its job is to answer questions or perform operations such as these:
-
What is the list in ranked order of products recommended for purchase with this product?
-
Who are all the managers between this employee and the CEO?
-
What are the names of the musicals that won a Tony award and are produced by this person and are composed by that person?
-
Who are friends of my friends?
-
What is the distribution of companies that people who work on this project have also worked in?
-
What are the most popular recommended activities for people staying this hotel?
From a certain point of view, the entire universe can be viewed as a (very long) list of things that each have a list of relations to other things, and both the things and relations have a list of properties. If you view the universe this way, you can see that a graph database is capable of most closely representing the world and creating the least impedance mismatch in so doing. It is therefore well suited to many data modeling tasks of any even modest level of complexity and richness.
OrientDB and Gremlin
OrientDB is perhaps the database with the greatest intellectual kinship to deconstructive design. As a multimodel database, it’s incredibly open in terms of allowing you to pick the storage model that best supports a variety of workloads. It supports not only graphs, but also key/value pairs, objects, and document storage.
In addition to the multimodel, OrientDB offers the following features:
-
Horizontal scaling
-
Fault tolerance
-
Clustering
-
Sharding
-
Full ACID transaction support
-
Relational database management system (RDBMS) import
-
Works with SQL as opposed to a proprietary language
And it’s free and open source. It also comes with a standard Java Database Connectivity (JDBC) driver and other options for integrations.
OrientDB also supports Apache TinkerPop Gremlin, which is a powerful and flexible graph traversal language. Gremlin is composed of three interacting components: the graph, the traversal, and a set of traversers.
From the Gremlin site:
Gremlin is a functional, data-flow language that enables users to succinctly express complex traversals on (or queries of) their application’s property graph. Every Gremlin traversal is composed of a sequence of (potentially nested) steps. A step performs an atomic operation on the data stream. Every step is either a map-step (transforming the objects in the stream), a filter-step (removing objects from the stream), or a sideEffect-step (computing statistics about the stream). The Gremlin step library extends on these 3 fundamental operations to provide users a rich collection of steps that they can compose in order to ask any conceivable question they may have of their data for Gremlin is Turing Complete.
Gremlin supports imperative and declarative querying, host language agnosticism, user-defined domain-specific languages, an extensible compiler/optimizer, single- and multimachine execution models, and hybrid depth- and breadth-first evaluation.
Check out the wonderful Tinkerpop Gremlin Getting Started Tutorial to see how it works.
Because of the power of Gremlin, picking a graph database with this support is a good idea.
Data Pipelines
Historically, developers would get an idea of the platform on which their work would eventually be deployed to, and they would make some close approximation of that in their local environments. They would work on the code and then on rare occasions at major milestones (or, commonly, only once) transfer their work to a production environment. This was considered perfectly reasonable because why would you deploy something to production that was not fully ready?
In recent years, the idea of the Continuous Integration/Continuous Delivery (CI/CD) pipeline has gained popularity. A CI/CD pipeline is a set of end-to-end automations that use tools to compile, run, test, and deploy code. Because it is automated, all of these steps can be executed by the single command.
Some of the advantages of a pipeline include:
-
Problems with the code are detected early and the team gets feedback on what happened so that it can quickly address it.
-
It prevents compounding errors in a code base, keeping your project more predictable. General quality is promoted.
-
Automation makes your program more testable and reduces single points of knowledge in your organization.
For a deconstruction designer, you want to design your pipeline early, up front, so that you are deploying a simple “Hello World” type application. In this sense, your application code base acts as a mock object for the testing of your pipeline.
You want to design the pipeline first because then you can increase predictability and efficiency in your project. Give your developers a single command to invoke, a single “button to push” to build, test, and deploy their software. If it is easy to invoke the deployment, they will do it a lot. The more they do it, the more you learn about your environment and application, and the more surety and stability you will have throughout your project.
Of course, your pipeline is software, too. As you execute it, you are making sure that your pipeline works properly and covers all the use cases you need to. If you have put the basic structure in place early in your project, you can add specialty items to it easily. These might include security scans with a tool such as Veracode, UI tests, regression tests, health checks following deployments, and more.
You might have a few pipelines:
-
One for creating and tearing down the infrastructure, using the Infrastructure as Code (IaC) pattern. This works if you are using a cloud provider with APIs that allows you to do this in a “software-defined datacenter” manner.
-
One for deploying the standard application and services code that you create as your product.
-
One for the database creation and updating automation. You can do this with a tool like FlywayDB, which is a scripting database migration tool with APIs. It’s open source with an Apache license and supports about 20 different databases.
-
One for the machine learning services and offline aspects of your application.
All of these will be jobs that you create to be executed in independent steps using an automation tool such as Jenkins.
Pipelines can be initiated automatically every time code is committed to the repository. A listener hook in Jenkins makes this easy be simply pointing to your repository. After the job is kicked off, the pipeline should create a new instance so that only one build is tested at a time. If the job fails, developers can be notified immediately.
Here is the outline of a flow for you to use in building your own pipeline for your application code:
-
Commit: this stage is kicked off on an approved pull request or code commit. It should execute unit tests. You might also want to include executing “A/B” tests at this stage. Here you are checking that the basic functionality works as advertised.
-
Integrate: For an application of any size, you won’t want to re-create the environment every time. Instead, use this stage to promote the changed or new code into the environment with the rest of the existing passed code. This is an integration environment. Here, you run a battery of regression tests to ensure that the new functionality doesn’t break existing functionality. Here, you should also run a battery of security tests and scanning (with a tool such as Veracode) and penetration tests, too. To do that, you’ll need to expose your build to the internet.
-
Production: If you are ready to release this new code to production, you will execute this phase of the pipeline. Here you run smoke tests to ensure that your build actually connects to all of the proper environments with the production settings. Smoke tests are essentially just quick verification tests. You can execute them by pinging a health check function on your services.
Health Check Function
Chris Richardson has a clear and practical writeup of how to implement the Health Check function on a service using Spring.
Note that not all software can or should be continually deployed. If you are making large-scale operational software for companies to run their businesses, that would not be desirable or responsible, so choose production schedules as is appropriate for your business. The aim with pipelines is that the technical teams are not the bottleneck, that you could theoretically release 10 times per day if the business wanted to; that doesn’t mean you must or should.
You should aim for creating a single artifact that you build once, and that then moves through all the production pipeline stages intact. If you rebuild software at each stage, or tamper with its settings or replace things, your tests are all essentially invalidated.
Machine Learning Data Pipelines
As deconstructive designers, we don’t make frozen pictures of software we advertise; we will build and assume that the system will actually work or look that way. The system is a representation of a concept. Neither do we make frozen software that is locked, fixed, and predetermined. Not because we are on a religious quest, but because it fits the world better and therefore is more successful software. We design deconstructed systems to be a more organic and generative system. We find ways to make a generative architecture, an active design where the system helps create itself. The obvious mechanism for this is machine learning.
To help the system you’re designing have the biggest impact, expect to design machine learning capabilities throughout the system. At least take the entire system into account so that you can prioritize how you apply machine learning from a holistic point of view. Although it is not likely appropriate, desirable, or cost effective to make every aspect of your product machine learning enabled, it is certainly important to inspect your system and its set of use cases, top to bottom, and consider how it might take advantage of machine learning at each of these.
For example, in a shopping system it might be obvious to see that you want to use machine learning as part of a product recommender. But not all of the great uses for machine learning will be customer facing. There are internal opportunities to proactively predict when you might have the next outage.
For any of these use cases, it will quickly become important to have a machine learning pipeline in place to allow automation to keep the data and resulting machine learning predictions fresh and tuned. A data collection workflow to help gather and prepare the data for your machine learning algorithms will be necessary and save you a lot of headaches trying to manage it later.
The data collection pipeline has the following responsibilities:
-
Decentralize data intake. Agent adapters can pull data in from their original sources.
-
Parallelize data intake for different data sources and data types to execute quickly. Each of the data intakes can stream with a throttle mechanism or can be awakened on timers or triggered by events.
-
Normalize and munge the data to prepare it for use in data science use cases including ingestion, data cleanup, imputing missing values, and so forth.
Designing data pipelines will make it easier for you to add new data sources later and make your machine learning richer and more robust. Figure 8-1 shows an example process and set of responsibilities for a machine learning data pipeline that you can use.
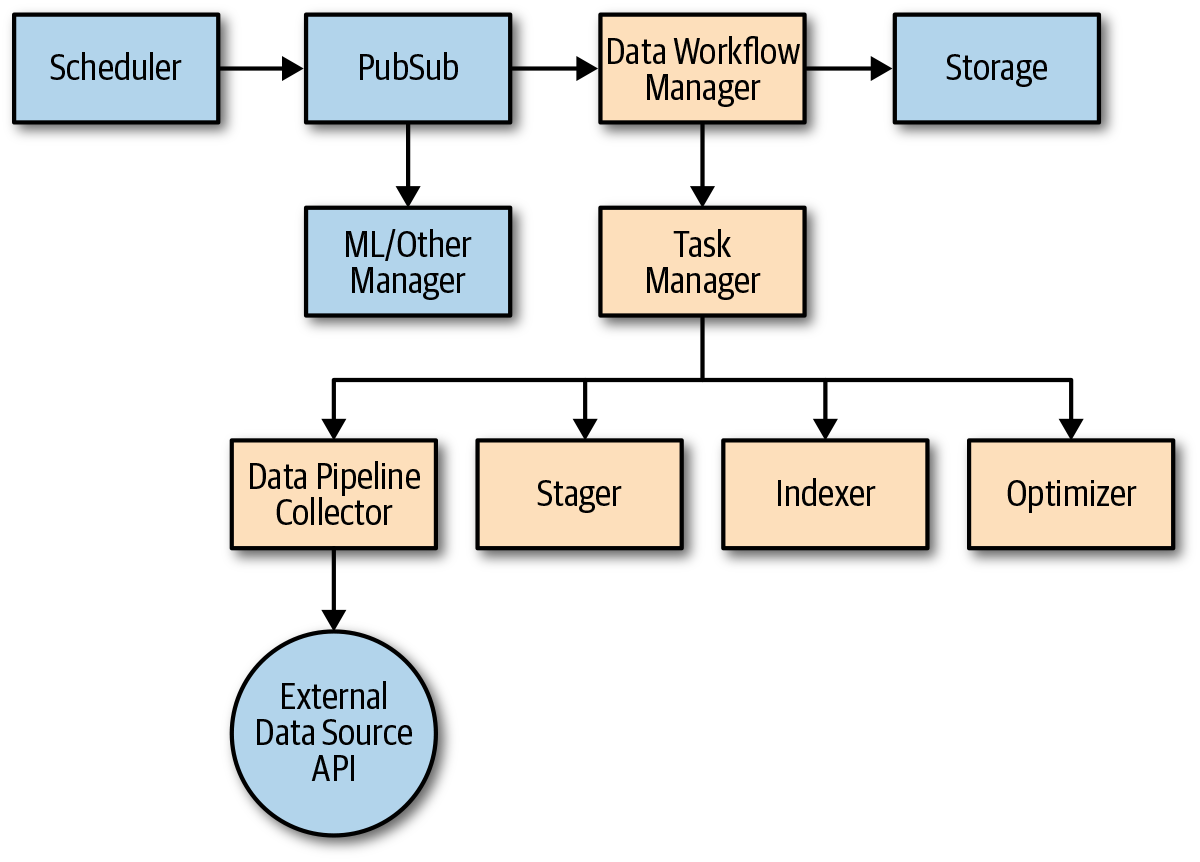
Figure 8-1. The online and offline machine learning data pipeline
Here is the basic flow for a data pipeline similar to how we use them as designed together with a great architect, Holt Hopkins:
-
At code time, create a separate project and package for your data pipeline. Create a set of interfaces that you deploy as an API separately from the implementation classes associated with any particular data pipeline. Say, for example, that in the travel domain you have flights and trains and you want to use schedule, change, or cancellation data as an object of machine learning in order to optimize your application in some way. You would make separate implementation artifacts (WAR or JAR in Java) that adhered to the data intake interfaces: one for the flights and one for the trains.
-
These interfaces include a Scheduler, a Workflow Manager, a Task Manager, and a Data Processor Engine.
-
-
At runtime, a Scheduler interface implementation determines when to initiate a job. This will typically be for one of three reasons: an event was published that the scheduler consumes, a certain hour of the clock was struck, or it’s continuously running or running at intervals capturing a stream of data (such as from the Twitter streaming API). If the scheduler is notified through a publisher/subscriber (pub/sub) mechanism that something has happened and it decides it should open a pipeline, the scheduler invokes the proper implementation of the Workflow Manager through its interface.
-
The Workflow Manager, like typical manager services as we have discussed, represents the orchestration layer and does no other actual work but to track the state machine of progress across the use case through to completion and to ensure that asynchronous notification messages are published so that Task Managers can do their work.
-
Each Task Manager receives the message appropriate for its task. There are tasks for Collecting, Staging, Indexing, and Context Optimizing. Each of them can represent a long-running process.
-
A Collector acts as a Data Processing Engine service, which is an implementation that knows how to connect to its data source (typically through a network API) and retrieve and save the raw data for local storage (say, in Amazon S3). Data should be stored in its raw form, as from the source. That way, if anything goes wrong in the processing, you can revert to this step without retrieving it again (which might not be possible in the case of streams).
-
The Stager puts data into a common format, cleans it up, normalizes it, and generally prepares it for consumption. The Stager performs conversions from tab-separated to comma-separated values (CSV), renames columns for file consistency, imputes missing values, and normalizes numeric values on appropriate scale. The Stager is specific to its API client. For example, a single Task Manager might be invoked to refresh the “social media” data and that could kick off two Collectors and two Stagers (one for Facebook and one for Twitter).
-
The Indexer has no awareness of the source of the data. It is aware of the use case in which the data will be used, and how. It knows how the data will be filtered and queried. Multiple Indexers can be at work for a given use case. For example, one could index according to date, another could index according to user, and another according to content category. The Indexers will break large files into small ones that are optimized for read retrieval, rewrite files with the proper order, update a database, and store metadata in case range queries are needed.
-
The Optimizer performs the last offline step. This is necessary only for intensive, high-traffic systems. It can precompile and add to caching in order to optimize shopping performance. In this way, it acts analogously to Facebook’s HipHop precompiler, or a Maven “effective POM.” It can denormalize data for speedy retrieval, prepare any anticipated runtime rules, and add it to a distributed cache if necessary.
-
-
At each step, the Task Manager should update the Workflow Manager from time to time regarding what percentage complete its job is or otherwise update on the status of the job. The Workflow Manager receives the job status update and records it in a database for exposure to tooling.
-
When the jobs are complete, the Manager service notifies a topic. The machine learning Manager can then understand that the data was updated and execute any processes it wants to, such as pulling the data into its store. The raw data can be deleted if desired to save space, cost, or comply with data privacy rules.
These steps are all performed “offline” and are not in the standard use case runtime path.
Now with your machine learning algorithm running as a service, the fresh circulation of properly prepared data acts like the fresh circulation of water through a fountain.
Metadata and Service Metrics
Define the metrics that your services will use. This must be treated as data because it must be defined, collected, massaged, and put into a usable form. The metrics must be engineered by you as a data architect/data designer. Table 8-2 shows examples of service metrics that you might consider employing in your own organization.
| Metric name | Description |
|---|---|
| Request Count (Total) | Total number of requests, per service operation, by millisecond, second, minute, etc. |
| Response Time (Average) | Average response time, per service operation, by millisecond, second, minute, etc. |
| Failure Rate Count (Total) | Total number of failed service requests, by millisecond, second, minute, etc. |
| Success Rate (%) | Percentage of successful service requests over the total number of service requests |
| Failure Rate (%) | Percentage of failed service requests over the total number of service requests |
| Service Availability (%) | Percentage of availability, per service operation, by hours, days, etc. |
| Fault Count (Total) | Number of times a technical fault has been registered, per service operation |
| Transaction Response Time (End-to-End) | Average end-to-end response time, per service operation, by millisecond, second, minute, etc. |
| MTTR (Mean Time to Recovery) | Average duration in minutes from a service incident to its complete recovery |
These are by no means the only metrics, just some that I’ve used effectively in the past. The point here is to give you a jump start toward tracking the behavior of your services so that you can understand how well they are working and how to improve them. This is a matter for you to design to ensure they are meaningful; do not merely leave this up to the operations team.
Auditing
You will need to add auditing to your system so that you can trace who changed what and when.
For auditing purposes, tables that supply configuration options, user access, PII data, and certainly PCI data should maintain columns such as the following items to support auditability:
-
When created
-
Who created
-
When last updated
-
Who last updated
For a robust security measure that can really help you out in the event of a breach or unauthorized use, also maintain columns for who and when last viewed. You can implement this as part of the eventing framework discussed earlier.
ADA Compliance
Your software user interface design in its various forms (including desktop, tablet, and mobile) must comply throughout with the Americans with Disabilities Act (ADA). Any consumer-facing web application must meet Web Content Accessibility Guidelines 2.0 (WCAG) to ensure that the application is perceivable, operable, understandable, and sufficiently robust for users with disabilities.
Companies that do not comply with this federal regulation are subject to fines of $25,000 per day for every instance of a violation, which becomes a million dollars in fines to your company for every three sprints it takes to correct.
Therefore, it’s an excellent idea to test your software on a regular, frequent basis (prior to every release) using the following tools:
-
JAWS (required) with the IE browser
-
NVDA and Zoom Text Only (required) with the Firefox browser
Your software could also be tested on a less frequent but still regular basis (quarterly) using the following tools:
-
IE-Edge with the IE browser
-
GoogleVox with the Google Chrome browser
-
Totally: an accessibility visualization toolkit
-
MAGic: a screen magnification tool
-
Voiceover and TalkBack for Apple and Android tablet and mobile devices
Keeping your software ADA compliant is not only a way to make better software, it’s the law. Your public-facing consumer software will be particularly susceptible to this, but although that’s where designers tend to focus their activity, your internal applications are subject to it as well.