6 Yle: Architecture highlights, lessons learned
Yle is the national broadcaster for Finland and operates their own popular streaming service called Yle Areena, which is used by millions of households. For a number of years now, Yle has used serverless technologies at scale in their architecture. They use a combination of AWS Fargate (https://aws.amazon.com/fargate), Lambda, and Kinesis to process more than 500 million user-interaction events per day. These events feed Yle’s machine learning (ML) algorithm and help them provide better content recommendations, image personalization, smart notifications, and more.1
6.1 Ingesting events at scale with Fargate
To provide better content recommendations, Yle needs to know which content the visitors interact with the most. Yle ingests user-interaction data from streaming services as well as mobile and TV apps via an HTTP API. The challenge with this API is that the traffic can be spiky, such as during live sporting events. And sometimes events overlap (for example, when the election results coverage was on at the same time as a hockey game, which is the most popular sport in Finland)!
As mentioned, Yle’s API ingests more than 500 million user-interaction events per day with more than 600,000 requests per minute during peak time. Live sporting events or special events (such as the election results) can cause peak traffic to go even higher. The maximum traffic throughput they have observed is 2,500,000 requests per minute.
Because the traffic is so spiky, the Yle team decided to use Fargate instead of AWS’s API Gateway and Lambda. Fargate, also an AWS service, lets you run containers without having to worry about underlying virtual machines. It’s part of an emerging trend for serverless containers, where you use containers as a utility service.
6.1.1 Cost considerations
In general, AWS services that charge you based on up time tend to be orders of magnitude cheaper when running at scale, compared with those that charge based on request count. With API Gateway and Lambda, you pay for individual API requests. Fargate, on the other hand, charges a per-hour amount based on the vCPU, memory, and storage resources that your containers use. You incur costs for as long as the containers run, even if they don’t serve any user traffic.
Paying for up time can be inefficient for APIs that don’t receive a lot of requests. For example, an API that receives a few thousand requests a day would cost significantly less using API Gateway and Lambda. This is especially true when you consider that you need some redundancy to ensure that your API stays up and running even if a container fails or if one of the AWS availability zones (AZs) hosting your containers experiences an outage. However, for high throughput APIs like the Yle API, which handles hundreds of millions of requests per day, running the API in Fargate can be more economical than using API Gateway and Lambda.
6.1.2 Performance considerations
A more important consideration for the Yle team was that, given how spikey their traffic can be, they would likely run into throttling limits with API Gateway and Lambda. A Lambda function’s concurrency is the number of instances of that function that serve requests at a given time. This is known as the number of concurrent executions.
Most AWS regions have a default limit of 1,000 concurrent executions across all your Lambda functions in that region. This is a soft limit, however, and can be raised by a support request. Even though Lambda does not impose a hard limit on the maximum number of concurrent executions, how quickly you reach the required number of concurrent executions is limited by two factors:
-
The initial burst limit, which ranges from 500 to 3,000 depending on the region.
-
After the initial burst limit, your functions’ concurrencies can increase by 500 instances per minute. This continues until there are enough instances to serve all requests or until a concurrency limit is reached.
API traffic is often measured in requests per second (or RPS). It’s worth noting that RPS is not equivalent to Lambda’s concurrent executions. For example, if an API request takes an average of 100 ms to process, then a single instance of a Lambda function can process up to 10 requests per second. If this API needs to handle 100 RPS at peak, then you will likely need around 10 Lambda concurrent executions at peak to handle this throughput.
If, however, an API’s throughput jumps from 100 RPS to 20,000 RPS in the span of 30 seconds, then you will likely exhaust the initial burst limit and the subsequent scaling limit of 500 instances per minute. Eventually Lambda would be able to scale enough instances of your API functions to handle this peak load, but in the meantime, many API requests would have been throttled.
Another caveat to consider is that because live events are scheduled ahead of time, the Yle team can use a broadcast schedule to prescale their infrastructure in advance. There is no easy way to do this with Lambda except for using provisioned concurrency (https://amzn.to/3faBkCU). But you’d need to allocate provisioned concurrency to every Lambda function that needs to be prescaled; that would consume the available concurrencies in the region.
When used broadly like this, it can significantly impact your ability to absorb further spikes in traffic because there might not be enough concurrency left in the region if most of it is taken up by provision concurrency. Because of these scaling limits, AWS API Gateway and Lambda are not a good fit for APIs with extremely spiky traffic. It’s the main reason why the Yle team opted to build their API with Fargate, and that was a sensible decision.
6.2 Processing events in real-time
Once Yle’s API ingested the user-interaction events, it published them to Amazon Kinesis Data Stream in batches of 500 records at a time with an Amazon Simple Queue Service (SQS) queue as the dead-letter queue (DLQ). Figure 6.1 illustrates this process.

Figure 6.1 High-level architecture of Yle’s ingestion API, which assimilates more than 500 million events per day at a peak throughput of more than 600,000 events per minute. The events are forwarded to Kinesis Data Stream in batches of 500 records. If the Kinesis data stream is unavailable, the events are sent to an SQS dead-letter queue (DLQ) to be reprocessed later.
6.2.1 Kinesis Data Streams
Amazon’s Kinesis Data Streams is a fully managed and massively scalable service that lets you stream data and process it in real time. Data is available to the consumers of the stream in milliseconds and is stored in the stream for 24 hours, by default, but that can be extended to a whole year, based on your configuration. (Keep in mind that extra charges apply when you extend the retention period for your stream.)
Within a Kinesis stream, the basic unit of parallelism is a shard. When you send data to a Kinesis stream, the data is sent to one of its shards based on the partition key you send in the request. Each shard can ingest 1 MB of data per second or up to 1,000 records per second and supports an egress throughput of up to 2 MB per second. The more shards a stream has, the more throughput it can handle.
There is no upper limit to the number of shards you can have in a stream so, theoretically, you can scale a Kinesis stream indefinitely by adding more shards to it. But there are cost implications that you have to consider when deciding how many shards you will need for your workload.
Kinesis charges based on two core dimensions: shard hours and PUT payload units. One PUT payload unit equates one request to send a record with up to 25 KB to a Kinesis stream. If you send a piece of data that is 45 KB in size, for example, then that counts as two PUT payload units. It works the same way as Amazon’s DynamoDB’s read and write request units.
A Kinesis shard costs $0.015 per hour and $0.014 per million PUT payload units. There are also additional charges if you enable optional features such as extending the data retention period. Some of these additional costs are also charged at a per hour rate, such as the cost for extended data retention and enhanced fan-out.
Because of the hourly cost, it’s not economically efficient to over-provision the number of shards you’ll need. Given the amount of throughput each shard supports, you don’t need many shards to support even a high throughput system like Yle’s data ingestion pipeline.
Based on Yle’s prime-time traffic of 600,000 requests per minute, if we assume the traffic is uniformly distributed across 1 minute, then we arrive at 10,000 requests per second. And assuming that each event is less than 25 KB in size, then Yle needs about 10 shards to accommodate this traffic pattern. However, as we discussed, their traffic is spiky and, because Kinesis doesn’t support autoscaling, the Yle team over-provisions their stream, running 40 shards all the time. This gives the team plenty of headroom to handle unexpected spikes and to minimize the risk of data loss.
6.2.2 SQS dead-letter queue (DLQ)
Because data is the blood supply for Yle’s ML algorithms, the team wants to ensure that it’s not lost when the Kinesis service experiences an outage in Yle’s region. In the event the Kinesis service is out of commission, the API sends the events to the SQS DLQ so they can be captured and reprocessed later.
6.2.3 The Router Lambda function
To process the constant stream of events, a Lambda function called Router subscribes to the Kinesis data stream. This function routes events to different Kinesis Firehose streams that the other microservices use.
To make storing and querying the data more efficient, the Yle team stores the events in Apache Parquet format. To do this, they use Amazon Kinesis Data Firehose (to batch data into large files and deliver them to S3) with AWS Glue Data Catalog (to provide the schema). Figure 6.2 shows this arrangement.
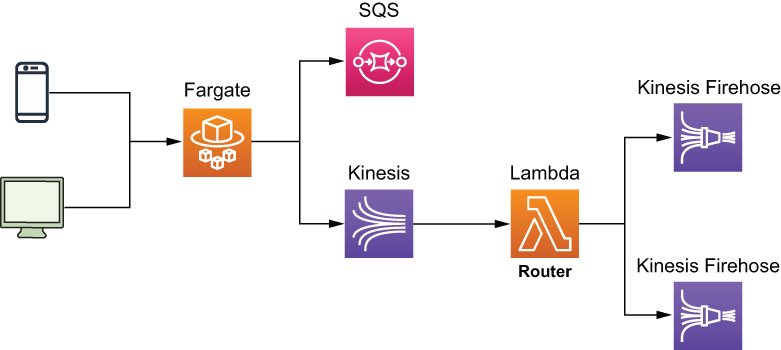
Figure 6.2 The Lambda Router function routes events to different Kinesis Firehose streams so they can be aggregated and converted to Apache Parquet files.
6.2.4 Kinesis Data Firehose
Kinesis Data Firehose is another member of the Amazon Kinesis family of services. It is a fully managed service to load streaming data to a destination. Kinesis Firehose can send data to Amazon S3, Amazon Redshift, Amazon Elasticsearch Service (Amazon ES), and any HTTP endpoint owned by you or by external service providers such as Datadog, New Relic, and Splunk.
A Firehose stream allows you to load streaming data with zero lines of code. Unlike Kinesis Data Streams, a Kinesis Firehose stream scales automatically, and you pay for only the volume of data you ingest into the stream. The cost for ingesting data into Kinesis Data Firehose starts at $0.029 per GB for the first 500 TB of data per month. It gets cheaper the more data you ingest.
In addition to the automated scaling, a Firehose stream can batch the incoming data, compress it and, optionally, transform it using Lambda functions. It can also convert the input data from JSON to Apache Parquet or to Apache ORC formats before loading it into the destination.
Like Kinesis Data Streams, it stores data in the stream for only up to 24 hours. You can configure the batch size by the maximum number of records or for a certain period of time. For example, you can ask the Firehose stream to batch the data into 128 MB files or 5 minutes’ worth of data, whichever limit is reached first. It’s a convenient service with no management overhead for scaling, and you don’t have to write any custom code to transport data to the intended target.
To convert the data from JSON format to Apache Parquet or Apache ORC, you need to use the AWS Glue Data Catalog service. A Kinesis Firehose stream uses the schema captured in the Glue Data Catalog before sending it to a destination.
The Yle team uses S3 as the data lake and the destination for the Kinesis Firehose streams (figure 6.3). Once the data is delivered to S3, it is further processed and consumed by a number of microservices to perform several ML tasks such as demographic predictions.

Figure 6.3 The Router function routes incoming events to a number of Kinesis Firehose streams, one for each type of event. The streams then batch, transform, and convert the data into Apache Parque format and write it to S3.
6.2.5 Kinesis Data Analytics
To personalize the icon image for videos, the Yle team uses the contextual bandits model, which is a form of an unsupervised ML model. They use the user-interaction events to reward the model so it can learn what the user likes. To do that, the team uses Kinesis Data Analytics to filter and aggregate the data from the Firehose stream and deliver it to a Lambda function called Reward Router. This function then calls several Reward APIs to reward the personalization models the Yle team maintains (figure 6.4).

Figure 6.4 The Yle team uses Kinesis Data Analytics and Lambda to reward different personalization models in real time.
Kinesis Data Analytics lets you run queries against streaming data using SQL or Java and the Apache Flink framework. Using an SQL approach, you can join, filter, and aggregate data across several streams without writing any custom code or running any infrastructure. The Java approach, however, gives you the most control over how your application runs and how it processes the data.
You can output the result of your queries to Kinesis Data Stream, Kinesis Firehose, or a Lambda function. Having a Lambda function as a destination gives you a lot of flexibility, however. You can process the results further, forward the results to anywhere you want, or both. In Yle’s case, they use the Reward Router function as the destination for the Kinesis Data Analytics application and reward the relevant personalization models.
6.2.6 Putting it altogether
Taking a step back, you can see in figure 6.5 what Yle’s data pipeline looks like from a high level. We have omitted some minor details, such as the fact that the Kinesis Firehose streams also use Lambda functions to transform and format the data and the fact that this is just the start of the journey for many of these user events. Once the data is saved into S3 in Apache Parquet format, many microservices ingest the data, process it, and use it to enrich their ML models.

Figure 6.5 Yle’s data pipeline architecture. They use Fargate to run the ingestion API because of cost and performance considerations and then process the ingested events in real time using Kinesis Data Streams, Kinesis Firehose, and Lambda. The data is transformed, compressed, and converted to Apache Parquet format and stored in S3 as the data lake. At the same time, they also use Kinesis Data Analytics to perform real-time aggregations and use Lambda to reward the relevant personalization ML models.
What I would like to highlight in this architecture is the prevalent use of Kinesis and its data analytics capabilities. This includes
-
Kinesis Data Streams for ingesting large amounts of user events.
-
Kinesis Firehose Streams for batching, formatting, and outputting data into large compressed files that are more easily consumable by the downstream ML models.
-
Kinesis Data Analytics for running aggregations over live streams of data in real time and using a Lambda function as a destination to reward personalization models.
6.3 Lessons learned
The use of these Kinesis capabilities and how they are combined is a common sight in data analytics applications. However, Yle is processing events at a much higher scale than most! Operating at such high scale comes with unique challenges, and the Yle team has learned some valuable lessons along the way, including those that follow.
6.3.1 Know your service limits
Every service in AWS comes with service limits. These generally fall into three categories:
-
Resource limits—How many of X can you have in a region. For example, Kinesis Data Streams has a default quota of 500 shards per region in us-east-1, us-west-1, and eu-west-1, and 200 shards per region in all other regions. Similarly, AWS Identity and Access Management (IAM) has a default quota of 1,000 roles per region.
-
Control-plane API limits—How many requests per second you can send to a control plane API to manage your resources. For example, Kinesis Data Streams limits you to five requests per second to the CreateStream API.
-
Data-plane API limits—How many requests per second you can send to a data plane API to act on your data. For example, Kinesis Data Streams limits you to five GetRecords requests per second per shard.
These limits are published in the AWS Service Quotas console. In the console, you can view your current limits and whether you can raise the limit.
Limits that can be raised are considered soft limits, and those that can’t be raised are considered hard limits. You can ask for a soft limits raise via a support ticket, or you can do it in the AWS Service Quotas console. But it’s worth keeping in mind that sometimes there is a limit to how far you can raise those soft limits. For example, the number of IAM roles in a region is a soft limit, but you can raise that limit to only 5,000 roles per region. If your approach relies on raising these soft limits indefinitely, then there’s a good chance that you’re using the service in a way that it’s not designed for, and you might have to reconsider your approach.
Keeping an eye on your usage levels and your current limits is something that every AWS user should do but is especially important when you need to operate at scale and you run the risk of running into those limits. For the Yle team, one of the important lessons they learned is that you need to raise the limit on the number of Fargate tasks you can run and give yourself plenty of headroom because it can take a few days for AWS to raise the limit in your account.
At present, the default limit is 1,000 concurrent Fargate tasks per region. When the Yle team started out, however, the default limit was only 100, and it took the team three days to raise that limit to 200.
Project throughput at every point along the pipeline
To understand which service limits affect your application, look at every service along the way and build a projection of how throughput changes with user traffic. Take Yle’s case: as the number of concurrent users goes up, there’s more traffic going through the ingestion API running in Fargate.
-
How does this increase affect the throughput that needs to be processed by Kinesis and, therefore, the number of shards that need to be provisioned?
-
Based on the current BatchSize and ParallelizationFactor configurations, how many concurrent Lambda executions would be required to process the events at peak load?
-
Given that many concurrent Lambda executions, how many events would be sent to each Kinesis Firehose stream?
-
Does your current throughput limit for Kinesis Data Firehose support that many events per second?
Always load test, don’t assume
Every service in the pipeline can become a bottleneck, and the best way to know that your application can handle the desired throughput is to load test it. The services you build your application on might be scalable, but it doesn’t mean that your application is, not without the proper adjustment to its service limits.
If your target is to handle 100,000 concurrent users, then load test it to at least 200,000 concurrent users. Who knows, maybe your application will be successful! That’s what you’re hoping for, right? Even if your application already comfortably handles 50,000 concurrent users, load test it to 200,000 concurrent users anyway. You can’t assume the system is infinitely scalable and that its performance characteristics are perfectly consistent as throughput goes up. Don’t assume anything; find out.
Some limits have a bigger blast radius than others
It’s also worth mentioning that some service limits have a bigger blast radius than others. Lambda’s regional concurrency limit is a great example of this.
Whereas exhausting the write throughput limit on a Kinesis shard affects only putRecord operations against that shard, the impact is localized to a single shard in a single Kinesis stream and will not affect your application in a big way. On the other hand, exhausting the Lambda concurrent executions limit can have a wide-reaching impact on your application because you’re likely using Lambda functions to handle a variety of different workloads: APIs, real-time event processing, transforming data for Kinesis Firehose, and so on.
This is why you need to pay even more attention to those service limits that have a big blast radius. In the case of Lambda, you can also use the ReservedConcurrency configuration to restrain the maximum number of concurrent executions a function can have in cases where it’s appropriate and necessary.
Mind CloudWatch’s metric granularity
You should monitor your usage level and be proactive about raising service limits. One way to do that is by setting up CloudWatch alarms against the relevant metrics. One caveat to keep in mind here is that CloudWatch often reports usage metrics at a per-minute granularity but the limits are per second, which applies to both Kinesis Data Streams and DynamoDB’s throughput metrics. In these cases, when you set up those CloudWatch alarms, make sure that you set up the thresholds correctly. For example, if the per-second throughput limit is 1, then the corresponding per-minute threshold should be 60.
6.3.2 Build with failure in mind
Notice that in figure 6.1, there is a SQS DLQ? It’s there as a backup for when there is a problem with the Kinesis Data Streams service. Kinesis Data Streams is a robust and highly scalable service, but it’s not infallible.
Everything fails, all the time
AWS CTO, Werner Vogel, famously said, “Everything fails, all the time.” It’s a fact of life that even the most reliable and robust service can have a hiccup from time to time. Remember when S3 was down (https://aws.amazon.com/message/41926) for a few hours in 2017? Or that time when Kinesis Data Streams had an outage and affected CloudWatch and EventBridge as well (https://aws.amazon.com/message/11201)? Or when Gmail, Google Drive, and YouTube went down (http://mng.bz/ExlO)?
At the machine level, individual disk drives or CPU cores or memory chips constantly fail and are replaced. Cloud providers such as AWS and Google have invested heavily into their physical infrastructure as well as their software infrastructure to ensure that such failures do not affect their customers. In fact, by using serverless technologies such as API Gateway, Lambda, and DynamoDB, your application is already protected from data center-wide failures because your code and data are stored in multiple availability zones (data centers) within a given AWS region. However, there are occasional region-wide disruptions that affect one or more services in an entire AWS region, such as the S3 and Kinesis outages mentioned previously.
What this means is that you need to build your application with failure in mind and have a plan B (and maybe even a plan C, D, and E) in case your primary service has a bad day at the office. DLQs are a good way to capture traffic that can’t be delivered to the primary target when first asked. Many AWS services now offer DLQ support out of the box. For example, SNS, EventBridge, and SQS all support DLQs natively in case the events they capture cannot be delivered to the intended target after retries. If you process events from a Kinesis Data Stream with a Lambda function, then you can also use the OnFailure configuration to specify a DQL.
The more throughput your system has to process, the more failures you will encounter, and the more important these DLQs become. Remember, even a one-in-a-million event would occur five times a minute if you have to process 5,000,000 requests a minute!
Pay attention to retry configurations
As you introduce more moving parts into your architecture and process more throughput, you should also pay more attention to your timeout and retry configurations. There are two problems that often plague applications that operate at scale:
-
Thundering herd —A large number of processes waiting for an event are awaken at the same time, but there aren’t enough resources to handle the requests from all these newly awaken processes. This creates a lot of resource contention, potentially causing the system to grind to a halt or fail over.
-
Retry storm—An anti-pattern in client-server communications. When a server becomes unhealthy, the client retries aggressively, which multiplies the volume of requests to the remaining healthy servers and, in turn, causes them to timeout or fail. This triggers even more retries and exacerbates the problem even further.
Retries are a simple and effective way to handle most intermittent problems, but setting these needs to be done with care. A good practice is to use exponential backoff between retry attempts and the circuit breaker pattern to mitigate the risk of retry storms (https://martinfowler.com/bliki/CircuitBreaker.html).
6.3.3 Batching is good for cost and efficiency
Cost is one of those things that developers often don’t think about when they’re making architectural decisions, but this can come back and bite them in a big way later. This is especially true when you need to operate at scale and process large volumes of events. As we discussed in section 6.1.1, one of the reasons why the Yle team decided to use Fargate for ingesting user-interactions events instead of API Gateway and Lambda was cost and efficiency.
In general, AWS services that charge you based on up time tend to be orders of magnitude cheaper when running at scale, compared with those that charge based on request count. And the bigger the scale, the more you need to batch events for cost and efficiency. After all, processing 1,000 events with a single Lambda invocation is far cheaper and more efficient than processing those with 1,000 Lambda invocations.
Processing events in a batch also reduces the number of concurrent Lambda executions you need to run and minimizes the risk of exhausting the regional concurrent executions limit. However, with batch processing comes the potential for partial failures.
If you process one event at a time and that event fails enough times, then you put it into the DLQ and move on to the next event. But when you process 1,000 events in a single invocation and one event fails, what do you do about the other 999 events? Do you throw an error and let the invocation be retried, potentially reprocessing the 999 successful events? Do you put the failed event into a DLQ and process it later? These are the sort of questions that you have to answer.
6.3.4 Cost estimation is tricky
If you don’t pay attention to cost, then it can pile up quickly and catch you by surprise. But trying to accurately predict your cost ahead of time is also difficult; there are a lot of factors that can affect your cost in production. For example, looking at the architecture diagram in figure 6.5, you might be focusing on the cost of Fargate, Lambda, and the Kinesis family of services. There are also other peripheral services to consider, such as the cost for CloudWatch, X-Ray, and data transfer costs.
The cost of Lambda is usually a small part of the overall cost of a serverless application. In fact, in most production systems, the cost of Lambda often pales in comparison with the cost of CloudWatch metrics, logs, and alarms.
Summary
-
Yle’s ingestion API processes more than 500 million events per day and more than 600,000 events per minute at peak times. The traffic is spiky and heavily influenced by real-world events such as a live hockey match or the election results.
-
The Yle team uses Fargate for the ingestion API because of cost and performance considerations.
-
In general, AWS services that charge you based on up time are significantly cheaper to use at scale compared to those services that charge you based on usage (number of requests, volume of data processed, etc.).
-
The Yle team uses Kinesis Data Stream, Kinesis Data Firehose, and Lambda to process, transform, and convert the ingested events to Apache Parquet format.
-
The Yle team uses Kinesis Data Analytics to perform real-time aggregation on the ingested events.
-
The aggregated events reward the relevant personalization ML models.