
30
Business Intelligence Services
By Reza Alirezaei
If you have ever done a Business Intelligence (BI) project before, chances are that at some point in your career, you have turned a paper-based report into a digitized format. Regardless of the technology you used to deliver your first project, the joy of eliminating an inefficient manual process stayed with you for a long time, if not forever. Well, that's what this chapter is all about!
This chapter is about how to design solutions that help organizations to harness and distribute information in a more intelligent way. It also covers key BI capabilities provided with SharePoint 2010 that help you design such solutions.
UNDERSTANDING BUSINESS INTELLIGENCE
For a long time, a big hurdle in IT was the fact that looking at historical or real-time data and making sense of it was just something restricted to a special group of people with specific talents and knowledge of specialized tools.
It's crystal clear that part the problem lies in the tools, hardware, and methodologies used to work with information. Regardless of the root cause, with all the advancements in the IT industry, this has caused a good deal of trouble for organizations, such as inaccurate statistics and bad decisions being made (which sometimes come with additional costs and lifelong consequences).
Ask any executive why he or she needs BI and the answer will most likely always boil down to one sentence: “Because I need to make better operational and tactical decisions.” Executives need BI, not just to show them the answer they were looking for or the problem, but to help them ask the right questions, and to help them get the insights they need to do their jobs.
The BI offering in SharePoint 2010 comes in three models:
- Organizational model — This is a set of tools and features that help people align strategies with overall company goals and objectives. Typically, this is done with IT involvement.
- Self-service model — This model is used to extend the reach of BI solutions to broader sets of users. The idea of making BI available to the masses is that everyone has access to the information they require to reduce the overload on IT.
- Community model — This is where SharePoint's innate collaboration features and BI come together to help not only the individuals find information they require, but teams and groups make better decisions when they come together and collaborate.
UNDERSTANDING INFORMATION STORAGE AND RETRIEVAL
One major improvement in SharePoint 2010 (when compared to prior versions) is the new features to work with internal and external information. In retrospect, this improvement is most likely because of the limitations in the earlier versions of the product.
In SharePoint 2007, SharePoint lists could store information in pretty much the same structured way a database does — in rows and columns. However, performing simple data retrieval operations was not necessarily easy because the only option was to use the server-side object model. This could potentially involve the use of SharePoint's weakly-typed object model and Collaborative Application Markup Language (CAML) language, which was a little bit challenging for most developers. Additionally, if you wanted to work with external data, you were on your own to handle security and CRUD (Create/Read/Update/Delete), unless you wanted to use Business Data Catalog (BDC) in a read-only manner. As you can tell, there were not so many options available.
In SharePoint 2010, lists are shipped with a lot more improved behaviors, and include capabilities that were traditionally exclusive to a database. Let's not forget that creating and managing those lists are a lot easier now, and they require no specialized skills in designing, implementing, and maintaining custom data models. External lists (a new notion in SharePoint 2010) are capable of surfacing external data from almost any line-of-business (LOB) applications.
SharePoint 2010 ships with a lot stronger server-side and client-side APIs that enable developers to interact with the underlying data a lot easier. The successor of BDC, Business Connectivity Services (BCS), supports full CRUD operations through both its server-side and client-side object models. More BI features are baked into the product, which makes data retrieval quite easy in SharePoint 2010. Figure 30-1 shows the data retrieval options in SharePoint 2010.
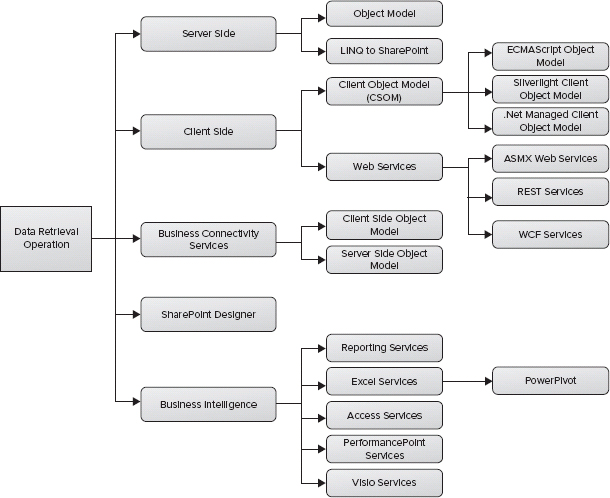
FIGURE 30-1: Data retrieval options in SharePoint 2010
Of course, more choices always come with tradeoffs and restrictions that must be understood up front. Understanding these factors can help a SharePoint architect design more robust applications on top of this great platform.
 No matter what data retrieval option you choose, never directly query SharePoint content databases. Content databases are not designed to be directly accessed and queried by custom solutions.
Aside from the denormalized nature of out-of-the-box SharePoint databases (to improve database access times), a number of other reasons exist why you should avoid directly retrieving data from SharePoint configuration and content databases:
- A direct call into the SharePoint configuration and content databases is not supported by Microsoft.
- You can cause deadlocks and performance issues.
- There can be multiple content databases per SharePoint web application that can be added at later time.
- Underlying database schema can change in future updates.
Instead, take advantage of the other approaches, such as the following:
- Use the SharePoint object model to work with SharePoint data.
- Extract SharePoint data into a staging database (using the object model), and work with that database instead. There might be some delay, depending on how you extract and stage the data.
- Back up and restore SharePoint databases into a non-production environment, and work with that database. However, this approach doesn't give you real-time data.
AFFINITIES BETWEEN A SHAREPOINT LIST AND DATABASE
A natural question that arises in the early stages of the design process is where to store the data. This surprisingly simple question reveals a lot about your overall architecture and data modeling. Basically, this question has only three possible answers: SharePoint lists, external databases, or a set of business services.
Before diving into a discussion about BI in SharePoint 2010, first let's start with the core concepts of data modeling. A good place to start is to compare a SharePoint list with a database.
You should be familiar with databases, and most likely you've designed some sort of data model at some point in your professional career. Essentially, a database is a container for a bunch of other objects (such as tables, security, indexes, relationships, and so on). Figure 30-2 shows some of the core concepts in a database, like tables, relationships, and columns.
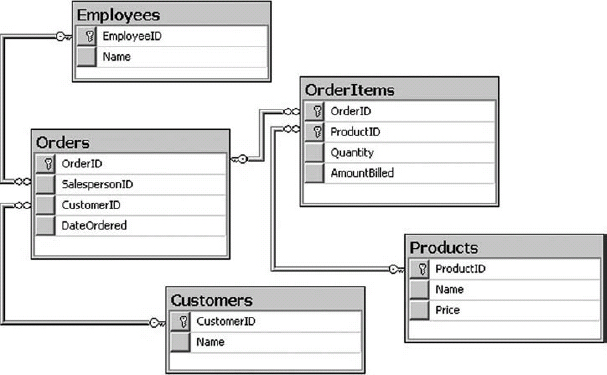
FIGURE 30-2: Database tables, relationships, and columns
Many of the database concepts have a similar notion in SharePoint. For example, in SharePoint, one could argue that a database is equivalent to a site. In a database, a table contains entities. The attributes of such entities are defined by database columns, and an instance of an entity is a database row. Similarly, a SharePoint list contains entities, and these entities are defined by list columns, and an instance of an entity is a list item.
Database tables can have primary keys. Although there really is no equivalent notion of a primary key in SharePoint lists, SharePoint creates an ID for every item it adds to a list, and it treats that column as a primary key under the covers. Foreign keys relate entities in a database, and, in the case of SharePoint, a similar concept is a lookup column.
There is a loose mapping between database triggers and event receivers in SharePoint. Triggers fire when something happens, like when you create, update, and delete objects. Think about event receivers that fire when list items are changed.
Some concepts in SharePoint really don't have a direct equivalent in a database. These concepts include content types, site columns, workflow, and the capability to associate these items to each other in a reusable way.
STRUCTURED VERSUS UNSTRUCTURED DATA
An important characteristic of any information management system is the capability to keep the information retrievable in its various forms and kept in any data sources. As an information management system, SharePoint Server 2010 enables users to find unstructured information (such as sites, documents, and videos) and structured information.
However, there is a general misconception that SharePoint is a humongous repository for unstructured data (such as sites, documents, and videos), and structured data (such as reports, spreadsheets, and analytical systems that are exclusive to databases or other systems). In reality, these two worlds are changing fast.
Nowadays, databases handle more aspects of unstructured data (that is, storing Binary Large Objects, or BLOBs), and SharePoint can contain more and more structured information. For example, you can use external lists to surface a database table onto SharePoint pages. Another example would be storing data in a highly structured way in Excel files and exposing it, in a true service model, to the consumers of the service in the current farm or in another farm.
One primary distinction between SharePoint lists and databases is that SharePoint lists enable a great experience in the browser, and databases can handle advanced data models that carry complex relationships with high availability.
Table 30-1 highlights the primary differences between databases and a SharePoint list. In particular, it shows the main cases that will drive you one way or another.
TABLE 30-1: Database Versus SharePoint List

GETTING STARTED WITH BUSINESS INTELLIGENCE
So far, you have seen some concepts and comparisons between traditional data modeling using databases and SharePoint lists. Now, let's examine some BI terms and concepts. When it comes to BI, sometimes there are terminologies with blurry lines between them, which makes them a bit difficult to understand. Let's have a look at few of them here.
Report
A report is a formal document (with or without visual elements) that presents focused information to a specific audience for a variety of reasons.
Dashboard
Conceptually, a dashboard is a report that contains real-time information used for evaluating performance, and for ensuring that operational goals are met.
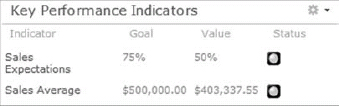
Key Performance Indicator (KPI)
Goals of the business are typically defined by one of the company executives. In PerformancePoint, a primary metric used to implement and measure this success is something referred to as a key performance indicator (KPI) or a status indicator. Once a KPI is defined and implemented, it can be used to monitor the organization's progress in a specific area, such as sales average and expectations earned from Internet sales. Figure 30-3 shows a sample KPI.
Scorecard
A scorecard stays at a higher level than a dashboard, and is more focused on monitoring the performance associated with organizational strategic objectives. So, the key difference here is short-term goals (operational) verses long-run success (strategy).
In reality, though, the distinction between a scorecard and a dashboard is absolutely unnecessary, because both are used to accomplish one thing — ensuring that executives are on the right track to make the right decision and reach established goals in the future.
In the context of BI in SharePoint, both dashboards and scorecards are built using PerformancePoint. A PerformancePoint dashboard is simply an .ASPX page that renders a bunch of heads-up displays, including a scorecard. That's it!
Figure 30-4 shows a sample dashboard that contains a scorecard on the left, with KPIs and a gauge on the right side.
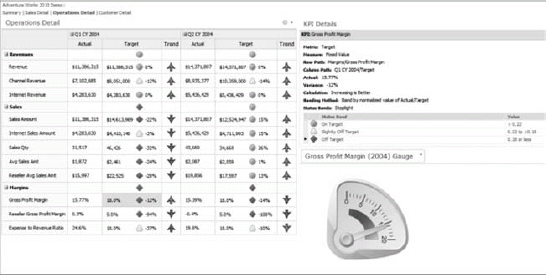
FIGURE 30-4: A sample dashboard with a scorecard
Data Source
A data source is a stored set of information about the physical storage of data used in reports, dashboards, and so on. The physical storage can be a database, a SharePoint list, or any other data object that contains the actual data.
Online Analytical Processing (OLAP)
Picture this. You are tasked to analyze Internet sales information of your company over the past ten years. You will be more interested in sums of sales per product, per country, and quarterly than in an analysis of the individual sales. Aggregating data at this level, although possible with most relational database management system (RDBMS) engines, isn't the most optimized process at all.
Online Analytical Processing (OLAP) is a technology that tends to remove any granularity in the underlying data, and focuses more on efficient data retrieval and facilitation of data navigation.
Data Warehouse
Typically, OLAP's information comes from a database, referred to as data warehouse. Compared to a relational database, a data warehouse requires much tighter design work up front for supporting analysis and data aggregation (such as summed totals and counts).
Cube
Because the storage unit used in OLAP is multidimensional, it's called a cube instead of table. The interesting aspect of OLAP is its capability to store aggregated data hierarchically, and give users the capability to drill down or up the aggregates by dimensional traits. In a cube, dimensions are a set of attributes representing an area of interest. For example, if you are looking at general sales figures, you would be interested in geography, time, and product sales.
Dimensions give contextual information to the numerical figures, or measures, on which you are aggregating. For example, OLAP calls the Internet sales amount, Internet gross profit, and Internet gross profit margin a measure. Because the measures are always pre-aggregated and anticipated by the cube, OLAP makes navigation through the data almost instantaneous.
If you wanted to look at a particular region that had a good quarter for sales, OLAP's navigational feature allows you to expand the quarterly view to see each month or day of the quarter. At the same time, you can also drill down into the region itself to find the cities with a major increase in sales.
Now, at this point, let's begin to focus on each BI service offering. Let's start with Excel Services!
USING EXCEL SERVICES
Excel is a popular analytical tool for viewing and changing corporate data, and it's been around for a long time. As far as it relates to SharePoint 2010, this technology comes in two flavors: the client application and the server component.
The client application is called Microsoft Office Excel 2010, and it's the same familiar tool that you may have been using for a long time. The server component is a service application called Excel Services. Excel Services has also been around since Microsoft Office SharePoint Server 2007, but it has been enhanced in SharePoint Server 2010.
Configuring Excel Services makes all this functionality available to the farm as a service application, which means that it can be scaled out independently to many individual application servers.
Whereas the client application gives end users the capability to create workbooks that retrieve and manipulate data from local or remote data sources, the service application allows the Excel workbooks to reside on the server. Thus, they can be shared across your organization.
An Excel workbook doesn't become available in Excel Services “automagically.” The process of making an Excel workbook available in Excel Services in referred to as publishing the workbook, which is performed from within Microsoft Office Excel 2010. Figure 30-5 shows a published Excel workbook that's accessed through a browser.
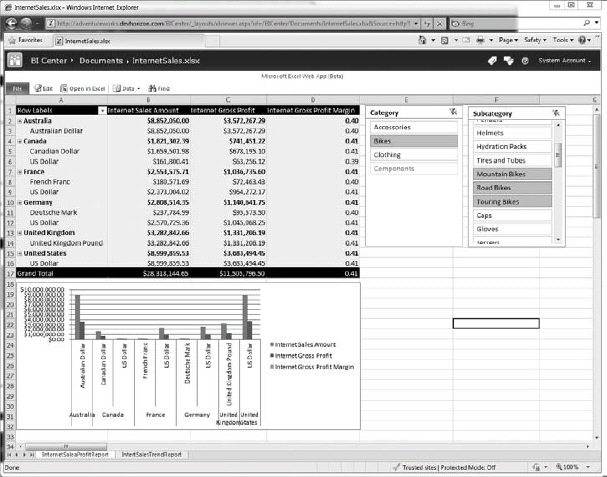
FIGURE 30-5: Browser view of an Excel workbook
Figure 30-6 shows the same workbook rendered in a mobile Safari browser on an iPhone.

FIGURE 30-6: Mobile view of an Excel workbook
![]() Publishing any BI assets (such as reports, Excel workbooks, or Visio diagrams) to SharePoint lets you take advantage of security operations, workflows, backup and recovery, trusted location, a familiar interface for storing and using BI data, and many other document management features in the product.
Publishing any BI assets (such as reports, Excel workbooks, or Visio diagrams) to SharePoint lets you take advantage of security operations, workflows, backup and recovery, trusted location, a familiar interface for storing and using BI data, and many other document management features in the product.
Understanding the Excel Services Architecture
Excel Services in Microsoft Office SharePoint Server 2007 exposed only the ASMX Web Service interface. SharePoint Server 2010 keeps the Web Service interface for backward compatibility, but also adds two new access points to interact with the content of workbooks. One is the new representational state transfer (REST) API, and the other one is the ECMAScript object model, as shown in Figure 30-7.
The REST API makes it possible to expose Excel objects via a simple URL. For example, using REST APIs, you could retrieve the image representation of a chart within a workbook, and display it in a Content Editor Web Part (CEWP). When the chart is updated, so is the image.
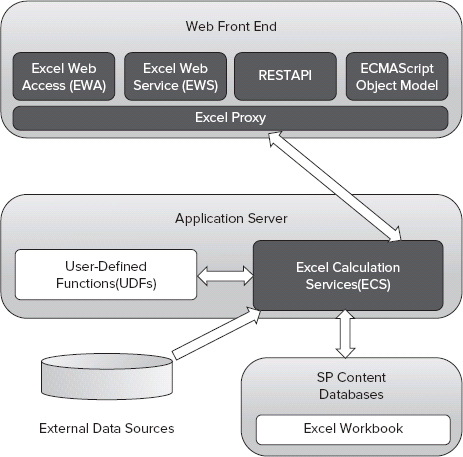
FIGURE 30-7: Excel Services architecture
Here is another example of exposing a specific range in a workbook published to Excel Services:
http://server/_vti_bin/ExcelRest.aspx/Shared%20Documents/
  InternetSales.xlsx/Model/Ranges(‘Sheet!A1’)
![]() For the complete list of sample URIs for the REST service commands in Excel Services, see http://msdn.microsoft.com/en-us/library/ee556820.aspx.
For the complete list of sample URIs for the REST service commands in Excel Services, see http://msdn.microsoft.com/en-us/library/ee556820.aspx.
The ECMAScript object model makes it possible to build custom scripts in more restricted environments like Office 365 where you must use the data from your Excel workbooks to customize your UI.
Following are a few more components in Figure 30-5 that deserve more attention:
- Web front-end server — On the Web Front-End (WFE) servers, the Excel Web Access Web Part (EWA) is the SharePoint web part that converts the results returned by the ECS to HTML, and sends it to the user's browser. EWA also makes it possible for users to interact with the returned result. It goes two ways: from ECS and to ECS.
- Application server — On the application server, the Excel Calculation Server (ECS) is responsible for loading and calculating the spreadsheets in a given workbook. It also runs in intervals for refreshing external data, executing server-based user-defined functions, and maintaining system state.
- Database server — Finally, on the database server, Excel Services uses SharePoint content databases for storing workbooks and content, which makes them like any other unstructured data stored in SharePoint (such as documents, sites, and so on).
When to Use Excel Services
Consider Excel Services when one or more of the following scenarios exist:
- The content of Excel workbooks must be shared with other users across your organization.
- An Excel workbook contains a model (such as a mortgage calculator) that must be consumed with other users or applications across your organization.
- The underlying intellectual property of the model or content of the Excel workbooks must be protected from unauthorized eyes.
- Everyone should have access to a single version of the workbooks.
- Business requirements dictate the interaction with Excel workbooks via a browser to increase the overall reach and use case scenarios.
- Users must collaborate on published Excel workbooks.
- Content owners must publish all or part of Excel workbooks.
- Content owners must control the granularity of data exposed in the workbooks (using EWA), in particular, which parts of workbooks are available and who has access to them.
Excel Services Is Not Just a Pretty Face
There is a general misconception that Excel Services is all about providing a web-based user interface for visualization consumption. Well, that's not necessarily true!
As previously mentioned, data analysts can generate models in Excel that can be widely consumed across your organization. The popular mortgage calculator (http://msdn.microsoft.com/en-us/library/aa973804%28v=office.12%29.aspx) is a great example of this use case.
In such scenarios, Excel Services can host the workbook on the server, perform the complex calculation on the server side, and provide raw data to other visualization tools or custom applications. For example, you can create a web part for entering and validating data, which uses Excel Services to perform complex calculations. This way, you can send the data that a user enters in the web part to the Excel workbook. Finally, you show the returned result from Excel Services in your web part.
USING POWERPIVOT FOR EXCEL
PowerPivot ships with several client- and server-side components that integrate with Excel and SharePoint. Together, the client application and server components provide an end-to-end solution that enables data analysis for users on their workstations, as well as on SharePoint sites.
Understanding the PowerPivot for Excel Architecture
The PowerPivot client application can be installed using an add-in called the PowerPivot for Excel Add-in. You can download and install it from www.microsoft.com/downloads/en/details.aspx?FamilyID=e081c894-e4ab-42df-8c87-4b99c1f3c49b&displaylang=en.
The add-in installs a separate tab in Excel called PowerPivot, and the Analysis Services VertiPaq engine, which runs in-process in Excel. To consume various data sources in Microsoft Office Excel 2010, the client application uses the Analysis Services object model (AMO and ADOMD.NET), which, in turn, use the Analysis Services OLE DB provider. Figure 30-8 shows the different components that make up PowerPivot data access from within Excel.

FIGURE 30-8: PowerPivot data access from within Excel
It's important to understand that PowerPivot workbooks are not separate workbooks or file extensions. They are just Excel workbook files that contain PowerPivot data.
When to Use PowerPivot for Excel
Consider using PowerPivot for Excel when you must combine Excel 2010 rich out-of-the-box functionality with the PowerPivot in-memory engine to let users work with really large data sets offline.
When using the PowerPivot client application in Excel, extremely large-scale data sets can be imported from multiple heterogeneous data sources at one time, all within the same Excel workbook files. You can also merge data sources and build sophisticated relationships, and treat the data as if it were all coming from a single data source.
A 1 million row limit in Excel does not apply to the data sets imported into a PowerPivot workbook. However, the overall workbook size cannot exceed 2 GB. Additionally, if you have a requirement for large PowerPivot workbooks, consider using the 64-bit edition of Microsoft Office Excel 2010.
When you view and manipulate millions of rows of data into a single Excel workbook for ad-hoc reporting, obviously performance is king. To gain better performance and a more responsive user interface, PowerPivot uses the local VertiPaq engine to manage the compression and faster processing of the data. It also uses extensive caching.
USING POWERPIVOT FOR SHAREPOINT
If you publish a PowerPivot workbook to SharePoint, you must have already installed PowerPivot server components. Otherwise, users won't be able to view and interact with the workbook from a SharePoint site. But why?
Although PowerPivot data is visually rendered in an Excel workbook, internally the data is multidimensional and must be kept somewhere other than the workbook itself. Who wants to store millions of rows of data in the workbook?
When you work with PowerPivot data offline, the local VertiPaq engine manages the load, compression, and caching of the data. When you publish the workbook to SharePoint, there should be another mechanism to extract the data from the workbook, and load it in server memory for fast data analysis.
In a SharePoint farm, such a mechanism is implemented by server components (referred to as PowerPivot Service) that are made available by SQL Server Analysis Services R2, which also must be installed in the farm.
All server-side components are fully integrated with SharePoint, which means the farm administrators can use the Central Administration site to configure and manage the PowerPivot service application in the farm. The server components are as follows:
- A SharePoint service application
- A management dashboard
- Document library templates
- Application pages residing in the Layouts library
- A set of reports for using and managing the PowerPivot Service application
On-demand Server-Side Query Processing
PowerPivot server-side components are also tightly coupled with Excel Services. When a user clicks on a PowerPivot workbook, Excel Services receives the request, and processes the Excel workbook. But it doesn't do anything about the PowerPivot data. Instead, Excel Services detects the PowerPivot data and automatically forwards processing requests to an Analysis Services server operating in VertiPaq mode, as shown in Figure 30-9.
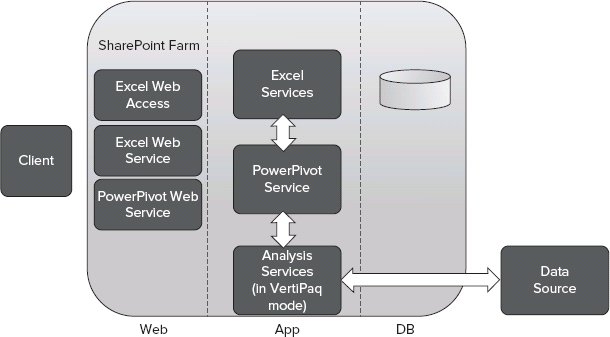
FIGURE 30-9: PowerPivot for SharePoint architecture
![]() Don't worry about the fact that PowerPivot data is loaded in the server memory. PowerPivot data is unloaded when it becomes inactive, or if the farm requires the allocated resources.
Don't worry about the fact that PowerPivot data is loaded in the server memory. PowerPivot data is unloaded when it becomes inactive, or if the farm requires the allocated resources.
If you deploy SQL Server 2008 R2 Reporting Services and PowerPivot for SharePoint in the same SharePoint Server 2010 farm, you will get even more functionality:
- Reporting Services report data can be imported and consumed in a PowerPivot workbook as a data feed, as shown in Figure 30-10. This is ideal when data analysts do not have access to the back-end data sources.
- PowerPivot data can be consumed in a Reporting Services report as data sources. This is ideal when you must leverage Reporting Services’ rich data visualization features, rendering formats (such as PDF), and subscription and delivery options. This requires the Analysis Services object model to be available on the machine used for authoring the reports.

FIGURE 30-10: Consuming Reporting Services report data in a PowerPivot workbook
![]() A point of interest is that all BI services in SharePoint 2010 can work cohesively. For example, a PowerPivot workbook can consume a Reporting Services report's data source, or a PerformancePoint KPI can use Excel and Excel Services as data sources. This lets you combine multiple services in your solutions to take advantage of the unique feature each service has to offer.
A point of interest is that all BI services in SharePoint 2010 can work cohesively. For example, a PowerPivot workbook can consume a Reporting Services report's data source, or a PerformancePoint KPI can use Excel and Excel Services as data sources. This lets you combine multiple services in your solutions to take advantage of the unique feature each service has to offer.
When to Use PowerPivot for SharePoint
Consider using PowerPivot for SharePoint when you must use Excel Services, but you have a requirement to make really large amounts of BI data available to other people in your organization. For more information on when to use Excel Services, refer to “When to Use Excel Services” earlier in this chapter.
USING PERFORMANCEPOINT SERVICES
Many features in the SharePoint ecosystem help users build dashboard-style applications. However, such dashboards may not necessarily be powerful enough to convey the message top executives expect to see. That's where PerformancePoint Services can help.
PerformancePoint Services is a set of components to help users monitor and analyze their business. The outputs are dashboards, scorecards, and KPIs.
PerformancePoint Services starts with its authoring tool — the PerformancePoint Dashboard Designer. The Dashboard Designer is used for managing, arranging, and formatting the items on a PerformancePoint dashboard. The Designer is a Click-Once application that communicates with SharePoint using the web services and client object model. Figure 30-11 shows PerformancePoint Dashboard Designer.

FIGURE 30-11: PerformancePoint Dashboard Designer
Once the workspace is created, PerformancePoint uses it as a container in which to store other content. In a workspace, you can bring together data from multiple data sources (including Analysis Services, SQL Server, SharePoint lists, and Excel Services), create PerformancePoint KPIs, scorecards, analytic charts and grids, reports, filters, and dashboards. Each of these components is unique to PerformancePoint Services, and provides functionality that interacts with a server component that handles the hard parts (like data connectivity and security). Once a workspace is ready, you can publish it to a SharePoint site.
![]() It's important to note that when you publish a workspace to SharePoint, all PerformancePoint assets are stored in SharePoint lists, and exposed via PerformancePoint web parts. Another point of interest is that the PerformancePoint web parts are built on a SharePoint connection framework, which means that they have the capability to send data or receive data from other web parts on the page.
It's important to note that when you publish a workspace to SharePoint, all PerformancePoint assets are stored in SharePoint lists, and exposed via PerformancePoint web parts. Another point of interest is that the PerformancePoint web parts are built on a SharePoint connection framework, which means that they have the capability to send data or receive data from other web parts on the page.
The output of PerformancePoint is reports that can help with the tracking and monitoring of a business, such as those shown in Figure 30-12 and Figure 30-13.
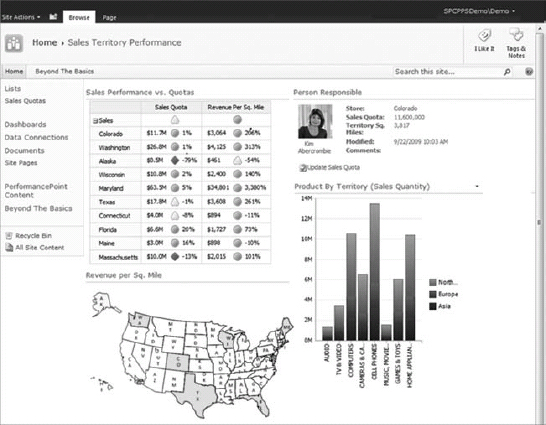
FIGURE 30-12: A Sample PerformancePoint Dashboard
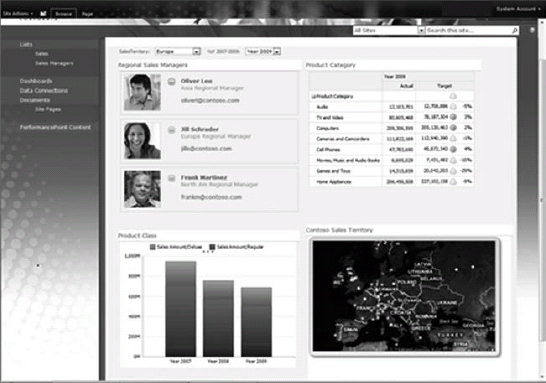
FIGURE 30-13: Another sample PerformancePoint Dashboard
Decomposition Tree
The Visualization Decomposition Tree is a new report type that ships with SharePoint Server 2010 and PerformancePoint Services.
Advantages of using this tool are that it keeps the report sorted and it buckets off insignificant contributors to the bottom of the hierarchy. It also provides an interactive style to navigating a dashboard while showing multidimensional data sets. Essentially, it makes it much easier for users to make sense of this high-level data, and provides more clarity for the underlying details and data behind those values. Figure 30-14 shows a sample Decomposition Tree.
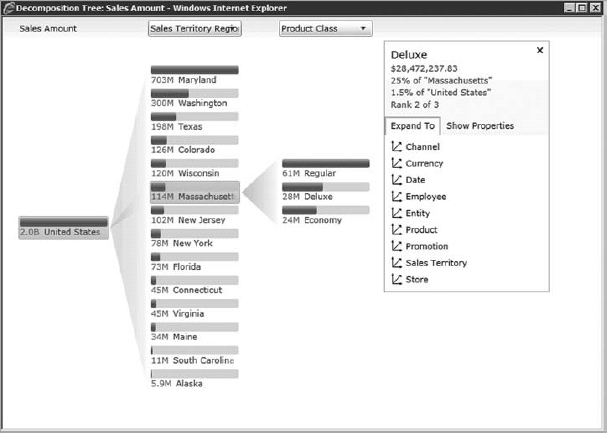
FIGURE 30-14: Visualization Decomposition Tree
Of course, if you want to analyze negativity, you can always flip the default sorting style using the drop-down menu on the top of each level.
![]() Decomposition Tree is a Silverlight application and requires the Microsoft Silverlight 3 framework to be installed on the client machine.
Decomposition Tree is a Silverlight application and requires the Microsoft Silverlight 3 framework to be installed on the client machine.
Understanding the PerformancePoint Services Architecture
The PerformancePoint Services architecture is in three tiers of a SharePoint Server farm topology: Database Server, Application Server, and Web Front-End (WFE), as shown in Figure 30-15.

FIGURE 30-15: PerformancePoint Services architecture
The WFE server hosts the Dashboard Designer application, PerformancePoint web parts, PerformancePoint Web Services (in the ISAPI folder), and the service application proxy that is required to communicate to the PerformancePoint Services service application.
![]() Like all other service application proxies, the PerformancePoint proxy is natively claims-aware. This helps create a distributed architecture for PerformancePoint Services in the farms with no Kerberos implementation.
Like all other service application proxies, the PerformancePoint proxy is natively claims-aware. This helps create a distributed architecture for PerformancePoint Services in the farms with no Kerberos implementation.
In the middle tier are two service applications that make the integration happen:
- Secure Store Service (SSS)
- PerformancePoint Services
In the database layer, most of configurations required for PerformancePoint service applications are stored in PerformancePoint service database.
The Unattended Service Account
One requirement to start PerformancePoint Services is to set up a special account in your SharePoint farm called the unattended service account.
Authentication in PerformancePoint Services 2010 is mostly implemented per data source. However, you can also set up an ad-hoc authentication scheme through the unattended service account and SSS, and use that account in your data sources. This is done directly in the PerformancePoint Services service application settings, as shown in Figure 30-16.
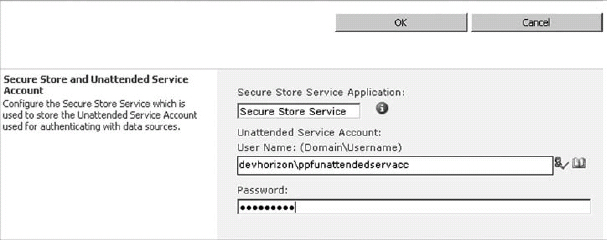
FIGURE 30-16: Configuring the PerformancePoint Services unattended account in SSS
In this case, the password is stored in SSS, and the actual username is stored in the PerformancePoint Services database. If you look at a PerformancePoint target application in SSS, you will find that it contains only the password field, and not the username.
When you set up the unattended service account, you can use it for authentication when creating PerformancePoint assets in Dashboard Designer, as shown in Figure 30-17.
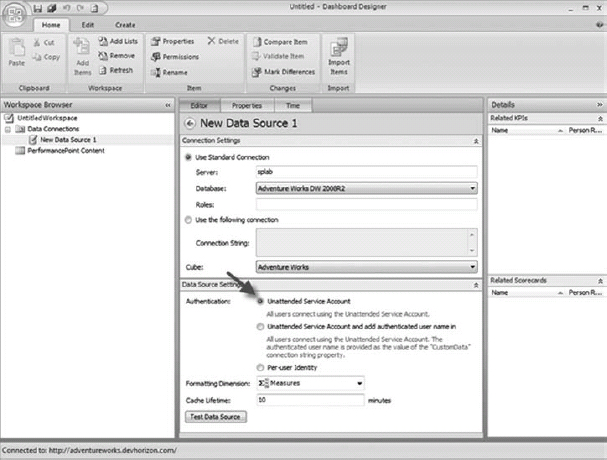
FIGURE 30-17: Unattended service account as an Authentication option
When to Use PerformancePoint
Consider using PerformancePoint when one or more of the following scenarios exist:
- Decision makers need the capability to gauge the state of a business at a glance to make agile decisions to keep the business moving forward.
- Decision makers must quickly and visually break down higher-level data values to understand the underlying details and driving forces behind such values.
USING REPORTING SERVICES
For a long time, reporting was a challenging IT task that involved report developers who had fairly good knowledge of the back-end data sources, and spent a lot of hours of coding and making reports look nice and professional. In the past few years, things have changed as many reporting platforms have been introduced to the IT market. One of these platforms is SQL Server Reporting Services.
SQL Server Reporting Services is a set of tools and services to help you build sophisticated reports that can render in various formats, as well as a programming feature that enables you to customize them.
From the perspective of SharePoint 2010, SQL Reporting Services reports can be exposed using a specific Report Services web part, or they can be delivered to users using various subscription and delivery options.
Figure 30-18 shows a sample Reporting Services report that is published to SharePoint.
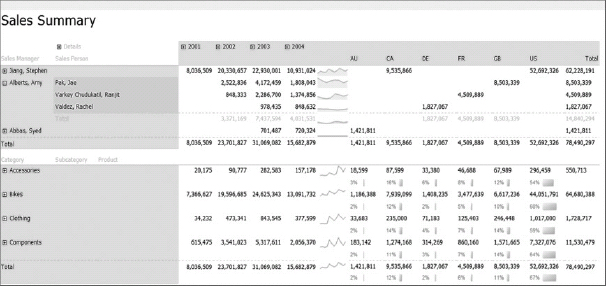
FIGURE 30-18: Reporting Services report
Choosing a Report Authoring Tool
Just like PerformancePoint Services, everything starts with report authoring. Unlike PerformancePoint, however, two authoring tools are available in Reporting Services: Report Builder 3.0 and Business Intelligence Development Studio (BIDS) 2008 R2.
BIDS 2008 R2 is a lightweight version of Microsoft Visual Studio 2008 that enables you to build reports and deploy them to a SharePoint site. BIDS 2008 R2 supports two main operations:
- Building and previewing the Reporting Services report files (*.rdl files)
- Deploying a report to a SharePoint site (which also includes publishing it to SharePoint)
Although BIDS is the preferred tool for report developers, Report Builder 3.0 is yet another tool that is more geared toward the information worker. You can download and install this free tool from www.microsoft.com/downloads/en/details.aspx?FamilyID=d3173a87-7c0d-40cc-a408-3d1a43ae4e33&displaylang=en.
Report Builder is also a Click-Once application that is very similar in concept to PerformancePoint Dashboard Designer, and has all of the same features of BIDS.
Understanding the Reporting Services Architecture
Reporting Services 2008 R2 integration with SharePoint 2010 can be done in two modes:
- Local mode
- Connected mode
In local mode, there is no Report Server, and everything is installed on the WFE server where SharePoint is supposed to be installed.
Local mode is made possible through the installation of the Reporting Services Add-in for SharePoint. The architecture of the local mode integration is pretty straightforward, as shown in Figure 30-19.
Local mode has three major components in the WFE:
- Report Viewer web part — This is an Ajax-enabled web part for rendering a Reporting Services report onto a SharePoint page.
- Reporting Services proxy — This is a Simple Object Access Protocol (SOAP) endpoint that sets up the connection between both products (not used in local mode).
- Report Management UI — This installs all the Central Administration pages for managing Reporting Services.
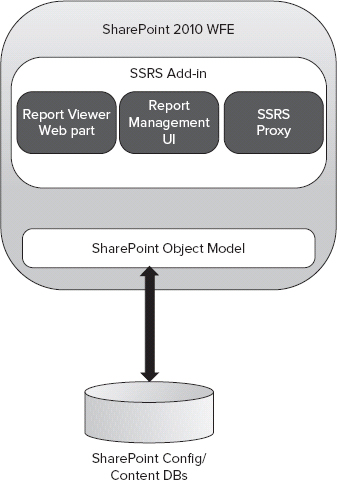
FIGURE 30-19: Local mode architecture
Additionally, the Reporting Services Add-in delivers the following new capabilities:
- Access Services reporting
- Reporting Services content types
- SharePoint list query support
- Ribbon user experience
- Unified Logging Service (ULS) logging
In connected mode, Reporting Services integrates with SharePoint at its full capacity. To make this integration possible, three additional components are installed on the Report Server, as shown in Figure 30-20:
- Security execution component
- Data management component
- SharePoint object model
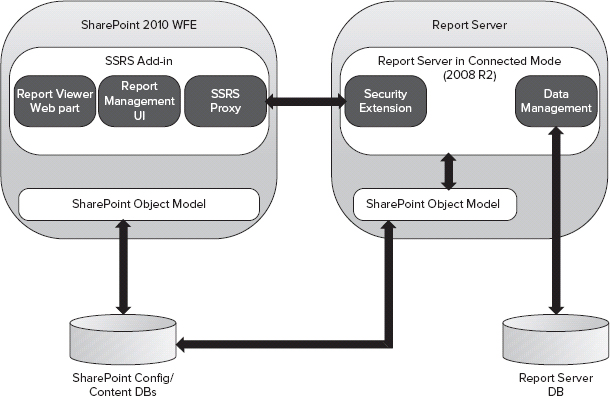
FIGURE 30-20: Connected mode architecture
The security extension component uses the SharePoint permissions security model to authorize access to Report Server operations (such as report processing, snapshots, subscriptions, and so on). The data management component is responsible for Report Server native tasks, and is the only component in the integration that has access to the Report Server database. The SharePoint object model is simply what makes Reporting Services capable of communicating with SharePoint.
Other Reporting Services Offerings
Although embedding reports onto SharePoint pages and on-demand report execution is a primary reason people use Reporting Services, that's not everything this great platform is capable of. A number of improvements and additions to Reporting Services integration with SharePoint can make it an appealing BI solution:
- Parameterized reports — Report authors can preconfigure parameters used in the reports before or after the reports are published to SharePoint, as well as allow end users to override them when viewing the reports.
- Caching — When users don't need to execute the reports in an on-demand manner, reports can be served from a server cache. Once a report is cached, it is, in fact, stored in the Report Server temporary database as an intermediate format image until the cache is invalidated. At this point, if any user requests the same report, the report server retrieves the image from the Report Server temporary database and translates it into a rendering format.
- Snapshots and history — As another alternative to on-demand report execution, snapshots can be used for faster delivery of reports to the end users. Snapshots fundamentally are different than caching. First, snapshots can be placed into history without overwriting previous snapshots. Second, caching a report does provide the capability to produce a persistent copy of the report from a specific point in time, because cached reports are not persisted into history.
- Delivery extension — Once a report is published to SharePoint, it can be executed in the browser, or it can be delivered using out-of-the-box delivery extensions. Out-of-the-box delivery extensions are e-mail, Windows file shares, SharePoint document libraries, and null delivery extensions.
- Subscriptions — Using the delivery extensions, subscriptions allow delivering reports to end users in different formats (PDF, Word, HTML, and so on). There are two types of subscriptions: static and data-driven subscriptions.
![]() If you are interested in learning more about the Reporting Services with SharePoint, see the book Professional Microsoft SharePoint 2007 Reporting with SQL Server 2008 Reporting Services by Coskun Cavusoglu, Jacob J. Sanford, and Reza Alirezaei (Indianapolis: Wiley, 2009). Although this book is written for Microsoft Office SharePoint Server 2007, most of the information is still very applicable.
If you are interested in learning more about the Reporting Services with SharePoint, see the book Professional Microsoft SharePoint 2007 Reporting with SQL Server 2008 Reporting Services by Coskun Cavusoglu, Jacob J. Sanford, and Reza Alirezaei (Indianapolis: Wiley, 2009). Although this book is written for Microsoft Office SharePoint Server 2007, most of the information is still very applicable.
When to Use Reporting Services
Consider Reporting Services when you must deliver reports on demand or at regular intervals using Reporting Service rich delivery formats and subscriptions features. Reporting Services is also the preferred BI tool when report requirements are well-defined, or when users are not very familiar with the underlying data sources used in the reports.
USING VISIO SERVICES
As the saying goes, a picture is worth a thousand words. Figure 30-21 shows a Visio diagram with data-driven shapes representing a network health status structure on an IT network.
If you have requirements for diagrams like the one shown in Figure 30-21, then Visio Services can help. Visio Services is a brand new service on the Microsoft SharePoint Server 2010 platform that makes it possible for users to create and share Visio diagrams in the browser. In other words, users can view the Visio diagrams in their browsers without having Microsoft Office Visio 2010 installed on their machines.
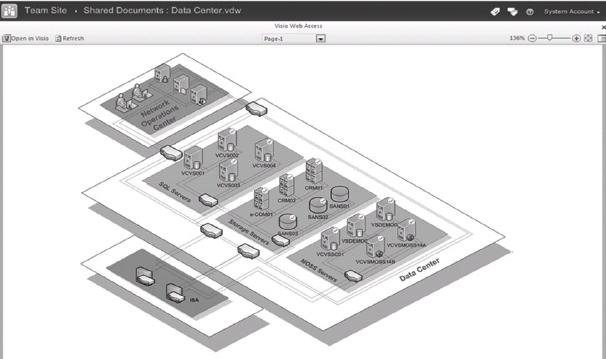
FIGURE 30-21: An example of a published Visio diagram
Capabilities of Visio Services
From a visualization perspective Visio Services can be used to render visual diagrams and structures that are bound directly to BI data, which puts information in context and makes it more meaningful.
From a rendering perspective, the resulting diagrams have full-fidelity rendering in modern browsers like Internet Explorer (IE), Firefox, or Safari. They can also be rendered using Silverlight or, optionally, .PNG files for a down-level experience.
![]() Visio web diagrams can be connected to various data sources, and they can be updated and refreshed automatically when changes occur to the underlying data sources. This functionality on its own is compelling, and is especially more so when combined with other BI features available to users when creating dashboards and custom solutions.
Visio web diagrams can be connected to various data sources, and they can be updated and refreshed automatically when changes occur to the underlying data sources. This functionality on its own is compelling, and is especially more so when combined with other BI features available to users when creating dashboards and custom solutions.
From a developer point of view, the Visio Services mash-up API and web part connection support in the Visio Services web part are nice extensibility points. Most customizations in Visio Services can be implemented via JavaScript or .ASPX pages. Some of the typical scenarios for customizations include responding to user interactions on diagrams, sharing data with other web parts, annotating diagrams, and scrapping diagrams.
When to Use Visio Services
Consider Visio Services when one or more of the following scenarios exist:
- You must share Visio diagrams with other users across your organization, so that they can view and collaborate without having to install Microsoft Office Visio 2010 on their machines.
- You must render visual diagrams that are bound to BI data.
- You must build dashboards and use Visio diagrams that participate in mash-up scenarios.
- You must render visual diagrams that are updated and refreshed on-the-fly when changes occur to the underlying data sources.
USING ACCESS SERVICES
Access Services is a service application that allows Access 2010 databases to be hosted and shared in SharePoint. In nutshell, you create an Access database on your computer and, like all other BI tools, you publish it to SharePoint. Once the database is published, it lives in its database format, in SharePoint. Tables become SharePoint lists, reports become reports, forms become forms, and macros are converted to workflows.
Access Services uses Reporting Services 2008 R2 as its reporting engine. This means that a prerequisite for running Access Services reports in SharePoint is the installation of Microsoft SQL Server 2008 R2 Reporting Services Add-in, and setting up the integration in the local mode (at a minimum). Once you have installed the Reporting Services Add-in, you create a new Access Services service application in your farm.
![]() It's important to note that Access Services does require both the enterprise version of SharePoint 2010 and Microsoft Access 2010 on the desktop of users who will build Access databases that will be published to SharePoint.
It's important to note that Access Services does require both the enterprise version of SharePoint 2010 and Microsoft Access 2010 on the desktop of users who will build Access databases that will be published to SharePoint.
Two types of clients might benefit from Access Services. One is small companies who use Access for its easy-to-use nature. The other one is big companies that let various departments be self-sufficient by using Access as a rapid development tool for smaller projects.
Consider Access Services when one or more of the following scenarios exist:
- You must perform complex queries such as joins, filtering, aggregates, and master-child and parent-child relationships between SharePoint lists that typically require custom coding.
- You must use the Access 2010 client as a flexible report designer tool to create and publish reports (.rdl files) to SharePoint.
Access Services 2010 offers a caching layer that addresses the limitations of the maximum number of list items that a query can return at one time (list view threshold). In another words, it overrides a web application's default list view threshold.
OTHER SOLUTIONS TO RETRIEVE DATA
Although this chapter is about BI, as a SharePoint architect it is crucially important to consider all your options, and design your solutions accordingly. Remember, it's all about empowering the end users with what the platform has to offer at its best, with or without BI.
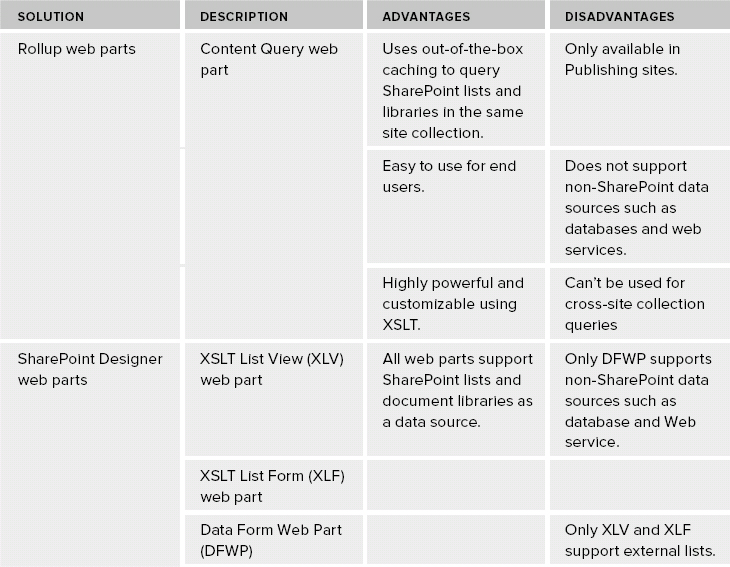
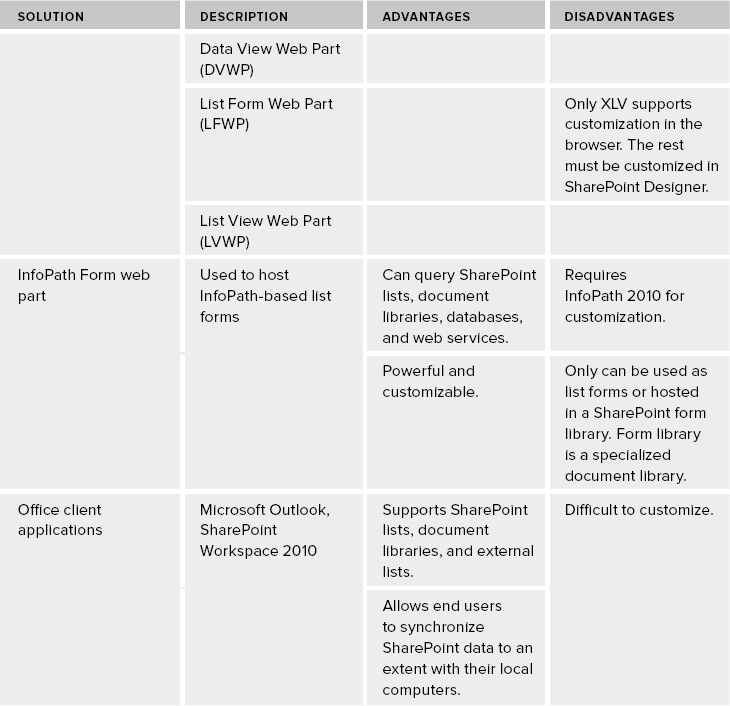
Table 30-2 shows a quick comparison of the various options to consider when proposing data-retrieval solutions.
TABLE 30-2: No-code Solutions to Retrieve Information
SECURITY
In SharePoint Server 2010, some important developments are centered on authentication and authorization, which affects all the services running on the top of the new platform. The BI services have similarities and differences in how to configure security, as shown in Figure 30-22.

Everything starts with a user presenting a Windows identity to a SharePoint site, a process that is also known as authentication. SharePoint uses this identity to authorize access to various resources. Next, the Security Token Service translates the Windows identity to claims identity, which can freely hop across all different tiers within the SharePoint farm.
The SSS unattended service account is a frequently used method for removing the double-hop problem while authenticating to external sources of data. SSS is the enhanced version of the Single Sign-On (SSO) service in Microsoft Office SharePoint Server 2007. Alternatively, all BI assets can use an embedded logon in their data sources, or prompt users to enter their login information such as Reporting Services.
When the identity goes beyond the boundary of the SharePoint farm, some service applications require the use of the Windows Identity Foundation (WIF) Claims to Windows Token Service (C2WTS) to convert the claims identity to a Windows identity so it can be understood by other products such as SQL Server.
SUMMARY
When you put together all different Business Intelligence (BI) services presented in this chapter, you have a powerful array of options for building BI solutions that will solve critical business needs. Extending the reach of your BI solutions is a key feature of SharePoint Server 2010, and is aligned with Microsoft's slogan “Business Intelligence for masses.”
Chapter 31 takes a look at Forms Services and workflow.