As your SharePoint environment matures and your use of it grows, the ability to understand how it is being used can give you valuable insight needed to enhance and extend the services being provided. In this chapter, the various types of metrics and reports in SharePoint are discussed. You can use them to understand resource usage and trends in your site collection. Within SharePoint are both broad, system-level metrics available only to SharePoint technical administrators and specific site and site-collection metrics that your site collection and content administrators can view. This discussion focuses on the metrics and reports available to site collection and content administrators.
SharePoint uses a set of services that leverage the Analytics Processing Component. They use the SharePoint 2016 search services to support compilation and surfacing of managed metrics.
The metrics that are part of SharePoint can be organized into three categories:
Storage Metrics: Provide details of storage space usage in the environment.
Usage Metrics: Present information on usage trends and volumes across content.
Search Metrics: List search query statistics and analytics.
Storage Metrics
As the content managed in SharePoint increases, you should stay aware of the volume of information maintained and how it is distributed so you can identify sites requiring reorganization or lists and libraries whose content volumes call for enhancement through metadata-driven navigation or search tool configurations. Reviewing this information over time can help you understand content growth trends needed for capacity planning.
SharePoint storage metrics provide detailed content volume metrics for review and analysis (see Figure 13-1).
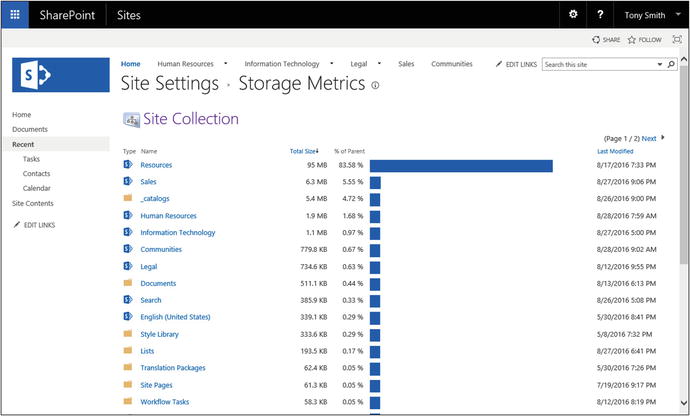
Figure 13-1. Storage metrics
The Storage Metrics report lists all objects in the site collection, including sites, lists, libraries, and documents. Click into any site, list, or library to view storage statistics for specific items and their content. To access storage metrics details, do the following:
Navigate to the root site in the site collection where you want to view storage statistics.
On the site’s home page, select the Site Settings option from the Settings menu.
On the Site Settings page, select the Storage Metrics option from the Site Collection Administration section.
The Storage Metrics page that appears shows overall storage usage details for the sites, lists, and libraries located in the root site of the site collection. From here, you can click on the name of any listed item to show its details. Among the statistics presented as part of the storage metrics details are the following:
Total Size: Provides the sum, in megabytes (MB), for the listed object. When shown for a site, Total Size details reflect the total amount of space used by all list and library content stored in the site. When Total Size details refer to a list or library, they show the total amount of space used by the content stored in that list or library.
% of Parent: Lists the percentage of the overall content used by the listed element in the level displayed. When you first access the Storage Metrics page, the figure shown reflects the overall percentage of space used by the site collection. As you navigate through the listed items, the figure will reflect the percent of space the elements use in the selected site, list, or library. For example, if you click on a site in the Storage Metrics page to see the storage details for items in that site, the figures you see will show the percent of storage used by each subsite, list, and library in the selected site. These details help identify the locations and items that use the most storage space in the environment.
Last Modified: Identifies the date and time an item was last modified. This lets you see how recently information has been managed and helps identify sites, lists, and libraries whose lack of activity indicates that they may no longer be needed.
Site Collection Audit Reporting
You will recall that Chapter 9 discusses how to configure auditing for site collection resources such as specific lists, libraries, and content types in SharePoint. You can audit a variety of performable activities. Once auditing details are configured, related activities are tracked. A set of reports allows you to review these activities (see Figure 13-2).
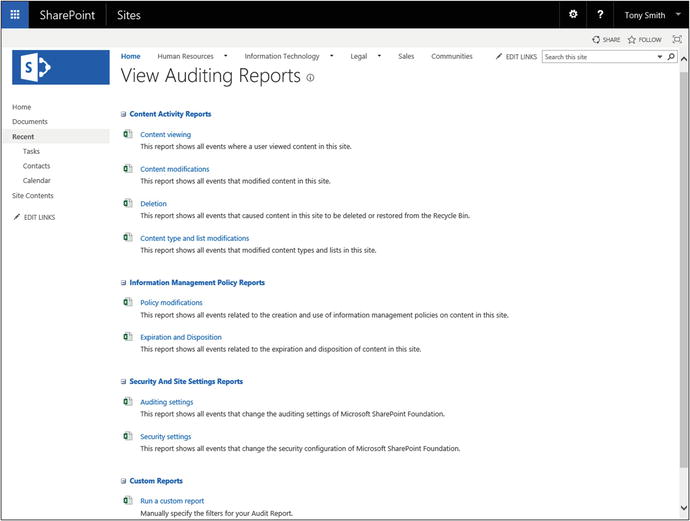
Figure 13-2. View auditing reports
To access these audit reports , do the following:
Navigate to the root site in the site collection.
In the root site, select the Site Settings option from the Settings menu.
On the Site Settings page, select the Audit Log Reports option from the Site Collection Administration section.
On the View Auditing Reports page, do the following:
For all reports but the custom reports:
Click the name of the auditing report to be accessed.
On the Run Reports: Customize Report page, select the location where the report is to be saved, and click the OK button.
For the custom reports, do the following:
On the Run Reports: Customize Report page,
In the File Location section, specify the location where the generated file is to be saved.
In the Location section, choose whether to restrict the report to return results only for a specific location. If you choose to, select the site, list, or library.
In the Date Range section, optionally identify start and end dates and times to which to restrict the report audit details displayed.
In the Users section, optionally select a specific user that report details are to be restricted to include.
In the Events section, optionally specify whether to restrict the types of activities the report is to include. Selectable activities include the following:
Opening or downloading documents, viewing items in lists, or viewing item properties
Editing items
Checking out or checking in items
Moving or copying items to another location in the site
Deleting or restoring items
Editing content types and columns
Searching site content
Editing users and permissions
Editing auditing settings and deleting audit log events
Workflow events
Custom events
Click the OK button.
The report is generated and placed in the identified save location. Reports available from the View Auditing Reports page include the following:
Content Activity Reports
Content Viewing: Lists logged events for viewing content in the site.
Content Modifications: Lists logged events for changes to site content, including documents, list items, and pages.
Deletion: Lists logged events for content deletions and restorations.
Content Type and List Modifications: Lists logged events for modifications to content types, lists, and libraries.
Information Management Policy Reports
Policy Modifications: Lists logged events related to creation and use of content information management policies.
Expiration and Disposition: Lists logged events related to expiration and disposition of content.
Security and Site Settings Reports
Auditing Settings: Lists logged events related to changes made to auditing settings.
Security Settings: Lists logged events related to SharePoint security configuration settings.
Custom Reports
Run a Custom Report: Lets you create a custom report to retrieve logged events for specific actions.
Popularity and Search Reports
You can run popularity and search reports for a site collection . These reports give general site usage and search usage details needed to understand usage trends in the environment. The reports open in Microsoft Excel. To run usage and search reports, do the following:
Navigate to the root site in the site collection where you want to run the reports.
On the root site’s home page, select the Site Settings option from the Settings menu.
On the Site Settings page, select the Popularity and Search Reports link in the Site Collection Administration section.
On the View Usage Reports page (see Figure 13-3), click the name of the report to run.
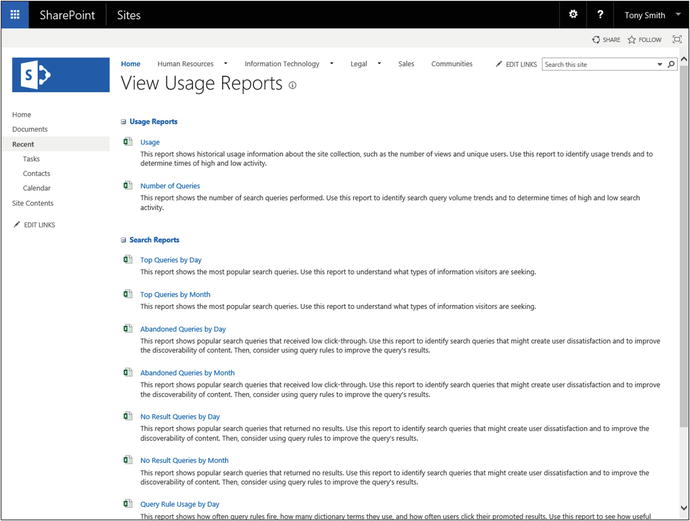
Figure 13-3. View Usage Reports page
In the Open or Save browser message window, click the Open button.
The selected report opens in Excel.
Usage Reports
Reports that can be run from the Usage Reports page fall into two categories. The first includes Usage reports, which provide general environment usage details. They are as follows:
Usage: A Usage report lists general site collection usage statistics (see Figure 13-4), including details of daily and monthly usage traffic volume. Both of these report types list and graphically represent hit and unique user access totals. Hits are accesses made, regardless of who made them. Unique users are distinct individuals who accessed the resources.
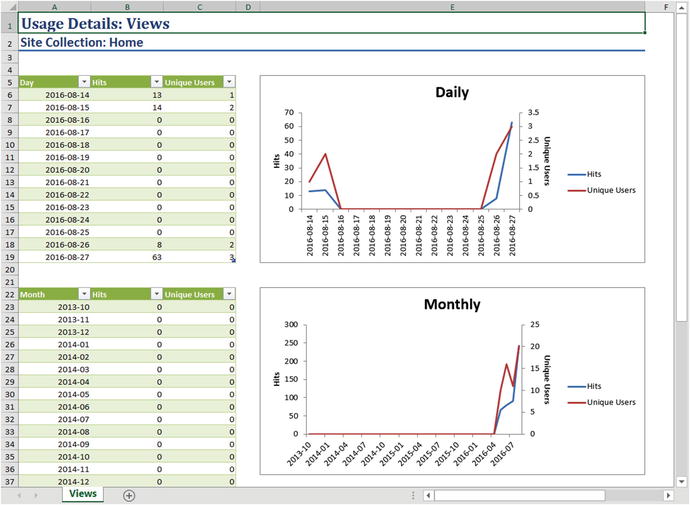
Figure 13-4. Usage report
Number of Queries: The Number of Queries report counts the search queries executed in the site collection by day and by month. Information appears in both tabular and chart format, in a layout similar to a Usage report’s.
Search Reports
The second report category on the View Usage Reports page is the Search Reports category. It includes statistics related to search queries executed in the site collection.
Top Queries by Day: Lists the most common search queries executed per day. The report file is organized as multiple Excel tabs, each tab listing the top query details for a day. This report shows the following details:
The result source of the query
The actual query executed
The total times the query was run within the day
The percent of query executions the query represents
Top Queries by Month: Lists the most common search queries run per month. Like the Top Queries by Day report, the Top Queries by Month report is organized into multiple Excel tabs, each tab representing a single month. This report lists the following details for each listed query:
The result source of the query
The actual query executed
The total times the query was run within the month
The percent of query executions the query represents
Abandoned Queries by Day: Lists the most frequently executed queries where a result was not selected. With this report’s details you can identify queries that might require query rules or other search adjustments to help users locate desired results for the query. For example, if you notice people are running queries to find "tax bundles" and not getting appropriate results, you might create a query rule identifying a file type for tax bundles or a result source identifying where tax bundle materials are located. This report includes a tab for each day that lists queries run but for which no result was selected. Details listed for the queries include the following:
The result source of the query
The actual query executed
The total times the query was run within the day
The percentage of times the query was run in the week without a result being clicked
Abandoned Queries by Month: Provides the same details the Abandoned Queries by Day report does but has a tab per month with abandoned query totals for the given month. Details listed in the report include the following:
The result source of the query
The actual query executed
The total times the query was run within the month
The percentage of times the query was run in the month without a result being clicked
No Result Queries by Day: Lists queries executed for which no results were returned. Like the Abandoned Queries reports, this report can be used to identify queries that may need query rules or result sources defined. The No Result Queries by Day report lists the following details:
The result source of the query
The actual query executed
The total times the query was run within the day
The percentage of times the query was run in the week with no results returned
No Result Queries by Month: Lists queries executed each month for which no results were returned. This report, organized into a tab per month, lists the following details for the queries performed in the corresponding month for which no results were returned:
The result source of the query
The actual query executed
The total times the query was run within the month
The percentage of times the query was run in the month with no results returned
Query Rule Usage by Day: Lists query rules configured in the environment in order to show how many times rules were triggered by search queries each day. The statistics for each day appear on separate tabs in the report. The details for the query rules included in the report are the following:
The result source of the query
The query rule
The container (owner) in which the query rule is configured
The type of object in which the query rule is configured
The number of dictionary terms included
The number of times the query rule was executed during the listed day
The promoted result details configured as part of the query
The number of times the promoted result item was clicked in the search results during the day
The percentage of times the promoted result was clicked based on the number of times the query rule was executed during the day
Query Rule Usage by Month: Gives details broken down by month of how many times executed search queries triggered rules configured in the environment. Monthly statistics, organized on separate Excel tabs, include the following:
The result source of the query
The query rule
The container (owner) in which the query rule is configured
The type of object in which the query rule is configured
The number of dictionary terms included
The number of times the query rule was executed during the listed month
The promoted result details configured as part of the query
The number of times the promoted result item was clicked on the search results during the month
The percentage of times the promoted result was clicked based on the number of times the query rule was executed during the month
Site Popularity Trends
Each site in a SharePoint Server environment is able to run a Popularity Trends report. This report summarizes access statistics, or popularity, for the site. The report contains details similar to those in a usage report for the site collection (discussed in an earlier section). As Figure 13-5 shows, the site usage report lists details, in both tabular and graphical format, of hits and unique user access by day and by month for a given site.
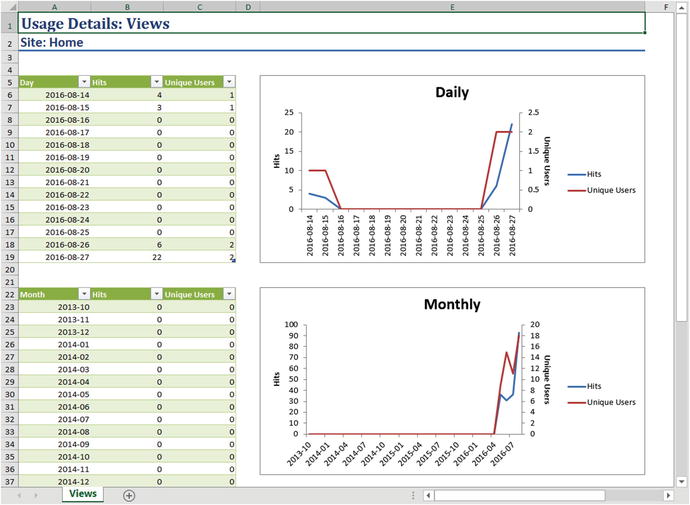
Figure 13-5. Site Usage Details report
To access the Site Usage Details report for a desired site, do the following:
Navigate to the site where you want to run the report.
On the site’s home page, select the Site Settings option from the Settings menu.
On the Site Settings page, select the Popularity Trends option from the Site Administration section.
On the View Usage Reports page, click the Usage report form the Usage Reports section.
In the web browser Open or Save message box, click the Open button
The Usage Details report for the site opens in Excel. It lists overall site access details broken down by day and by month. For each of the days and months listed, hit and unique user summary details are provided.
Library Most Popular Items
Since SharePoint tracks usage of items in libraries, it gives you the ability to understand which resources are accessed most often. To view usage details for a library, do the following:
Navigate to the library where you want to view usage details.
On the library view page, select the Most Popular Items option from the Library ribbon tab.
You are brought to the Most Popular Items page for the selected library (see Figure 13-6).
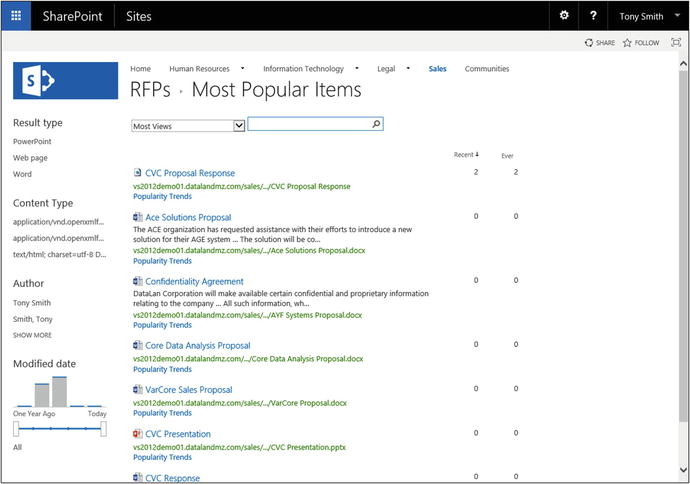
Figure 13-6. Most Popular Items details
This page lists the items contained in the library and sorts them by placing the most recently accessed materials at the top of the list. You can organize the information for viewing in any of three different content access groupings:
Most Views: The default option; items are ordered by most to least viewed. This view has two separate statistics. The first lists the number of recent views, and the second lists the total number of views.
Most Views by Unique Users: Lists recent and overall view counts based on access to the item by unique individuals.
Most Recommendation Clicks: Lists items with both recent and overall access based on the items’ usage patterns.
You can filter information displayed in the Most Popular Items views based on search criteria entered in the page’s search box. You can also directly open a listed item’s Usage report by clicking on the Popularity Trends link accompanying the item.
Document Popularity Trends
You can view Usage reports for individual documents in SharePoint to understand a specific item’s access trends. An item’s usage details summarize access to the document over time, including both overall hit details and unique user accesses. As is true of many of the Usage reports described earlier, the document usage details are presented as an Excel-based report showing both daily and monthly access summaries for the item (see Figure 13-7).
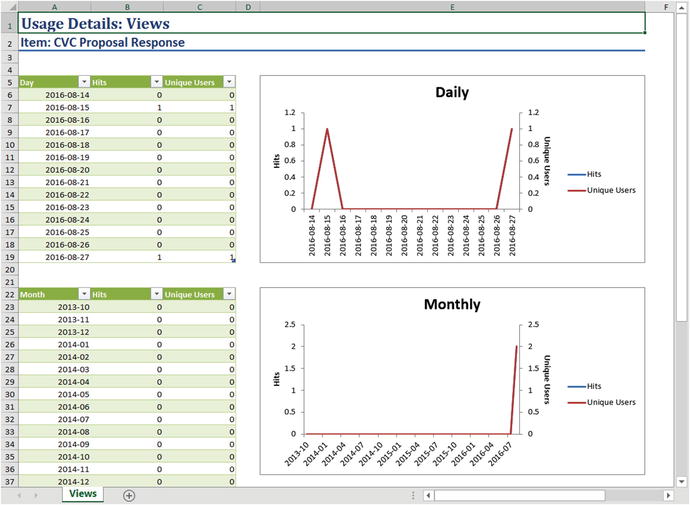
Figure 13-7. Document Usage Details report
To access the Usage Details report for a document, do the following:
Navigate to the library containing the item whose usage details you want to view.
On the library view page, click the check box next to the document to be viewed and select the Popularity Trends option from the Files ribbon tab.
On the Open or Save message box of the web browser, select the Open option.
The Usage Details report for the item opens in Excel.
Summary
In this chapter, we provided a overview of the reporting available in SharePoint 2016. We discussed the storage, usage, and search metrics that provide critical performance and usage information. In the next chapter, we will discuss the Microsoft Office integration capabilities that can be used with SharePoint to enhance team productivity.