
Chapter 11
Advanced optical network architecture for the next generation internet access
C.A. Kyriakopoulos*
G.I. Papadimitriou*
P. Nicopolitidis*
Abstract
Optical networks provide fast, efficient, and reliable access to clusters of end users, and at the same time can guarantee the quality of service. A novel access optical architecture is presented that takes advantage of the latest developments in access networks, utilizes high bandwidth, and scales according to its served customers. Penetration, scalability, geographical and population studies are conducted to ensure it fulfills its purpose. Prediction and aggregation of traffic data are studied along with the proposed architecture to expand the exploitation of its capabilities. Finally, a new bandwidth allocation method is presented that is tuned to provide performance under this network architecture.
Keywords
optical access networks
xg-pon
panda
dba
traffic prediction
1. Introduction
1.1. Convergence to the digital communication age
Heading to the modern age, city authorities have to adjust the local structure of communications to achieve speed, quality, low energy consumption, and consistency. Traditional structures cannot satisfy the late hunger for instant communication and transfer of a huge amount of data, for example, video streaming.
Smart cities of the future [1] will be based upon digital technologies to reduce costs and resource consumption. The performance of data transfers between interconnected parts of the city can increase when it is based on a next generation optical network that offers high data rates and low error rate. The efficiency of communications can boost productivity and at the same time, communications will avoid the hurdle of long and different geographical distances that are impeding quality of service (QoS). It is important for a network architecture to be consistent and deployed throughout the city, so issues about interoperability and compatibility are avoided.
Maintaining and extending old communication structures cannot be a goal to confront the foreseeable future. The cost of maintenance increases as equipment gets old and not being produced abundantly. Also, experienced personnel lacks knowledge of legacy technologies that are being replaced constantly by manufacturing plants. Customer needs for higher throughput and more efficiency leaves no alternative choice than the adoption of a network architecture that is scalable, efficient, provides instant access and fulfills the promise of the 2020 European agenda.
A new network architecture [2] will be described in this chapter that is suitable for providing internet access and intercommunication to the end users, overcoming interoperability issues and offering high available bandwidth to fulfill connectivity needs for the years to come. Also, methods that aggregate and predict traffic that can coexist with the new architecture will be described in detail. These methods offer better resource utilization, leading to higher network throughput or lower energy consumption [3], according to current customer needs.
1.2. Introducing the PANDA architecture
A passive optical network (PON) is a telecommunications network that uses point-to-multipoint logical connections in which passive optical components such as splitters are used to enable a single optical fiber to serve multiple end points. A PON consists of an optical line terminal (OLT) which is located at the service provider’s central office (CO) and a number of optical network units (ONUs), shared by end users. A PON reduces the amount of fiber, CO equipment and cost in general which is required compared to point-to-point architectures. A PON is a type of a fiber-optic access network. In most cases, downstream signals are broadcast to all end users sharing multiple fibers. Encryption is used to prevent eavesdropping. Upstream signals are transferred using a multiple access protocol, based on time division multiple access (TDMA).
The main part of the proposed PANDA architecture [2] that will be described in this chapter consists of a PON. This type of network was chosen due to the high bandwidth it is able to offer by using wavelength division multiplexing (WDM) [4] in the optical domain and at the same time, low error rate and consistency. Up to 10 Gbps are available to downstream traffic (data that end-users receive depending on the configuration and originate from the backbone network topology) and 1 or 2 Gbps (also depending on the configuration) are available to clusters of end users (since fiber to the curb architecture—FTTC is present) for upstreaming data. Upon this network topology, techniques for aggregating and predicting traffic data [5] are applied to increase performance, availability, and all other important metrics.
The last mile from a home to the curb consists of conventional DSL connectivity, so there can exist compatibility with preinstalled network equipment. It is still far away from the era with full optical connectivity being available. At the point of aggregation of end user data that begin from a city block, resides an ONU. This is the component where signal conversion from electrical to optical takes place. When the signal enters the optical domain, it gets transferred to the OLT, that is, part of CO and then to the optical backbone network. In case the last-mile architecture was replaced by an all-optical network, the cost of deployment and maintenance would increase to a point where the performance benefits would be shadowed and this would not be a viable candidate solution.
The main idea of the PANDA architecture (Fig. 11.1) is based on a modern optical network for transferring data from city blocks to the backbone and vice versa. Due to preexisting (preinstalled) access equipment and the high cost of replacing it with similar optical equipment, the last mile that connects end-users to the optical network is based on conventional DSL copper equipment. Since the optical network does not impose any type of bottleneck to the end users, they are able to achieve high bandwidth utilization according to their configuration. Also, this architecture of providing access to the end users is compatible with the directions of the European 2020 Agenda.
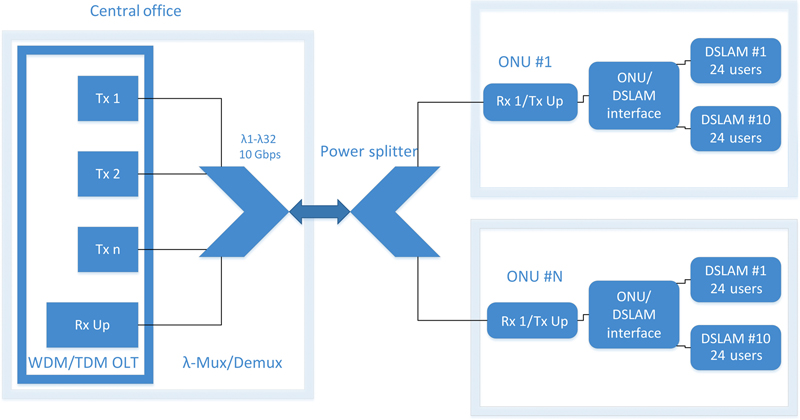
Figure 11.1 PANDA Architecture
1.3. Increasing performance with traffic aggregation and prediction
The PANDA architecture can undergo performance improvement when it is combined with advanced traffic aggregation and prediction strategies [6]. Modern network architectures must be able to create space for performance improvement when a higher layer of computation logic can take advantage and exploit the physical layer possibilities in an advanced way. Since the physical layer of PANDA is considered an advanced platform [2] and is able to serve user- needs for the years to come, it is candidate for being used by higher layer algorithms.
Traffic prediction is another important aspect that paves the way for further performance improvement, either at the backbone or access network. Backbone networks benefit from efficient routing, better resource utilization or low energy consumption, among others. Access networks undergo improvements during dynamic bandwidth allocation (DBA) [7] from the CO structure to its connected ONUs. The importance is obvious when a part of the network that can accurately predict traffic for a large time span, to be able to efficiently preallocate resources aiming at decreasing performance metrics like the average data-serve delay or power consumption.
A node is able to accumulate traffic that originates from different sources and heads to different destinations. Traffic aggregation serves the purpose of grouping data that share a common trait such as a QoS parameter. Network performance improves, for example, better bandwidth utilization, when packets are transferred as groups. When it comes to access networks like PANDA, an ONU accumulates data that originate from different DSL users and forwards them to the backbone network through the CO. This procedure improves when advanced aggregation techniques apply.
Four categories of data-aggregating methods [8] will be analyzed later in this chapter. These methods relate to parameters such as the size of the burst or the time window of the aggregation. Depending on a specific aim of performance improvement, the algorithms consider an aforementioned parameter as the main focus and develop accordingly. Also, the basic models of traffic prediction that fit into the PANDA architecture will be introduced.
2. PANDA architecture
2.1. VDSL enduser access
The main standard that connects end-users to their respective ONU is VDSL2, and from cabinet to the OLT there is a PON with 10 Gbps downstream and shared upstream of 1 or 2 Gbps (depending on the configuration). The point of transition between the two types of networks consists of 48-port VDSL2 DSLAMs and the target deployment is FTTC. There are also Ethernet aggregators of 1 or 2 Gbps that aggregate upstream traffic. Usually, these aggregators act as a broadband access switch inside the cabinet which multiplexes traffic from up to 16 DSLAMs through single or double GbE links. The aggregator consists of a 10 GbE multiplexed uplink to the optical MAC unit (ie, ONU) which interfaces the cabinet with the main PON [2].
2.2. Multiwavelength passive optical network
The PON physical layer standard is the XG-PON [9] that demonstrates data rates up to 10 Gbps. The CO uses 16–32 wavelengths, each capable of carrying the aforementioned rates. The optical network (Fig. 11.2) terminates on the ONU, an optical subsystem that interconnects the PON with the Ethernet aggregator at the VDSL side of the network architecture. Wavelengths are passively routed over the optical infrastructure. Two deployment scenarios are utilized according to the distance between the CO and the ONUs: (1) under urban environment and when distances are limited, a power splitter is used at remote nodes (RNs). There is multicasting stemming from the OLT—with every ONU receiving all wavelengths- of data. When a frame is transferred to the destination, the respective ONU filters out all the wavelengths targeting different ONUs and keeps the data of its own. The side effect of this procedure is that the power is split according to the number of ONUs, creating extensive losses. So, limiting the distance is important for having small propagation losses. (2) When long distances are introduced, a demultiplexer is used instead of a splitter. That way, every ONU only receives its own wavelength and the reach is extended significantly. No additional filtering is required at every destination.

Figure 11.2 Fully Multiwavelength Architecture
On the other hand, all ONUs share a common wavelength for upstreaming data. This is the case because if multiple wavelengths were allowed, tunable or multiwavelength sources would have been required at every ONU, increasing the network cost and complexity. Several upstream wavelengths render bandwidth allocation a challenging task. The CO dynamically allocates bandwidth (ie, DBA) to avoid collisions between ONU transmissions over the shared segment of the network. Typical DBA algorithms are designed to work efficiently when a single wavelength is shared among the ONUs [10].
2.3. The MAC layer
There are many similarities of the MAC layer (Fig. 11.3) to XG-PON [9]. A single wavelength is utilized for both downstream and upstream traffic. In XG-PON, a time slot lasts 125 μs and includes a number of frames. The nature of the logical topology depends upon passive equipment, so every downstream frame is broadcast and chosen from the destination ONU according to its embedded XGEM identifier [9]. In other words, every ONU inspects all broadcast frames and keeps the one that targets itself as destination.

Figure 11.3 The MAC Layer
Among the similarities (frame duration, XGEM structure, etc) there are also subtle differentiations, since the downstream procedure is not truly broadcast. There are two implementation options in the physical layer (passive splitter or WDM) that actually offer a point-to-point downstream connection between the CO and ONUs and if the XGEM identifiers are absent, the CO includes an additional subsystem that assigns frames to ONUs on the basis of their wavelength, as shown in Fig. 11.3. From a practical perspective, the frame to wavelength mapping can be extracted from the (XGEM identifier, ONU, wavelength) triplet at the CO. Moreover, if the XGEM frame structure is maintained, the XG-PON ONUs are fully compliant with PANDA in the downstream direction.
The fact of using a single wavelength to upstream data, makes PANDA compatible with XG-PON in this data direction. So, the ONUs structure their upstream data in bursts and the CO is responsible for allowing to transmit them according to a schedule (also called Dynamic Bandwidth Assignment). During this procedure, the CO ensures that there is not overlapping of upstream frames at the single wavelength connection between itself and the main splitter (or WDM according to each implementation). There are two ways for the CO to be aware of ONU bandwidth requirements: (1) explicitly through received reports and (2) by inspecting the amount of empty upstream frames. According to these actions, it is able to apply a sophisticated algorithm for achieving better resource utilization of the network.
2.4. Lines rates and poplation coverage
The actual line rates PANDA achieves during operation (Table 11.1), depend on the number of end-users and DSLAMs. The maximum number of DSLAMs per ONU is 48. End-users connect to their respective DSLAM with speed of 21, 42, or 83 Mbps. Traffic from each ONU to the OLT is carried with a predefined wavelength and its rate equals to 1 or 2 Gbps. On the other hand, downstream traffic is carried with a wavelength of 10 Gbps rate. The optical segment of the network doesn’t impose any type of bottleneck to any DSL user, so the latter is able to exploit the full specifications of its service contract.
Table 11.1
Attainable Rates and Total Users
| D/S per ONU (Gbps) | Wavelengths | Users per DSLAM | U/S per ONU (Gbps) | DSLAM Uplink (Gbps) | DSLAMs per ONU | Users | D/S per User (Mbps) | U/S per User (Mbps) |
| 10 | 16 | 24 | 10 | 1 | 10 | 3840 | 42 | 2.60 |
| 10 | 16 | 48 | 10 | 1 | 10 | 7680 | 21 | 1.30 |
| 10 | 16 | 24 | 10 | 2 | 5 | 1920 | 83 | 5.21 |
| 10 | 16 | 48 | 10 | 2 | 5 | 3840 | 42 | 2.60 |
| 10 | 32 | 24 | 10 | 1 | 10 | 7680 | 42 | 1.30 |
| 10 | 32 | 48 | 10 | 1 | 10 | 15360 | 21 | 0.65 |
| 10 | 32 | 24 | 10 | 2 | 5 | 3840 | 83 | 2.60 |
| 10 | 32 | 48 | 10 | 2 | 5 | 7680 | 42 | 1.30 |

The upstream user rate depends on the number of ONUs and the number of users per ONU. The number of wavelengths equals to 16 or 32 and the number of ONU users reaches 120, 240, or 480, depending on the DSLAM configuration. So according to these data, user speeds range from 0.65 to 5.15 Mbps which is typical for an asymmetric protocol that promotes downstream rates. In case only one user shows activity, the peak can reach 50 Mbps.
The total number of users that PANDA architecture can serve is determined by the number of ONUs and the number of users per ONU. The inference that can be drawn from the two tables is that the number of users, ranges from 1920 to 15360, all connected to a single CO.
2.5. Extensions
The actual numbers of Table 11.2 show that PANDA is capable of serving thousands of DSL users, each one of them communicating with speed range of 21–100 Mbps. This is a viable situation concerning short to midterm connectivity needs. Possible extensions of the proposed architecture are useful for rendering it viable for long term user coverage, extending its scale and scope.
Table 11.2
Line Rate and Population Coverage
| Wavelengths | Users per ONU | Users | D/S per User (Mbps) | U/S per User (Mbps) |
| 16 | 50 | 800 | 200 | 12.5 |
| 16 | 25 | 400 | 400 | 25.0 |
| 16 | 17 | 267 | 600 | 37.5 |
| 16 | 13 | 200 | 800 | 50.0 |
| 16 | 10 | 160 | 1000 | 62.5 |
| 32 | 50 | 1600 | 200 | 6.3 |
| 32 | 25 | 800 | 400 | 12.5 |
| 32 | 17 | 533 | 600 | 18.8 |
| 32 | 13 | 400 | 800 | 25.0 |
| 32 | 10 | 320 | 1000 | 31.3 |

Taking advantage of VDSL bonding-vectoring that can extend access to several hundreds of Mbps or point to point optical ethernet, PANDA is able to offer end-user access up to 1 Gbps. Since there is not any type of bottleneck and users can reach the nominal speeds, the limits of the proposed architecture are depicted in Table 11.2. These numbers show that 1600 PANDA users in a CO can benefit of 200 Mbps speed, but when the speed reaches 1 Gbps, their number declines to 320.
Table 11.2 shows the clear trade-off between the minimum guaranteed rates and the number of users in PANDA, considering the upper bandwidth wavelength limit being 10 Gbps. Under these circumstances, extending the number of users requires more wavelengths and more than one ONU per cabinet. This leads to a linear growth of the user-number, that is, 128 wavelengths can feed 1280 users under 1 Gbps speed. This situation breaks compatibility with the XG-PON standard since advanced DBA methods have to be utilized, that are specifically designed for this type of optical network.
Another option is to employ more than one COs, allowing many layers of PANDA to operate simultaneously. Included in pros is that this method attains the same number of end users, offers better upstream data rates and extensively reuses current optical fibers. On the other hand, extensive wavelength planning is required and a combination of waveband demultiplexers, WDMs, and passive optical splitters.
2.6. Scalability study
There are three main scenarios that have been studied under the scalability perspective:
• Provision of at least 30 Mbps to 50% of the connected end-users and at least 10 Mbps to the rest. This case assumes the penetration of 52 Mbps VDSL access to half of active connections.
• Provision of at least 30 Mbps to all users. This case assumes that there is full VDSL penetration to access users.
• Provision of 100 Mbps to 50% of the users and 30 Mbps to the rest. This case assumes the introduction of VDSL profile 17a with cross-talk cancelations.
The first case is a short-term solution where the aggregated rate at the ONU site is less than 5 Gbps, that is, at least two ONUs can be grouped together under the same wavelength channel. A grouping of eight ONUs is possible using the same wavelength. There is decrease to four ONUs for the case of 30 Mbps connectivity and to two for 100 Mbps. These data are valid for urban access which is the most widespread access scenario.
A medium-term scalability scenario assumes penetration rate of 75% which is the current status quo in most European areas. The grouping factor of ONUs per wavelength is half in comparison to the short-term scenario, that is, 4, 2, or 1 ONU per wavelength is required respectively for the cases of 30 Mbps to 50% of users, 30 Mbps to all users and 100 Mbps to half of users. The last case is realized with one wavelength per ONU. In practice though, it is observed that the aggregated rate ranges from 6.8 to 7.6 Gbps which leaves spare bandwidth to the 10 Gbps upper limit per wavelength. This allows further extension of the user number.
The long term scalability scenario is the predicted by European 2020 agenda and assumes full penetration. The grouping factor remains the same as in the previous case, but single wavelengths are utilized 100% (all 10 Gbps each one offers). The aggregated traffic of this scenario ranges from 8.9 to 10.1 Gbps, considering 100 Mbps access rate per user.
2.7. Geographical study
The distribution of users in four different areas is considered as basis for a geographical study, according to the characteristics of a copper-based distribution network. These areas are (1) dense urban, (2) urban, (3) suburban, and (4) rural. This study (Table 11.3) denotes that—using profile 17a—downstream and upstream rates of 100 and 50 Mbps respectively can be achieved.
Table 11.3
Geographical Coverage for Different Data Rates
| Nominal Rate (Mbps) | Convergence Distance (m) | Coverage for Different Areas | Total Coverage (%) | |||
| Dense Urban (%) | Urban (%) | Suburban (%) | Rural (%) | |||
| 100 | 150 | 98.4 | 86.0 | 19.1 | 37.7 | 80.20 |
| >80 | 500 | 100 | 100 | 96.1 | 85.1 | 99.30 |
| >50 | 900 | 100 | 100 | 100 | 87.9 | 99.88 |
| >30 | 1200 | 100 | 100 | 100 | 88.9 | 99.89 |

A large set of representative areas was used to produce the average values. Real customer rates will be reduced due to crosstalk effects, impairments of line, quality and number of connections. All customers are able to achieve nominal rates in dense urban areas and 80 Mbps in urban areas, though all of them can peak at 100 Mbps. In suburban and rural areas, connectivity drops at 19.1% and 37.7% respectively. This is due to the distance from the RN most users undergo. DSL attenuation is tightly correlated to the distance increase. The main inference is that the majority of users can achieve nominal rates. There is also a small percentage of 11.1% in rural areas that is not capable to achieve rates higher than 30 Mbps.
The geographical coverage results can be found in Table 11.3. By observing the right column (percentages of coverage in respect to the total number of subscribers), almost all users can achieve nominal rates of 80 Mbps and 80% of users are served with the peak rate of 100 Mbps. So, the PANDA architecture in combination with the advanced VDSL2 (profile 17a) standard, is fully scalable and extends beyond the standards set by European Union for the Agenda 2020.
3. Aggregation and prediction of traffic
3.1. Introduction
One of the main goals of Traffic Prediction as a concept is the ability to predict the short-term bandwidth requirements [11] while the network is operating. DBA benefits the most from prediction since the upstream channel is shared fairly (according to applied policies) among ONUs taking into account their current bandwidth requirements, avoiding that way empty time windows that increase the average delay time in their data queues. This is the case because the OLT that is responsible for the bandwidth allocation, is able to predict future requirements on behalf of ONUs and distribute it more efficiently and fairly. This type of prediction can be applied at the PON side, that is, after the backbone network topology and before the DSL access architecture. Clusters of users that belong to specific ONUs, benefit from the decrease of their latency metrics.
The prediction of future traffic fluctuations with increased accuracy [12], is an important task for future networks. Accuracy is related to a specified time window of prediction and usually, as the window size increases the accuracy decreases. So, it is important for a traffic prediction method [13] to be able to function properly with as much accuracy as possible, on a large window size. This large window size helps in taking better decisions at the operator’s side. On the other hand, minimizing the error of prediction assists in taking the right decisions that boost network’s performance. In practice, there is no linear correlation between accuracy and time window size—accuracy decreases disproportionally as prediction’s window size increases.
Another aspect is the amount of network resources that are reserved for minimizing the uncertainty of prediction. The windows size is also correlated to the ability of network’s administration and operation. Traffic characteristics that are captured from measurements are fed to the prediction model and drive its performance. The way these characteristics accumulate has also an explicit impact to accuracy [12].
Efficient traffic aggregation [14] is important at the CO premises. Aggregated data from ONU upstream traffic will eventually be routed to the backbone optical network, so prediction is important to ease the process, for a traffic aggregation scheme such as optical burst switching (OBS) [15]. This scheme, for example, is based on aggregation of data at backbone network nodes that will be send to a destination node, remaining entirely in the optical domain during the transfer. A control packet will be initially dispatched to the destination, just to create the array of lightpaths that will carry the burst along the path. So, the basic traffic aggregation schemes that can co-exist with PANDA will be presented as well.
The next section of this chapter will elaborate on the main principles of traffic aggregation and prediction schemes.
3.2. Traffic analysis and prediction
The definition of traffic prediction [16] is based on a continuous time stochastic process  , where μ is the mean rate and X(t) is a random process having continuous integrated spectrum and zero mean. This is the input signal to the predictor and the output is
  which uses τ as the prediction interval. The error cannot be higher than 20% and is provided by the normalized τ-step predictor.
 (11.1)
The maximum prediction time window is provided by
Where ɛ is the percentage of the error, with probability Pɛ and specified prediction confidence interval (Pɛ, ɛ).
A high MPI value with the error being inside the confidence interval, means that the prediction in this case is preferable due to the ability to ease the network operating procedure  (Fig. 11.4).
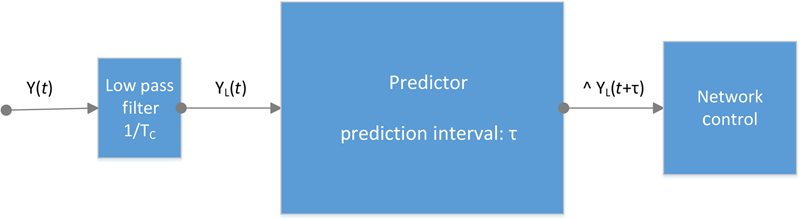
Figure 11.4 Traffic Prediction
Gaussian processes are usually utilized to approach network traffic characteristics, especially in backbone networks where the concentration of a high number of data sources explicitly affect their performance. The ARMA prediction model is utilized for detecting the statistical properties that define predictability and also to analyze traffic aggregation. According to the Wold decomposition theorem, a static Gaussian process can uniquely be represented [16] by a moving average of static Gaussian white noise n(t).
Where hu is a real number function of u with a given real process Y(t). According to Kolmogorov, the τ-step predictor is represented by a static Gaussian property.
The variance is expressed by the following formula.
The MPI, when C = σ/μ, is provided by
 (11.6)
Where
 (11.7)
The circular Markov-modulated poisson process (CMPP) [16] is used for confronting real network traffic traces. This model not only captures second grade statistical data as ARMA, but also first grade which also cannot be distributed under Gaussian. This model performs well in queue analysis.
The traffic rate in CMPP is  and there is a circular transition two-dimension array Q. According to Markov properties, the most efficient predictor is
 (11.8)
Also, MPI equals to  , with
 (11.9)
There are also adaptive traffic prediction models that are based on training and are categorized in two sets. The first set is used to detect the parameters of the prediction model. The second set is dedicated to the evaluation of data and is used to compare the prediction data with actual ones, aiming at the extraction of conclusions about predictor’s performance.
The prediction model works for every input at timestamp t – 1, calculating the corresponding  . The input is fed with previously recorded values like y(t−i) for every variable that is calculated at t−1 timestamp.
During training, which is the phase of model parameters’ detection, the set of data is entered as input into the algorithm. The set of training data consists of input and output values. The algorithm estimates the model parameters which provide the minimum error between outputs and real traffic values.
At the prediction phase, the input is only fed with estimation data to predict the value of . The main criterion that is used for evaluating the validity of prediction values is the root mean square error (RMSE).
 (11.10)
The real output is y(t) and the estimated is . The number of input data is n. Then, RMSE calculates the error between the real values that have been recorded and the estimated ones [5] (Fig. 11.5).
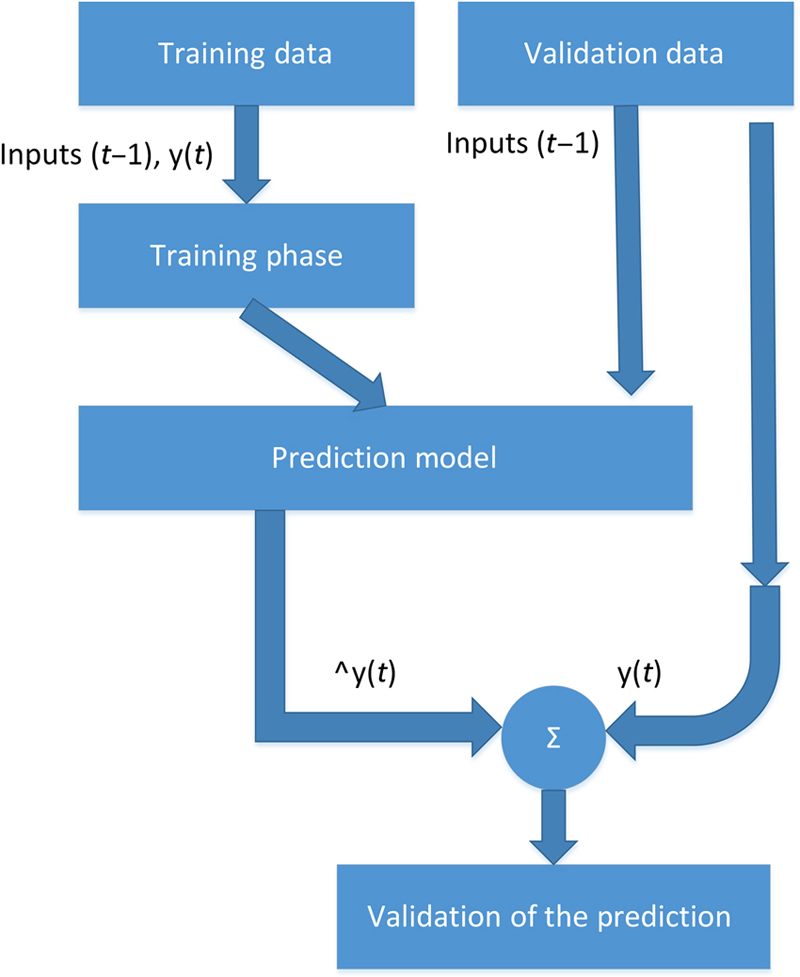
Figure 11.5 Training Model
3.3. Traffic aggregation strategies
Data can be transferred as bursts inside a backbone optical network. That way, performance increases as was shown in related research [15]. A lot of algorithms have been proposed to aggregate data at the nodes of the network and most of them preserve local queues for the accumulation of data that originate from different sources, according to their destination or the requirements of QoS. The algorithms select a number of packets from their queues and send them as bursts to the destination node. Two parameters that are essential for the aggregation is size and time. According to these values, the collection completes and the transmission procedure initiates. These algorithms are classified into four categories [8] (Fig. 11.6).
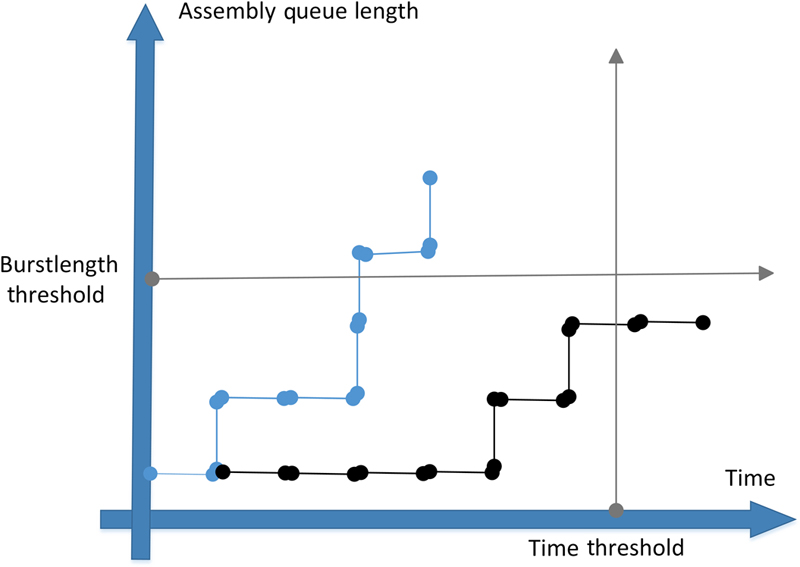
Figure 11.6 Burst Assembly Based on Time and Queue Length
The first category includes algorithms that are based on time with a threshold T being the completion criterion of the aggregating procedure. At the same time, there is a lowest limit of size Bmin (padding can be used if necessary). The second category includes algorithms that are based on the size of the burst and when this reaches a predefined value, the transmission of the burst initiates. There are pros and cons in the first two categories. An algorithm that is based on the size, does not have time limit, so it is possible when the network load is low to delay the transmission, resulting in degradation of performance. If it is based on time and the network has high load, the average delay increases with negative impact to network’s performance.
It is essential for an algorithm to be able to be executed with acceptable results under all conditions. This is the basic idea for a third category which combines the first two. It uses three thresholds: time, size and the minimum burst size. The fourth category is based on the dynamic adjustment of these thresholds, either when it correlated to time or size. These algorithms are adaptive to the current network traffic which is recorded from measurements during its operation. The side-effect of these methods that belong to the last category is the increase of complexity during the prediction and estimation of thresholds.
Given the fact that algorithms that are based on time and the size of the burst, aggregate packets they receive inside a predefined time window, the use of an electronic buffer is a prerequisite. This procedure changes the characteristics of traffic from packet to the burst level. For the multidimensional understanding of an OBS network, the aggregation procedure must be analyzed. In case this procedure follows a Poisson distribution which has exponentially distributed arrival times and the size of packets is constant, the distribution of burst size can be calculated as follows.
 (11.11)
That way there is approach of a Gamma distribution and when T/μ is large, of a Gaussian with average PE[np] and variation P2E[np]. The number of included packets in a burst can be constant when the packet size P and the threshold B of burst’s length are also constants, and equals to np = E[np] = B/P. Arrival times between packets are random variables, so the times between bursts are the summary of them, following a Gaussian distribution with average μE[np] and variation μ2E[np]. The characteristics of aggregated traffic in a hybrid algorithm (size and time) are correlated to a Gaussian distribution. Using algorithms with dynamic aggregation, the time between arrivals of bursts and also the size, depend on the arrival rate.
Multiple rate aggregation [17] is defined as the data aggregation of multiple optical sources which provide data with different rate and different destinations. In a backbone optical network there are two types of nodes that aggregate data, those that aggregate end-user data from the access network and the rest that aggregate IP flows in a light tree. The main goal is the creation of a light tree set with the maximum aggregation. When an access network receives content from the light trees, it delivers it to the end-users. There is the possibility of multiple-transponder utilization in a backbone router that aggregates data. The transponders at the heads and queues, correspond to roots and leafs of light trees. The transfer rate in a transponder is usually higher that the required of a multiple IP flow, just to avoid any kind of bottleneck.
The requirements in a type of network such as this are: (1) the use of the shortest path for the formation of the light tree, (2) the relation of an IP flow with multiple receivers and the light trees is one-to-many, (3) a multiple IP flow cannot be split into many light trees, (4) transponders in a light tree must be of the same type and (5) intermediate OXC elements lack grooming capabilities.
Finally, the field of energy efficiency [18] in optical networks can benefit from advanced aggregation techniques and statistics that relate to aggregated data. Applying energy-efficient algorithms, nodes are put into sleep mode [19] that have no high impact on traffic aggregation, so energy consumption decreases. Given the fact these idle devices can have impact later during network’s operation, it is important for traffic prediction algorithms to be available for execution.
4. DBA simulation and results
4.1. PANDA DBA structure
DBA is the process of allocating upstream transmission opportunities by the OLT to its connected ONUs. This process is assisted by activity status reporting from the ONUs, or implicitly by the observation of idle XGEM frames at the OLT side. DBA is performed effectively when there is adaptive reaction to upstream traffic, or through short and long term traffic prediction. The benefits that stem from the elaborate and effective bandwidth allocation, allow more subscribers to access the network, consistency in their provided services and at the same time, the transfer of high-quality media data that are encoded with variable bit rate methods.
In conventional TDM-style EPONs, the scheduling procedure [20] relates to the upstream transmissions on the single wavelength channel. In WDM EPONs the DBA procedure is extended to scheduling the upstream transmissions of multiple upstream wavelengths, when supported by the ONUs. In other words, in WDM EPONs the scheduling is related to both the length of the transmission and the wavelength channel it will be fulfilled at. Next, a comparison of two broad paradigms for dynamically allocating grants for upstream transmissions on the different upstream wavelengths will take place, that is, online and offline DBA scheduling.
In an online scheduler, the OLT performs the scheduling of every ONU at the time it receives its corresponding report message. This action indicates that it does not need to carry global knowledge of bandwidth requirements of the other ONUs. A basic online scheduling policy for the WDM PON is the OLT to schedule the upstream transmission for an ONU on the first available wavelength channel, the latter supports. The amount of the bandwidth (ie, the byte length of the granted time window) that is allocated to an ONU can be determined according to any of the existing DBA mechanisms for single-channel PONs.
In an offline scheduler, the ONUs are scheduled for transmission once the OLT has received the report messages from all ONUs, so it can have a global view of all bandwidth requirements the ONUs have and perform their scheduling accordingly. Since there is a single timestamp an offline scheduler makes scheduling decisions for all ONUs at, all of the reports, which are appended to the end of the data payload of a grant, from the previous DBA cycle should be received. This requires that the scheduling algorithm be executed after the OLT receives the end of the last ONU’s gated transmission window. After this procedure, a gap between scheduling grant cycles is introduced, which is dubbed as the interscheduling cycle gap (ISCG). The length of the ISCG on a wavelength channel is equal to the computation time of the grant cycle, the transmission time for the grant and the round trip time (RTT) to the first ONU scheduled on the wavelength in the next round.
Dynamic bandwidth assignment in PANDA is the process by which the OLT allocates upstream transmission opportunities to the traffic-bearing entities within ONUs, based on dynamic indication of their activity and their configured traffic contracts. An ONU can include many different traffic entities that are identified uniquely and fulfill different subscriber services. The activity status indication can be either explicit through buffer status reporting, or implicit through transmission of idle XGEMa frames during the upstream transmission opportunities. In comparison to static bandwidth assignment, the DBA mechanism in PANDA improves the typical XG-PON upstream bandwidth utilization by reacting adaptively to the ONUs’ burst traffic patterns. There are also practical benefits of DBA. Firstly, more subscribers can be added to the access network due to the efficient bandwidth use. Secondly, subscribers can benefit from enhanced services such as those requiring variable rate with peaks and bursty traffic that extends beyond the levels that can reasonably be allocated statically.
In XG-PON (similarly to PANDA), the recipients of bandwidth units are uniquely identified by their Allocation IDs (Alloc-IDs). The semantic behind this scheme is that an ONU can carry more than one Alloc-IDs devoted to different paid services and the OLT treats them according to its enforced policy. Regardless of the number of Alloc-IDs assigned to each ONU, the number of XGEM ports multiplexed onto each Alloc-ID, and the actual physical and logical queuing structure implemented by the ONU, the OLT models the traffic aggregate associated with each Alloc-ID as a single logical buffer and, for the purpose of bandwidth assignment, considers all Alloc-IDs specified for the given PON to be independent peer entities on the same level of logical hierarchy. Every downstream frame contains a BWMap, that is, a data structure which specifies the timing and size of upstream transmissions by the ONUs. The DBA function then provides input to the OLT upstream scheduler, which is responsible for generating the bandwidth maps. Every ONU extracts these data that correspond to its own Alloc-IDs and schedules for transmission data that reside in its corresponding queues.
Dynamic bandwidth assignment in XG-PON encompasses the following functional requirements. These functions apply on the level of individual Alloc-IDs and their provisioned bandwidth component parameters. The XG-PON OLT is required to support DBA. (1) Inference of the logical upstream transmit buffer occupancy status. (2) Update of the instantaneously assigned bandwidth according to the inferred buffer occupancy status within the provisioned bandwidth component parameters. (3) Issue of allocations according to the updated instantaneous bandwidth. (4) Management of the DBA operations.
Depending on the ONU buffer occupancy inference mechanism, two DBA methods can be distinguished: status reporting (SR) DBA is based on explicit buffer occupancy reports that are solicited by the OLT and submitted by the ONUs in response; traffic monitoring (TM) DBA is based on the OLT’s observation of the idle XGEM frame pattern and its comparison with the corresponding bandwidth maps.
The PANDA OLT should support a combination of both TM and SR DBA methods and be capable of performing the aforementioned DBA functions in an efficient and fair manner. The specific efficiency and fairness criteria can be based on overall PON utilization, the individual ONU’s performance, tested against the corresponding objectives, and comparative performance tested for multiple ONUs.
A PANDA ONU should support DBA status reporting, and should transmit upstream DBA reports as instructed by the OLT. The status reporting DBA method involves in-band signaling between the OLT and the ONUs, which is an inherent part of the XGTCb specification. The algorithmic details of how the OLT applies the reported or inferred status information, the entire specification of the traffic monitoring DBA method, as well as the details of the OLT upstream scheduler, which is responsible for the BWMap generation, are outside the XGTC layer scope, and their implementation is left to the OLT vendor.
When QoS is taken into account from the OLT, there is predefined notation from the standard that assists in the DBA process. Every Alloc-ID is connected to a T-CONT (Traffic Container) [21] identifier which defines the type of bandwidth. Type 1 is related to fixed bandwidth and mainly used for services sensitive to delay and with high priority like VoIP. Both T-CONT 2 and 3 are related to the guaranteed bandwidth and mainly used for video and data services of higher priorities. Type 3 also provides surplus bandwidth when it is available. Type 4 is of best-effort type and mainly used for data services such as Internet and services of low priority which do not require high bandwidth.
DBA algorithms that are adequate for use in the 10 Gbit PON standard [9] can also be utilized by the PANDA architecture.
4.2. Proposed FIBO DBA algorithm
The proposed DBA algorithm relies on status reporting by ONUs that is appended at the back of each transmission grant. This info includes the current buffer (queue) size in bytes. The size of this queue depends on arrival rate of new data packets that will be transmitted later as upstream traffic. This info is valuable at the OLT site for improving bandwidth efficiency of the access network. Acquiring this knowledge, the OLT can apply an adaptive and efficient algorithm like the proposed one.
The Offline scheduling by the OLT entity is exploited by the proposed algorithm and it is a prerequisite. Avoiding starvation at the ONU side is achieved by giving the chance for transmission in every DBA cycle, even when there was zero buffer reported earlier. In this case, the lowest transmission size which is 8 bytes is granted, so if there are newly arrived data at an ONU, between the last report and the current time, there will be a time window to ease their transmission. Also, the largest grant scheduling policy is applied. This means that when the grant sizes are decided based on policy for the next cycle, a descending sorting will take place.
Since the traffic characteristics vary through time, there is need for DBA methods that can adapt to them. That way, performance improvement is feasible. When traffic data don’t undergo extreme fluctuations as in constant bit rate (CBR), the DBA methods don’t need to provide flexibility because they demonstrate acceptable performance. On the other hand, when the traffic is bursty, it is important for the method to adapt as fast as possible to fulfill the bandwidth requirements.
The proposed algorithm in Fig. 11.7 exploits this idea by using a sequence of Fibonacci numbers (every number in this sequence equals the sum of its two predecessors) to provide the required bandwidth. When the new bandwidth requirement is higher than the last served one for a specific Alloc-ID, a pointer increases its position and points to the next number of the sequence. When it is lower, the opposite happens. The number the pointer points to, is used as a multiplier for the default grant size. That way, when the traffic rate decreases, the pointer points to the first few Fibonacci numbers. When it increases, it points to the last numbers, providing higher grant sizes. The distances between the last numbers of the sequence is higher than the distance between the first numbers. So, when a burst suddenly arrives and disappears, there is fast adaptation to the high bandwidth demand and then fast adaptation to the low bandwidth demand that follows next.

Figure 11.7 The FIBO DBA Activity Diagram
The fast adaptation is feasible due to the differences the Fibonacci numbers have. For example, in the sequence 1, 1, 2, 3, 5, 8, and 13, the transition from the first numbers to the last is not linear and the same applies to the opposite direction. When there is a sudden increase in traffic, the provided grant sizes increase rapidly. When there is a sudden decrease, the grant sizes fall accordingly.
The network environment that is used for the simulating procedure consists of an OLT that is connected to four ONUs through a splitter. The distances between OLT-splitter and splitter-ONUs are 40 and 8km respectively. The traffic traces were generated from [22]. An XG-PON simulator that is compatible with the PANDA architecture was developed in C++ 14 under the OMNeT++ simulating environment to demonstrate the performance of the FIBO DBA algorithm.
The Uncontrolled Excess DBA method [23] counts the underloaded and overloaded Alloc-IDs. The summary of the spare bandwidth of the underloaded IDs is then divided and provided to the overloaded ones, equally. The CBR method uses constant bitrate to provide bandwidth iteratively to the Alloc-IDs and exhibits low complexity with straightforward implementation. The next two figures depict the effect different default grant sizes have on the average delay time of the ONU data in their queues.
In Figs. 11.8 and 11.9, the average delay time is depicted according to the average grant sizes that are used. The adaptation of FIBO DBA is prominent when the grant sizes are low, which eventually leads to higher performance. This happens because local queues get overloaded and the reports from the ONUs denote that high bandwidth is required. The multipliers increase with the positive side effect of providing high-bandwidth opportunities that decrease the average delay time. When grant sizes get higher (horizontal axis), the provided bandwidth windows to the ONUs are adequate to keep their buffers low. So in this range, FIBO DBA works like the CBR method since the Fibonacci pointer points mainly to the lower numbers of the array.

Figure 11.8 Comparison with Load 0.5
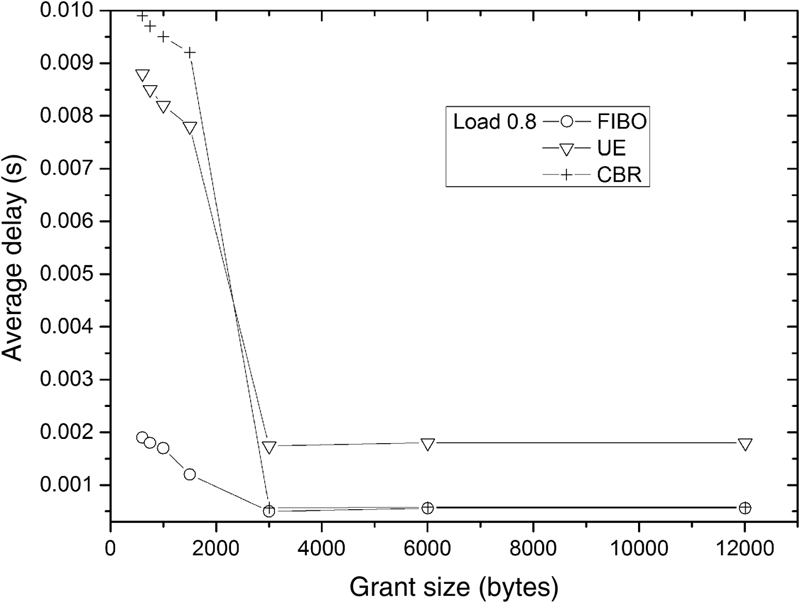
Figure 11.9 Comparison with Load 0.8
5. Conclusions
Concluding this chapter, a new and innovative optical network architecture that provides access to the end users was presented. Its scalability, geographical coverage, line rates, and the hybrid form provided by DSL were analyzed for the purpose of confronting the European 2020 agenda. At the same time, traffic aggregation and prediction techniques can coexist with this architecture for improving the overall performance. So, the basic ideas in this field that PANDA can exploit were presented. Finally, the DBA framework was introduced and a new adaptive DBA method was created and simulated. This method leads to decrease in the average delay time inside the queues of ONUs by taking advantage of the main property of a sequence of Fibonacci numbers.
Acknowledgment
This work has been funded by the NSRF (2007-2013) Synergasia-II/EPAN-II Program “Asymmetric Passive Optical Network for xDSL and FTTH Access,” General Secretariat for Research and Technology, Ministry of Education, Religious Affairs, Culture and Sports (contract no. 09SYN-71-839).
..................Content has been hidden....................
You can't read the all page of ebook, please click here login for view all page.