
Chapter 23
Smart Audio Sensing-Based HVAC Monitoring
Shahriar Nirjon1, Ravi Srinivasan2 and Tamim Sookoor3
1Department of Computer Science, University of North Carolina at Chapel Hill, Chapel Hill, NC, USA
2M.E. Rinker, Sr. School of Building Construction Management, University of Florida, Gainesville, FL, USA
3Senior Professional Staff, The Johns Hopkins University Applied Physics Laboratory, Laurel, MD, USA
Objectives
- • To become familiar with HVAC faults and their acoustic characteristics.
- • To become familiar with distributed acoustic sensing system.
- • To become familiar with cloud-based remote sensing and monitoring system.
23.1 Introduction
Centralized HVAC systems are the primary means to control the indoor climate and maintain occupants' comfort in over 88% of the commercial buildings in the United States [1]. They are also one of the most expensive systems in commercial buildings – in terms of both installation/replacement cost and energy consumption. Failure of an HVAC system is therefore detrimental to our well-being as well as to the finances. A notable consequence of faulty HVAC systems is the “sick building syndrome” – which leads to respiratory problems attributed to poor ventilation, low or high humidity, and unfiltered airborne particles and chemical pollutants in buildings. With adults spending over 40% of their average daytime at workplaces, proactive prognosis of HVAC system performance cannot be overlooked.
Most HVAC failures are fixable but are extremely costly [2]. A number of HVAC problems, if not repaired early, lead to costlier repairs, or even the need to replace the system entirely. For instance, if the blower motors are left running at a compromised state, they strain other heating and cooling components. Likewise, continued running of a faulty condenser fan stresses the system and causes compressor failures [3]. Identifying and repairing such problems early can save building owners a considerable amount of money. However, due to the lack of an effective, low-cost, and continuous assessment and prognosis mechanism for detecting underperforming HVAC units, it is extremely difficult to determine whether a repair, retrofit, or permanent retirement of an HVAC system is warranted. For a systematic prognosis and life-cycle management of centralized HVAC systems, what we need is a robust, inexpensive, and easily deployable system, so that impending failures can be detected early. Such a system saves money and helps us breathe healthy. It also reduces negative environmental impacts of HVAC systems as it helps in decreasing the number of retired units that find their ways to the landfills, which, in turn, reduces escaped contaminants that have been shown to deplete the ozone layer [4].
A key to repairing HVAC systems before a total failure is early identification of problems. Similar to many other mechanical systems, noise is a key indicator of impending failures in HVAC systems. For instance, squealing or screeching could indicate a bad belt or motor bearing problem [21]. InspectAPedia [22], the free encyclopedia of building and environmental inspection, testing, diagnosis, and repair, has a detailed classification of HVAC noises. We hypothesize that – by employing a smart, low-cost distributed acoustic sensor system that uses machine learning algorithms to learn and classify these noises in real time – we are able to detect faulty HVAC components, predict HVAC failures, and help building owners predictively maintain their HVAC systems in a cost-effective manner.
We propose a Smart Audio SEnsing-based Maintenance (SASEM) system that has a single unifying intellectual focus, that is, enabling predictive maintenance of building equipment by autonomously monitoring and analyzing their acoustic emissions. Using audio signatures to predict equipment failure requires more than simply connecting a microphone to a digital signal processor; it requires the development of novel hardware and software that are low cost, low maintenance, and easy to deploy and take into consideration the variations in noises produced by different equipment, acoustically hostile building environments, false positives and negatives during classification, and privacy issues. We propose novel hardware and middleware for audio data gathering using wireless acoustic sensor networks and cloud computing and effective machine learning-based classifiers to identify acoustic characteristics of building equipment. The three specific aims of the system are as follows:
- • Building a Low-Cost Sensing Platform: To build a low-cost acoustic sensing platform for audio data collection and onboard processing. The platform will be built using off-the-shelf hardware components and is expected to cost around $100–$200 per typical air handling room of an HVAC system, which is less than $0.10 per square foot in commercial buildings.
- • Acoustic Modeling of HVAC Systems: To address the fundamental challenge of uniquely identifying acoustic characteristics of centralized HVAC systems. We will devise algorithms to automatically learn acoustic models of different HVAC system components. A higher-level model is used to further learn the operational states of an HVAC system. These models are used to monitor deviations of an HVAC system from its regular operation and to identify and localize faults.
- • Decision Support System: To develop an interactive decision support system that provides real-time visualization of an HVAC system's health status and help assess the cost and benefits of repairing versus an early retirement of the system based on inputs such as the detected failures, different primary energy types, future energy price trends, and trends in monetary and nonmonetary benefits.
In order to test, evaluate, and demonstrate the capabilities of the integrated HVAC life-cycle management system, a live testbed, referred to as the “living laboratory,” will be implemented. The testbed has HVAC systems from four buildings at the University of Florida (UFL) and Oak Ridge National Laboratory (ORNL) campuses.
23.2 Background
23.2.1 HVAC Failure Detection
HVAC maintenance may be reactive, preventive, or predictive. Reactive approaches lead to increased economic loss owing to unexpected equipment downtimes. The goal of preventive and predictive maintenance approaches is to avoid equipment failure and extend their useful lifetime through constant monitoring. While preventive maintenance is mostly periodic in nature, predictive maintenance is based on the actual state of the system. A number of approaches for monitoring system states have been proposed in the literature, which includes using data collected from one or more components [5, 6]; neural network-based maintenance [7, 8]; vibration, IR cameras, and ultrasonic analysis [9]; probabilistic fault prediction subject to a gradual deterioration process [10]; and Kalman filter-based estimations [11]. Studies have indicated that predictive methods are more effective than preventative ones in terms of cost, time, and safety. Currently, a standard technique called Fault Detection and Diagnosis is used for predictive maintenance of HVAC systems in commercial buildings. This technique uses both model- and data-based methods to decide maintenance schedules and relies heavily on sensor data such as airflow rate, air temperature, air pressure, and electricity usage [12–20]. These sensors are typically installed in new buildings as they are built. For existing buildings, it is extremely challenging and cost prohibitive to install these sensors.
23.2.2 HVAC Failures and Acoustics
Acoustic sensing methods rely on the rich information provided by sound, where small shifts and changes in its spectro-temporal characteristic reliably indicate differences in the behavior, performance, or content of a system. Examples include acoustic pulse reflectometry [23, 24] and acoustic emission analysis [25]. Soundscape capture and analysis [26] has been used to learn about the diversity of sound sources including sounds generated by the environment [27] and biological organisms [28]. Over the past few decades, microphones and microphone arrays have been implemented in order to monitor the propagation of sound in urban environments and to detect acoustic events [29, 30]. More recently, the same principles have been used in monitoring factory machinery and the maintenance and detection of faults in engines using their noise signatures [31, 32]. Because of the reliability of sound behavior, sound emission analysis serves as a dependable alternative to other sensing modes for predictive maintenance. Typical faults in the air handling room of an HVAC system are discussed in [73], and we summarize them in Table 23.1.
Table 23.1 Faults in HVAC systems. OA, RA, EA, SA, and MA stand for outside, return, exhaust, supply, and mixed air
| Category | Device | Typical faults | Acoustic detection |
| Equipment | Fan | Pressure drop is increased | Subject to test |
| Overall failures of supply and return fans | Yes | ||
| Decrease in the motor efficiency | Yes | ||
| Belt slippage | Yes | ||
| Duct | Air leakage | Subject to test | |
| Heating coil | Fouling (fin and tube) leads to reduced capacity | Subject to test | |
| Cooling coil | Fouling (fin and tube) leads to reduced capacity | Subject to test | |
| Preheating coil | Fouling and reduced capacity | Subject to test | |
| Actuator | OA, RA, and EA dampers | A damper is stuck or in a faulty position | Yes |
| Air leakage at fully open and closed positions | Yes | ||
| Heating cooling coil, preheating coil valve | A valve is stuck, broken, or in wrong position | Yes | |
| Leakage occurs at fully open and closed valve | Yes | ||
| Sensor | SA, MA, OA, RA temp | Failures of a sensor are offset, discrete, or drift | No/causal |
| MA, OA, RA humidity | Failures of a sensor are offset, discrete, or drift | No/causal | |
| OA, SA, RA flow rate | Failures of a sensor are offset, discrete, or drift | No/causal | |
| SA and zone pressure | Failures of a sensor are offset, discrete, or drift | No/causal | |
| Controller | Motor modulation | Unstable response | Yes |
| Heating/cooling valve | Unstable response | No/causal | |
| Flow difference | The system sticks at a fixed speed | Subject to test | |
| Static pressure | Unstable response | Subject to test | |
| Zone temperature | Unstable response | No/causal |
The table shows four major types of HVAC components, devices for each category, typical faults for each type of device, and the potential for using acoustic sensors in detecting a fault. All actuator faults and some of the equipment faults are detectable from their sounds. These are labeled “YES” in the last column to indicate so. These devices produce mechanical noises that change as they wear out. On the other hand, sensors and controllers are digital, and because they do not produce any sounds, their failures are not directly detectable. However, many of these faults are interrelated. For example, failure of a temperature sensor will have an effect on the fan, on heating and cooling coils, and, to some extent, on the duct. Hence, these failures can be inferred by learning the causal relationship between different components. These are labeled as “No/causal” in the table. Finally, some of the devices make noises that are too generic that human hearing is not capable of distinguishing them. However, by carefully training machine learning classifiers, these sounds can be distinguished from one another. In the next section, we provide some results from our preliminary experimentations, which show that these sounds are classifiable with acoustic sensors.
23.2.3 Strategy for Acoustic-Based HVAC Fault Detection
Based on literature review, our preliminary investigation, and ongoing deployment efforts, we are certain that acoustic sensing is an efficient, reliable, and cost-effective approach for building system fault detection and diagnosis due to its ease of data acquisition as well as some strong correlations between system working conditions and its operation sound and noise. The hypothesis of audio sensing-based fault detection and diagnosis is that a change in sound and noise reveals the operational condition of HVACs, and faults can be detected by tracking these sounds. However, not all building system faults may be directly detected through audio sensing as some of them may not impact the operation sound and noise, that is, sensor and controller faults. Our basic three-step strategy for acoustic-based HVAC fault detection is as follows:
- • Identify: Faults that can be identified by operation sound- and noise-related building system faults need to be identified. For air handling units (AHUs), there are four major types of faults that can be classified into two groups – the mechanical faults (i.e., equipment and actuator faults) and the digital faults (i.e., sensor and controller faults). The mechanical faults are caused by the failure of a certain device or component; hence they lead to the change in HVAC sound and noise, which can be identified directly. The digital faults are mainly caused by the failure of the sensor and controller; they may impact the control and energy efficiency of the system, but do not cause the change of operation sound and noise. These faults need to be identified indirectly from their causal effects on other noise-producing components.
- • Detect: Once targeted system faults are identified, the next step is to detect them. Detection is based on the hypothesis that the operation sound and noise remain stable or in a certain pattern when there is no fault. Hence we can detect system faults by detecting whether the stable status of system sound and noise is broken or whether there is occurrence of abnormal or rare audio pattern. Faults can also be sensed using thermal imaging and vibration analysis as a cross-check to the acoustically fault diagnosis.
- • Diagnose: The last step is to diagnose system faults. This process is conducted based on the hypothesis that different types of system faults should cause different change in system operation sound and noise. Hence, different system faults can be detected by tracking and comparing their corresponding operation sound and noise. In this step, an important process is to intelligently classify the different types of system faults. In general, this process is reached through machine learning method, of which a learning model that is built by learning the relation between audio data and different types of faults will be used to classify different types of faults. To establish this learning model, we may need both audio data and the ground truth data to train and test the model. The ground truth will be derived from the analysis of building energy management data, which requires involvement of expertise to manually diagnose different system faults.
23.3 The Design of SASEM
Our goal is to transform the way predictive maintenance of building HVAC systems is conducted. Toward achieving this, the design for SASEM embarks on three specific aims as shown in Figure 23.1. First, an embedded sensor platform, system architecture, and APIs to support multiple types of sensor nodes to gather acoustic characteristics of HVAC systems will be designed, developed, and tested. Second, acoustic signal characterization and classification algorithms will be developed to create sound libraries of centralized HVAC systems, which will be used to detect and localize faulty components of an HVAC system. Third, a strategic optimization model will be developed as a decision support system to enhance environmental sustainability of centralized HVAC systems. System admins will be able to access this via an online visualization platform. Adequate validation will be performed using a “living laboratory” where embedded devices are deployed and integrated with the visualization platform. Acoustic data of centralized HVAC systems will be gathered in real time and processed for environmental decision making from four buildings – the three are in the UFL campus and the fourth is the Flexible Research Platform situated in ORNL campus.
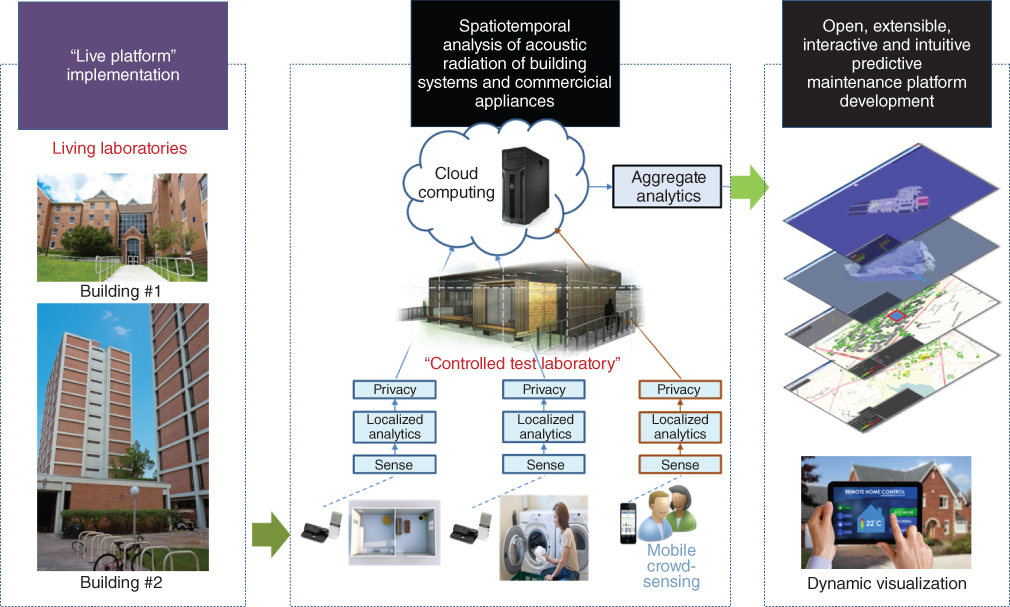
Figure 23.1 Overview of the proposed research showing the interactions among the three specific aims of this project.
23.3.1 Building a Low-Cost Sensing Platform
Wireless sensor networks (WSNs) that gather acoustic signals have been used in applications ranging from locating specific animal calls [33] and classifying frog vocalization [34] to shooter localization [35] and speech/music discrimination [36]. The use of WSNs for smart building management has been gaining momentum in sensing environmental variables such as temperature and humidity. Such data have been used for the purposes of energy disaggregation and monitoring, building system control, and fault detection [12–20]. While a number of sensing modalities have been used in the existing literature, the use of audio sensors in building management has remained underexplored. A notable exception is TinyEARS [37], where audio sensors are used to detect the on/off status of appliances for energy disaggregation analysis.
In one of our previous works [38], a smart thermostat has been developed to retrofit existing HVAC systems in homes in order to increase their energy efficiency. When a house is unoccupied, the system sets the HVAC system to a more energy-efficient setting. In a follow-on work [39], the authors developed RoomZoner that extended the concept of occupancy-driven HVAC control to reduce the energy wasted in unoccupied rooms of occupied houses. This system was evaluated in a home by retrofitting its existing HVAC system with wirelessly controllable air vents and thermostats that were controlled based on inputs from motion sensors (for occupancy detection) and temperature sensors. In both projects, the energy consumed by the HVAC system was measured using a real-time in-home energy management system called The Energy Detective [40]. In instrumenting homes to evaluate these HVAC control systems, a considerable amount of knowledge in deploying a “living laboratory” was gained [41].
Robust and efficient integration of recent developments in WSNs and cloud computing technologies for the purpose of acoustic anomaly detection of HVAC systems has not been previously attempted. A critical challenge is developing a low-cost hardware platform with a sufficiently small form factor that can capture the necessary audio signatures at the required fidelity while filtering out privacy-compromising sounds.
To overcome the challenges and to develop a novel technology for soundscaping centralized HVAC systems, we design an embedded audio monitoring device that includes a microphone, a microcontroller, and a Wi-Fi module. We developed a similar device consisting of a condenser microphone, a BeagleBone Black embedded device, and a USB Wi-Fi device (Figure 23.2) for detecting an occupant's identity and mood. These devices are capable of continuously recording audio data at an appropriate sampling rate as well as performing real-time onboard data processing and classification. The embedded devices will be placed at different locations throughout the building as part of a network and will coordinate with one another to process audio data and transmit events to a base station. In addition to the on-device processing to filter out speech and other privacy-compromising information, this project will leverage cloud-based services to perform the more sophisticated aggregate analytics, house large datasets, and train classification models.

Figure 23.2 Sensing platform consisting of a USB condenser microphone, a BeagleBone Black SoC, and USB wireless accessory.
Our approach leverages the convergence of low-power and ubiquitous mobile computing devices with powerful cloud computing services [42–46]. In addition to the embedded devices, we opportunistically integrate other emplaced microphones and mobile devices such as smartphones and tablets. Android apps for these devices will be created that filter, tag, and analyze the data. The architecture will be flexible enough to automatically identify the set of devices, collect the desired data, and produce configurations that improve the sensing and data processing on these devices. When a problem occurs, occupants and admins will be able to report the ground truth such as a system failure or noise levels. To encourage occupants, we will provide incentives. As part of this architecture, we will also design an audio sensing middleware and an API to remove the complexity from the application developers to interface with a variety of physical sensors and enable local analytics and data processing on heterogeneous devices (ARM Linux, Android, etc.).
Unique research challenges arise from mobile crowd sensing paradigm ranging from participatory and opportunistic data collection, proper incentive mechanisms, transient network communication, and big data processing. These challenges include the following:
- • Privacy and Security: Because of the involvement of human participants, several issues regarding the privacy and security of data, for example, sensitive information such as human voice and location being captured, need to be addressed. Since every individual has a different perception of privacy, developing privacy techniques that address variation in individual preferences is needed.
- • Quality of Data and Trust: Data gathered by malfunctioning or malicious sensor nodes need to be addressed in order to make sure that [47] user data are not revealed to untrustworthy third parties, which affects the privacy and security of cloud-assisted applications.
23.3.2 Acoustic Modeling of HVAC Systems
Recently, there has been an explosion of audio recognition applications. Some examples include speaker identification [48], speech recognition [49], emotion and stress detection [50, 51], conversation and human behavior inference [52, 53], music recognition [54], and music search and discovery [55]. There are other types of applications that fall into the non-voice, nonmusic category, such as a cough detector [56], heartbeat counter [57], and logical location inference [58, 59]. These examples are limited in number and acoustic sensing is often one of multiple sensing modalities. There are existing works that consider multiple types of acoustic events: SoundSense [60] considers speech, music, and ambient sound and provides a mechanism to label clusters of ambient sounds to extend the set of classes, Jigsaw [18] considers speech and sounds related to activities of daily living, and TinyEARS attempts at acoustic filtering inside a building focusing on energy use [37].
Previously, we built a general-purpose acoustic event detection platform called Auditeur [61]. Compared with prior work in the literature, Auditeur was positioned as a developer platform rather than just a system detecting a set of sounds. Auditeur provided APIs to developers to enable their applications to register for and get notified of a wide variety of acoustic events such as speech, music, sounds of vehicles, etc. Auditeur achieved this ability of classifying general-purpose sounds by utilizing tagged soundlets: a collection of crowd-contributed, short-duration audio clips recorded on a smartphone along with a list of user-given tags and automatically generated contexts. The cloud hosted the collection of tagged soundlets and provided a set of services, which were used by the smartphones, to upload new soundlets and to obtain a detailed classification plan to recognize sounds specified by the list of tags as parameters.
Although audio recognition science is mature, there is a serious lack of work in understanding the anomalous acoustic signals generated by building systems. There are several problems that make this challenging. First, because of complexities of real-world operation, the system must be resilient to ambient noise, attenuation, and reverberation in the received audio signal. Second, because of the wide range of equipment being monitored, flexible and adaptive online learning must be employed. Third, because audio monitoring devices are placed in living spaces with people, strategies for addressing privacy concerns are paramount. Lastly, a major challenge is variations in make and model of HVAC systems, particularly as products from different manufacturers, and even different models from the same manufacturer, may produce different sounds. Thus, audio signatures should be robust to these variations.
A key element to our approach begins with building a “sound library” of tagged audio clips from various appliances and generating acoustic models for detecting anomalous acoustic events. The sound library contains clips of normal and anomalous audio signals collected from HVAC systems. Models for recognizing normal operation, anomalies, and events are generated in the cloud and pushed to the device. The particular benefits of onboard classification are that the application can continue to monitor audio signals without maintained connectivity and raw audio signals do not have to leave the premises for processing. When an equipment is annotated dysfunctional, the tagged event with associated audio features can be used to train the system to be able to predict when the next event occurs.
To recognize different operational states of an equipment, we investigate classification as well as contextual anomaly detection algorithms. Most existing anomaly detection algorithms consider only acute changes to the signal to recognize an anomaly called a point anomaly [62]. However, this might not be suitable in our scenarios where the environment is highly dynamic, new noise-emitting devices may be installed into the environment, and the operating conditions in the home could change. An acoustic event is defined as a short-duration sound (1–3 s) that has significantly higher acoustic energy content than the background noise. These types of events are identifiable and their type is recognizable using a typical five-stage acoustic processing pipeline (Figure 23.3).
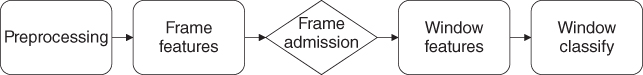
Figure 23.3 Acoustic event detection pipeline.
The process of continuous acoustic event detection starts with a preprocessing stage, which captures audio from the microphone, converts the byte stream into a stream of fixed size frames (typically 32–64 ms), and applies some standard acoustic processing activities such as filtering, windowing, and noise compensation as needed by the application context. Each frame is then passed through a frame-level feature extraction stage. In this stage a number of time and frequency domain acoustic features are extracted. The exact number and type of acoustic features that can characterize a specific acoustic event depends on the application scenario. However, a few acoustic features are commonly seen to characterize a wide variety of sounds, for example, a feature called the mel-frequency cepstral coefficients (MFCCs) is used in voice recognition, music identification, and machine acoustics.
After the feature extraction stage, frames are classified using a frame-level classifier, which acts as an admission controller and decides whether or not to process a frame any further. This step is employed to avoid unnecessary processing of uninteresting frames (e.g., in continuous acoustic event detection, most of the time a microphone is listening to the background noise as nothing is happening in the surrounding environment). If a frame is admitted to the window-level feature extraction stage, a fixed number of consecutive frames are gathered to form a window, and a number of statistics (e.g., mean and variance) are computed per feature per window. Finally, a window-level classifier classifies each window.
Acoustic samples for some types of HVAC faults may be obtained from sources such as HVAC manufacturers and repairers. A number of HVAC faults can also be artificially introduced into the system by injecting controlled randomness into HVAC controllers. However, availability of acoustic samples for all types, or even for a decent set of faults, cannot be assumed for practical reasons. On the other hand, collecting acoustic data by ourselves while waiting for a component to fail may take an indefinite amount of time. Hence, we devise a strategy to deal with this issue that employs unsupervised machine learning algorithms to learn the “regular pattern” in acoustic time series data, and discover, if the system has deviated from its regular operation at any point in time. This is a continuous learning and classification task that is susceptible to high false-positive rates at the early stage of learning. To mitigate this, we employ a human-in-the-loop approach, where a knowledgeable human operator will be notified with the location of the deviated and seemingly faulty component, who will make the final call. In the case of an actual fault or a false alarm, the acoustic models will be retrained to include this new knowledge, as labeled by a human. The PIs have successfully used such a combination of supervised and unsupervised learning approach in one of their works on human activity discovery and recognition [74]. The same principle will be applied in HVAC context to discover and detect faults with an improved precision.
An HVAC system is composed of various units – each contributing to the aggregate sound to which our proposed sound acquisition system is listening. In order to define and classify the health status of each component of the HVAC system, it is essential to create an acoustic model for each of the individual component as opposed to a single global model of the entire system. A global acoustic model of the entire system can only tell whether or not the whole system is functioning perfectly. Although a finer level of inference is theoretically possible by using a multi-output inference model, this is not practical since to train such a system we would have to keep just one component of the system on while shutting down the rest of the system – which is not possible in an HVAC system. Because of this, we propose an ensemble approach, where a number of embedded audio sensing devices work in concert – each providing its own individual view of the system, and a central node (a machine in the cloud) aggregating the individual decisions to identify the component of the system that is problematic.
As an illustration, consider the scenario of Figure 23.4, where three independent embedded acoustic sensing systems are monitoring an HVAC system. Some high-level components of the HVAC system, for example, the heat exchanger, condenser, duct, and vent, are shown inside smaller boxes. Each one of these devices only learns and detects “abnormality” of the system from its own perspective. However, due to the placement of the devices with respect to the system components, when a particular component fails, opinions of some of the sensors must be valued higher than others. For example, the leftmost sensor system strongly hears sounds from the heat exchanger and the condenser unit (shown with arrows), whereas acoustic signals from the duct and the vents are weaker when they reach the leftmost sensor (no arrows). Now, if this sensor ever detects an anomalous behavior of the entire system, it is more likely that the faulty component is either the heat exchanger or the condenser or both, rather than the duct or the vent. It is possible to accurately locate the faulty component since all such individual decisions, as well as the weights of each decision (calculated a priori), are known to the cloud.
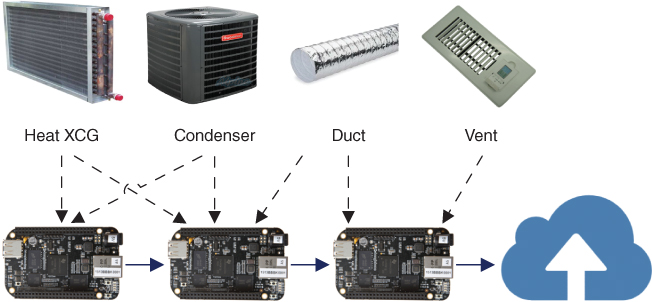
Figure 23.4 Distributed and ensemble approach toward detection of faulty components in HVAC systems.
Because our embedded device will be installed inside a building, it will be in the presence of the residents. Therefore, the system needs to be able to filter out speech from the microphone input or be able to do classification on-device instead of allowing the signal with speech data to leave the premises. A possible solution to this is to either do the classification entirely on the embedded device by pushing the models down from the cloud or to be able to automatically subtract, or scramble, human voice from the signal, which will be decided as we progress with the project. A possible approach for this project would be to employ a modified granular synthesis technique [63] to blur the spectrum of the voice, thus making it unrecognizable. This technique would maintain the quality, texture, and characteristics of the audio, without compromising the privacy of individuals.
23.3.3 Decision Support System
The Building Information Model (BIM) allows digital representations of buildings and its mechanical systems. The US General Services Administration released the “BIM Guide for Energy Performance” as a method to strengthen the reliability, consistency, and usability of predicted building energy use and energy cost results [64–67]. With BIM's widespread adoption by architects and engineers including portfolio managers, a “dynamic” approach to BIM could enable not only visually tracking impending failures and equipment decay, its environmental cost, and the overall health of centralized HVAC systems but also response to state changes for immediate feedback and action.
The power of BIM can be harnessed to provide HVAC status information. In a previous project, we developed a Dynamic-BIM (dBIM) platform in collaboration with the Building Technologies Research and Integration Center, ORNL [68]. This platform has been further extended [69–72] to integrate 3D heat transfer analysis and enable high-performance parallel computing. Through a grant from the US Department of Energy–International and the South African National Energy Development Institute (SANEDI), we are expanding the work to include environmental impacts, for example, impact on health and ecosystem services, as well as emissions in the scalable dBIM platform. Most recently, we received the Global Innovation Initiative grant from the US Department of State to develop novel approaches to employing green infrastructure to enhance urban sustainability.
Two major research tasks in designing and developing a decision support system for centralized HVACs are (i) devising an optimization model to help decision makers choose the optimal timeframe for retiring centralized HVAC systems with a short-term and long-term decision horizon and (ii) developing an integrated platform for domain modeling, simulation, and visualization that enables interoperability with newer and legacy systems to seamlessly transfer BIM for representing buildings and their systems.
We design a strategic optimization model that will help assess the cost and benefits of repairing versus an early retirement of an HVAC system, based on inputs such as the detected failures, the operational performance (both short term and long term), different primary energy types, future energy price trends, and trends in monetary and nonmonetary benefits.
Using a defensible set of input assumptions, grounded in the existing scientific and economic literatures, the avoided environmental damages will be translated into economic benefits. Uncertainties around the monetization of environmental impacts and related assumptions will be updated in line with the advancements of the science and economics of climate impacts. Building owners and property managers will be able to visualize and evaluate the benefits likely to result from permanently retiring underperforming systems.
Several monetary and nonmonetary decision factors will be analyzed during the decision making. These are summarized in Table 23.2.
Table 23.2 Monetary and nonmonetary decision factors
| Monetary factors | Nonmonetary factors |
|
|
We design a visualization platform that enables importation of BIM overlaid with prognosis and health information of HVAC systems. This is essential to provide advanced warning of failures to owners and property managers through a user-friendly visual interface. Figure 23.5 shows how data from buildings is processed, analyzed, and visualized and how the system provides real-time feedback to building owners and project managers, who can act on the information, completing the loop. The platform integrates domain models, enables simulations, and provides visualizations to aid decision making by the stakeholders. The integrated decision platform is extensible and scalable – spanning seamlessly across a variety of scales – from building to neighborhood to city scale. This ability to cut across scales will allow this platform to achieve its ultimate goal, that is, to model, simulate, and visualize the linkages and interplay among all elements of the urban fabric of smart cities. Besides using sensors and information and communication technologies' advancements, the proposed integrated visualization platform will allow users to “walk” into building zones to investigate abnormal energy usages and/or system faults, conduct “what-if” scenarios and data analytics of building energy components, and perform energy efficiency and environmental accounting procedures from within the platform.
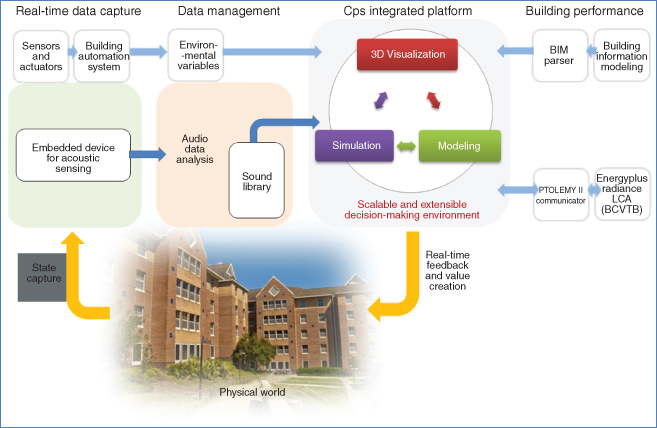
Figure 23.5 Full life cycle of the proposed integrated platform for predictive maintenance.
There are limitations in the monetization of social cost of carbon owing to uncertainty, speculation, and lack of data on future greenhouse gas emissions, effects of past and future emissions on the climate, and the translation of these environmental impacts into economic damages. However, using a defensible set of assumptions, we use the social cost of carbon to estimate social benefits of reducing CO2 emissions using the proposed system for early retirement of centralized HVAC systems. Furthermore, as the decision platform allows stakeholders to perform actions such as “semantic tagging,” there is always a possibility of the occurrence of undesirable data clutter that may hinder the viewer's understanding of the content. To overcome this problem, a hierarchical approach to data exploration will be permitted. As the user becomes familiar with data analytics and intuitive interface mechanisms, the potential of data clutter can be eliminated entirely. That said, the visualization platform would take a minimalist (minimal user interface (UI) elements) and intuitive UI approach for effective usability.
23.4 Experimental Results
23.4.1 Spectral Analysis of HVAC Sounds
We have conducted a set of experiments to understand the variability of acoustic signatures in HVAC systems. A portable, dual-track audio recorder (Zoom H1 handy recorder) was used for recording audio samples of HVAC equipment located in three AHU rooms situated in three buildings in the UFL campus – Harn Museum, Phillips Center, and Southwest Recreation Center. Figure 23.6 shows these three test environments. The audio samples were recorded at 44.1 kHz in WAV format with 16 bits per sample signal encoding, and the duration of each clip was 60 s. While all three AHU rooms comprised AHUs of similar types, the hot water boilers were of different types in the Southwest Recreation Center.
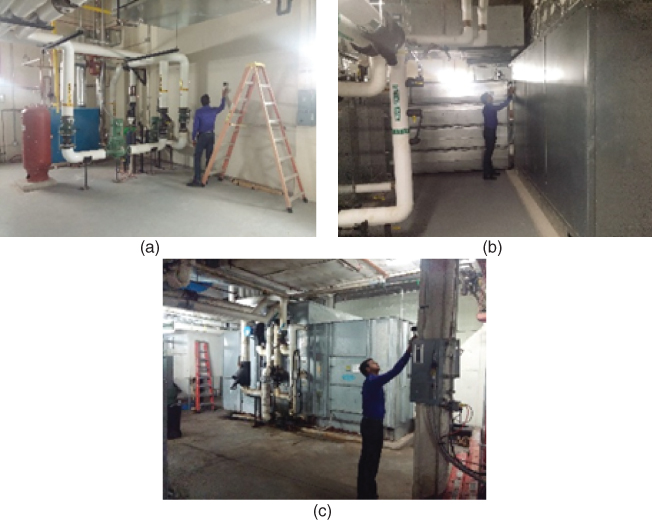
Figure 23.6 AHU rooms: (a) Harn Museum, (b) Phillips Center, and (c) Southwest Recreation Center.
Table 23.3 shows the spectrogram plots of 11 audio clips recorded near 5 different AHUs – a pump, a fan, and 3 boilers inside these three buildings. Two of the clips also contain human voices in the background. The horizontal axis of each of the spectrograms denotes time (up to 60 s). The vertical axis denotes the frequency range of −30 dB (lighter shades) to −150 dB (darker shades). We observe that different units have different spectral characteristics – which can be leveraged to identify a unit. For example, a pump, a fan, and a boiler operate in the frequency ranges of −53.4 ± 13.6, −62.3 ± 7.4, and −28.3 ± 5.24, respectively. In addition to that, some of these units have special acoustic signatures identifiable by detecting a special acoustic event, for example, the pump in H2 occasionally makes a sound that excites all frequencies. The presence of voice is identifiable by observing the change in human voice frequency range in the spectrograms – for example, the same fan in H3 and H4 shows slightly different spectral plots due to the presence of voice. Therefore, by using spectral subtraction, voice can be removed from the audio signals to preserve privacy. The location also has an effect on the acoustic characteristics, for example, boilers in Phillips Center (P1 and P2) are similar in spectral characteristics and boilers in SW Rec Center (R1 and R2) are also similar to each other, but there is a significant difference between boilers from these two places. Hence, we hypothesize that by modeling the spectral characteristics of each unit, we will be able to identify the unit's type and location, remove background noise and human speech, and detect expected/unexpected events.
Table 23.3 Spectrogram plots of different AHU units within the three buildings
| Location | Equipment | Spectrogram plot (x axis: time 60 s, y axis: Freq. [−30 dB, −150 dB]) |
| H1: Harn Museum | Between AHUs | |
| H2: Harn Museum | Pump | |
| H3: Harn Museum | Fan | |
| H4: Harn Museum | Fan + voice | |
| P1: Phillips Center | Boiler | |
| P2: Phillips Center | Boiler | |
| R1: SW Rec Center | Boiler | |
| R2: SW Rec Center | Boiler |
Although our preliminary investigation suggests that the planned research is promising, there are at least two caveats. Firstly, in a real deployment, there will be cases where multiple units will be making sounds at the same time, and we need to identify them separately. This is, however, a variant of the classic cocktail party problem, which is solvable when there are a sufficient number of acoustic sensing devices. Secondly, in this preliminary study, we collected audio samples from close proximity to the unit. This may not be always possible in an actual deployment. Hence, placing a sensor at a suitable place will be a challenging problem to solve. To handle this, we plan to employ a feedback mechanism during the sensor deployment phase, which will guide us in choosing an optimal position for a sensor. Finally, in a networked acoustic sensing environment, there are always chances of collisions in wireless transmissions, which may introduce unpredictable delays in detecting faulty units. This will be taken care of by synchronizing all wireless transmissions from all of our sensing units that are within the range of one another.
23.4.2 Longer-Term Deployment
Inspired by the preliminary results of spectral analysis, we conduct a longer-term experiment where we monitor the AHU room of Harn Museum in real time using a smartphone network. We use smartphones to quickly set up a three-node acoustic sensor network that captures acoustic signals and seven other types of onboard sensor readings (accelerometer, gyroscope, humidity, light, temperature, magnetometer, and pressure) from three AHUs of the HVAC. This setup is not low cost; in fact, each mobile device (Samsung Galaxy S4) costs around $500 in the consumer market. But for a quick deployment and to initiate the data collection as early as possible, this was our best option. A custom smartphone application has been developed to capture audio signals at 44.1 kHz and other sensors at 100 ms interval. After capturing, we perform basic data cleaning operations, including detection and removal of human voice, and ship them to a secure server maintained by the UFL. From the server, these data are periodically downloaded and analyzed in MATLAB (Figure 23.7).
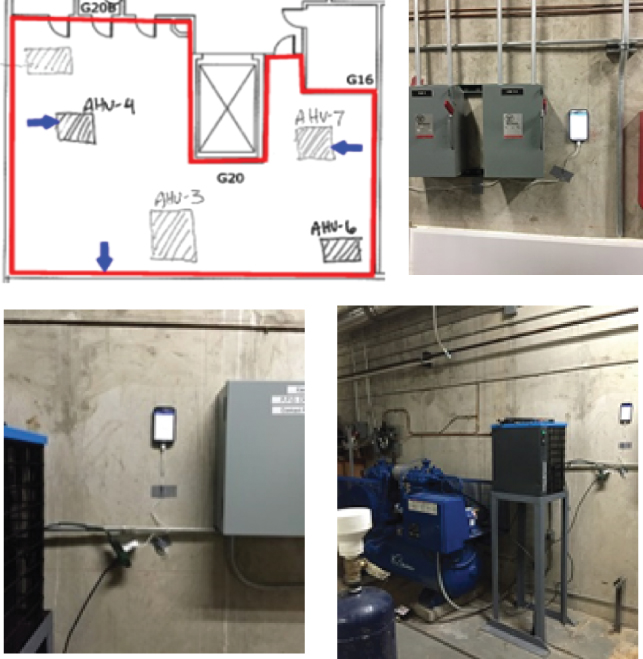
Figure 23.7 Deployment of the smartphone sensor network in three air handling unit rooms.
As discussed earlier, we employ an unsupervised learning approach to model and encode the regular pattern in the acoustic time series data and to discover if a running HVAC system has deviated from its regular pattern of operation at any point in time. At first, the audio stream is converted to a stream of 50-ms frames and passed through a frame-level feature extraction stage where MFCCs are computed for each frame. Then k-means algorithm is used to cluster similar audio frames. Cluster assignment is used as an encoding for each frame. This step maps acoustic frames to k clusters. Finally, we compute the transition probabilities between each pair of clusters. Once the transition probabilities are in steady state, a sequence of unlikely transitions would mean that the HVAC's behavior is unusual with respect to the currently learned model. Note that modeling the normal HVAC is a continuous learning task, which is susceptible to high false-positive rates at the early stage. To mitigate this, we employ a human-in-the-loop approach.
In Figure 23.8, two transition matrices computed on two completely disjoint and independent time spans (524,280 frames each) are shown. The similarity between corresponding cell values tells us that our proposed acoustic-based HVAC state modeling strategy is fairly stable. With more data and larger number of clusters, these two matrices will converge to steady-state values, which can be used to discover potential faults in HVAC systems.
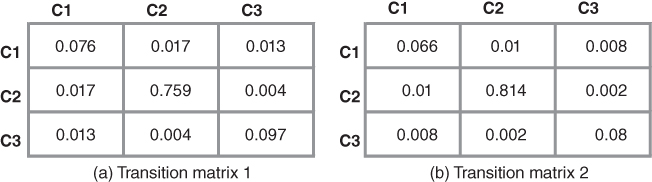
Figure 23.8 The similarity between transition matrices computed on two different time spans are noteworthy. This phenomenon provides an empirical validity of our acoustic modeling strategy. (a) Transition matrix 1. (b) Transition matrix 2.
Final Thoughts
Through SASEM, we aim to develop and mature the science of using acoustic signals for system assessment prognosis of centralized HVAC systems. Our next step is to build an energy-efficient low-cost sensing platform comprising a network of embedded devices. Moreover, we will develop a decision support system with an optimization model and a visualization platform. To elaborate, the optimization model will help decision makers choose the optimal timeframe for retiring centralized HVAC systems with short-term and long-term decision horizons. The visualization platform will allow acoustic-based system assessment and prognosis through simulation and learning and enable interactive user functionalities for data analysis and control.
Questions
-
1 What are the types of HVAC faults that are detectable by acoustic sensing?
-
2 What are the three key strategical considerations for acoustic-based HVAC fault detection?
-
3 Discuss the benefits of predictive HVAC maintenance.
-
4 Why an unsupervised learning method is necessary for acoustic-based HVAC monitoring?
Acknowledgement
The authors would like to acknowledge the financial support for this research received from the US National Science Foundation (NSF) EAGER #1619955. Any opinions and findings in this chapter are those of the authors and do not necessarily represent those of NSF.
References
- 1 US CENSUS Bureau. Available: http://www.census.gov/ (accessed January 2015).
- 2 Turpin, J.R. (2009) To Repair or Replace: That Is the Key Question. Retrieved April 24, 2015, from The Air Conditioning, Heating and Refrigeration NEWS: http://www.achrnews.com/articles/110056-to-repair-or-replace-that-is-the-key-question
- 3 Novell Custom HVAC (2014) Common Repairs. Retrieved April 24, 2015, from Novell Custom Heating & Air Conditioning Co.: http://www.novellcustom.com/common-repairs/
- 4 Miller, E. (2015) What To Do With Your Old HVAC Unit. Retrieved April 24, 2015, from Snyder Heating and Air Conditioning: http://blog.snyderac.com/blog/what-to-do-with-your-old-hvac-unit
- 5 Hosek, M. Krishnasamy, J., and Prochuzka, J. (2006) Intelligent condition-monitoring and fault diagnostic system for predictive maintenance. US Patent No.: US 7882394 B2.
- 6 Watt, J. (1994) Predictive Maintenance Programs (PMP's) in Small HVAC Applications: Analysis of Available Products and Technology. Report prepared for MEEN 662.
- 7 Fu, C., Ye, L., Liu, Y. et al. (2004) Predictive maintenance in intelligent-control-maintenance system for hydroelectric generating unit. IEEE Transactions on Energy Conversion, 19, 179–186.
- 8 Lin, C. and Tseng, H. (2005) A neural network application for reliability modelling and condition-based predictive modeling. International Journal of Advanced Manufacturing Technology, 25, 174–179.
- 9 Liggan, P. and Lyons, D. (2011) Applying predictive maintenance techniques to utility systems. Official Magazine of ISPE, 31 (6), 1–7.
- 10 Zhao, Z., Wang, F., Jia, M., and Wang, S. (2010) Predictive maintenance policy based on process data. Chemometrics and Intelligent Laboratory Systems, 103, 137–143.
- 11 Yang, S.K. (2002) An experiment of the state estimation for predictive maintenance using Kalman filter on a DC motor. Reliability Engineering and System Safety, 75, 103–111.
- 12 Schein, J., Bushby, S.T., Castro, N.S., and House, J.M. (2006) A rule-based fault detection method for air handling units. Energy and Buildings, 38 (12), 1485–1492.
- 13 Sun, B. et al. (2014) Building Energy doctors: An SPC and Kalman filter-based method for system-level fault detection in HVAC systems. IEEE Transactions on Automation Science and Engineering, 11 (1), 215–229.
- 14 Dong, B., Zheng, O.'N., and Li, Z. (2014) A BIM-enabled information infrastructure for building energy fault detection and diagnostics. Automation in Construction, 44, 197–211.
- 15 Capozzoli, A., Lauro, F., and Khan, I. (2015) Fault detection analysis using data mining techniques for a cluster of smart office buildings. Expert Systems with Applications, 42 (9), 4324–4338.
- 16 Du, Z. et al. (2014) Fault detection and diagnosis for buildings and HVAC systems using combined neural networks and subtractive clustering analysis. Building and Environment, 73, 1–11.
- 17 Li, S. and Wen, J. (2014) A model-based fault detection and diagnostic methodology based on PCA method and wavelet transform. Energy and Buildings, 68, 63–71.
- 18 Li, Y. et al. (2014) Experimental study on electrical signatures of common faults for packaged DX rooftop units. Energy and Buildings, 77, 401–415.
- 19 Yan, K. et al. (2014) ARX model based fault detection and diagnosis for chillers using support vector machines. Energy and Buildings, 81, 287–295.
- 20 Zhao, X., Yang, M., and Li, H. (2014) Field implementation and evaluation of a decoupling-based fault detection and diagnostic method for chillers. Energy and Buildings, 72, 419–430.
- 21 Baird, B.L. (2013) Your HVAC system: 5 Sounds You Don't Want To Hear. Retrieved April 24, 2015, from Angie's List: http://www.angieslist.com/articles/your-hvac-system-5-sounds-you-dont-want-hear.htm
- 22 InspectAPedia (2015) HVAC Noise Descriptions & Recordings. Retrieved April 24, 2015, from Free Encyclopedia of Building & Environmental Inspection, Testing, Diagnosis, Repair: http://inspectapedia.com/noise_diagnosis/HVAC_Noise_Descriptions.php
- 23 Ware, J.A. and Aki, K. (1969) Continuous and discrete inverse-scattering problems in a stratified elastic medium. I. Plane waves at normal incidence. The Journal of the Acoustical Society of America, 45 (4), 911–921.
- 24 Sharp, D.B. and Campbell, D.M. (1997) Leak detection in pipes using acoustic pulse reflectometry. Acta Acustica United With Acustica, 83 (3), 560–566.
- 25 Vahaviolos, S.J. (ed.) (1999) Acoustic Emission: Standards and Technology Update Vol. 1353, ASTM International.
- 26 Schafer, R.M. (1977) The Tuning Of The World, Alfred A. Knopf.
- 27 Kull, R.C. (2006) Natural and urban soundscapes: The need for a multi-disciplinary approach. Acta Acustica United With Acustica, 92 (6), 898–902.
- 28 Krause, B. (1987) Bioacoustics: Habitat ambience & ecological balance. Whole Earth Review, 57, 14–15.
- 29 Mydlarz, C. et al. (2014) The Design of Urban Sound Monitoring Devices Audio Engineering Society Convention 137, Audio Engineering Society.
- 30 Kang, J. (2006) Urban Sound Environment, Taylor & Francis, New York, p. 304.
- 31 Czech, P. (2013) Diagnosing a Car engine fuel injectors' damage, in TST (ed. J. Mikulski), Springer, pp. 243–250.
- 32 Adaileh, W.M. (2013) Engine fault diagnosis using acoustic signals. Applied Mechanics and Materials, 295, 2013–2020.
- 33 Hu, W., Bulusu, N., Chou, C.T. et al. (2009) Design and evaluation of a hybrid sensor network for cane toad monitoring. ACM Transactions on Sensor Networks (TOSN), 5 (1), Article 4.
- 34 Wang, H., Elson, J., Girod, L., Estrin, D., and Yao, K. (2003) Target Classification and Localization in Habitat Monitoring. In Proc. of Acoustics, Speech, and Signal Processing Conf.
- 35 Simon, G., et al. (2004) Sensor Network-Based Countersniper System. Proceedings of the 2nd international conference on Embedded networked sensor systems. ACM.
- 36 Saunders, J. (1996) Real-time Discrimination Of Broadcast Speech/Music. Acoustics, Speech, and Signal Processing, IEEE International Conference on. Vol. 2. IEEE.
- 37 Guvensan, M.A., Taysi, Z.C., and Melodia, T. (2013) Energy monitoring in residential spaces with audio sensor nodes: TinyEARS. Ad Hoc Networks, 11, 1539–1555.
- 38 Lu, J., et al. (2010) The Smart Thermostat: Using Occupancy Sensors to Save Energy in Homes. Proceedings of the 8th ACM Conference on Embedded Networked Sensor Systems. ACM.
- 39 Sookoor, T. and Whitehouse, K. (2013) Roomzoner: Occupancy-Based Room-Level Zoning of a Centralized HVAC System. Proceedings of the ACM/IEEE 4th International Conference on Cyber-Physical Systems. ACM.
- 40 Energy, Inc. (n.d.) The Energy Detective. Retrieved from The Energy Detective Electricity Monitor: http://www.theenergydetective.com/ (April 26, 2015)
- 41 Hnat, T. W., et al. (2011) The Hitchhiker's Guide to Successful Residential Sensing Deployments. Proceedings of the 9th ACM Conference on Embedded Networked Sensor Systems. ACM.
- 42 Dinh, H.T., Lee, C., Niyato, D., and Wang, P. (2013) A survey of mobile cloud computing: Architecture, applications, and approaches. Wireless Communications and Mobile Computing, 13, 1587–1611.
- 43 Kumar, K. and Lu, Y.H. (2010) Cloud computing for mobile users: Can offloading computation save energy? Computer, 43 (4), 51–56.
- 44 Fernando, N., Loke, S.W., and Rahayu, W. (2013) Mobile cloud computing: A survey. Future Generation Computer Systems, 29 (1), 84–106.
- 45 Huang, D. (2011) Mobile cloud computing. IEEE COMSOC Multimedia Communications Technical Committee (MMTC) E-Letter, 6 (10), 27–31.
- 46 Guan, L., Ke, X., Song, M., and Song, J. (2011) A Survey of Research on Mobile Cloud Computing. In Proceedings of the 2011 10th IEEE/ACIS International Conference on Computer and Information Science (pp. 387–392). IEEE Computer Society.
- 47 Pournajaf, L., Xiong, L., Garcia-Ulloa, D.A., and Sunderam, V. (2014) A Survey on Privacy in Mobile Crowd Sensing Task Management. Technical Report TR-2014-002, Department of Mathematics and Computer Science, Emory University.
- 48 Lu, H., Bernheim Brush, A.J., Priyantha, B., Karlson, A. K., and Liu, J. (2011) Speaker Sense: Energy Efficient Unobtrusive Speaker Identification on Mobile Phones, Proceedings of the 9th international conference on Pervasive computing, June 12-15, 2011, San Francisco, USA.
- 49 Walker, W., Lamere, P., Kwok, P. et al. (2004) Sphinx-4: A Flexible Open Source Framework For Speech Recognition, Sun Microsystems, Inc., Mountain View, CA.
- 50 Lu, H., Frauendorfer, D., Rabbi, M., Mast, M.S., Chittaranjan, G.T., Campbell, A.T., Gatica-Perez, D., and Choudhury, T. (2012) StressSense: Detecting Stress in Unconstrained Acoustic Environments Using Smartphones, Proceedings of the 2012 ACM Conference on Ubiquitous Computing, September 05-08, 2012, Pittsburgh, Pennsylvania.
- 51 Rachuri, K.K., Musolesi, M., Mascolo, C., Rentfrow, P.J., Longworth, C., and Aucinas, A. (2010) Emotion Sense: A Mobile Phones Based Adaptive Platform For Experimental Social Psychology Research, Proceedings of the 12th ACM international conference on Ubiquitous computing, September 26-29, 2010, Copenhagen, Denmark
- 52 Miluzzo, E., Cornelius, C.T., Ramaswamy, A., Choudhury, T., Liu, Z., and Campbell, A.T. (2010) Darwin Phones: The Evolution of Sensing and Inference on Mobile Phones, Proceedings of the 8th international conference on Mobile systems, applications, and services, June 15-18, 2010, San Francisco, California, USA.
- 53 Miluzzo, E., Lane, N.D., Fodor, K., Peterson, R., Lu, H., Musolesi, M., Eisenman, S.B., Zheng, X., and Campbell, A.T. (2008) Sensing Meets Mobile Social Networks: The Design, Implementation And Evaluation Of The Cenceme Application, Proceedings of the 6th ACM conference on Embedded network sensor systems, November 05-07, 2008, Raleigh, NC, USA
- 54 Wang, A.. An Industrial-Strength Audio Search Algorithm. In ISMIR '03.
- 55 Sound Hound. Retrieved from http://www.soundhound.com/ (accessed 20 April 2015).
- 56 Larson, E.C., Lee, T.J., Liu, S., Rosenfeld, M., and Patel, S.N. (2011) Accurate And Privacy Preserving Cough Sensing Using A Low-Cost Microphone, Proceedings of the 13th international conference on Ubiquitous computing, September 17-21, 2011, Beijing, China
- 57 Nirjon, S., Dickerson, R.F., Li, Q., Asare, P., Stankovic, J.A., Hong, D., Zhang, B., Jiang, X., Shen, G., and Zhao, F. (2012) Musical Heart: A Hearty Way Of Listening To Music, Proceedings of the 10th ACM Conference on Embedded Network Sensor Systems, November 06-09, 2012, Toronto, Ontario, Canada.
- 58 Azizyan, M., Constandache, I., and Choudhury, R.R. (2009) SurroundSense: Mobile Phone Localization Via Ambience Fingerprinting, Proceedings of the 15th annual international conference on Mobile computing and networking, September 20-25, 2009, Beijing, China
- 59 Chon, Y., Lane, N.D., Li, F., Cha, H., and Zhao, F. (2012) Automatically Characterizing Places With Opportunistic Crowdsensing Using Smartphones, Proceedings of the 2012 ACM Conference on Ubiquitous Computing, September 05-08, 2012, Pittsburgh, Pennsylvania.
- 60 Lu, H., Pan, W., Lane, N.D., Choudhury, T., and Campbell, A.T. (2009) SoundSense: Scalable Sound Sensing for People-Centric Applications on Mobile Phones, Proceedings of the 7th international conference on Mobile systems, applications, and services, June 22-25, 2009, Kraków, Poland
- 61 Lu, H., Yang, J., Liu, Z., Lane, N.D., Choudhury, T., and Campbell, A.T. (2010) The Jigsaw Continuous Sensing Engine For Mobile Phone Applications, Proceedings of the 8th ACM Conference on Embedded Networked Sensor Systems, November 03-05, 2010, Zürich, Switzerland
- 62 Chandola, V., Banerjee, A., and Kumar, V. (2009) Anomaly detection: A survey. ACM Computing Surveys, 41 (3), Article 15 (July 2009), 58 pages.
- 63 Roads, C. (1988) Introduction to granular synthesis. Computer Music Journal, 12 (2), 11–13.
- 64 GSA (2009) BIM Guide Series: 02 – GSA BIM Guide for Spatial Program Validation, US General Services Administration.
- 65 Senate Properties (2007) BIM Requirements, Volume 3 – Architectural Design, Senate Properties, Finland.
- 66 Statsbygg (2011) BIM Manual version 1.2, Norwegian Ministry of Government Administration, Reform and Church Affairs, Statsbygg.
- 67 ASHRAE BIM Guide (2009) American Society for Heating, Refrigeration and Air-Conditioning Engineers, Atlanta, GA.
- 68 Srinivasan, R.S., Kibert, C.J., Fishwick, P., Ezzell, Z., Thakur, S., Ahmed, I., and Lakshmanan, J. (2012) Preliminary Researches in Dynamic-BIM (D-BIM) Workbench Development, In Proceedings of Winter Simulation Conference, Berlin, Germany, 2012.
- 69 Srinivasan, R.S., Kibert, C., Fishwick, P., Thakur, S., Lakshmanan, J., Ezzell, Z., Parmar, M., and Ahmed, I. (2013) Dynamic-BIM (D-BIM) Workbench for Integrated Building Performance Assessments, In Proceedings of the Advances in Building Sciences Conference, Madras, India, 2013.
- 70 Srinivasan, R.S., Thakur, S., Parmar, M., and Ahmed, I. (2014) Toward a 3D Heat Transfer Analysis in Dynamic-BIM Workbench. In Proceedings of iiSBE Net Zero Built Environment Symposium held in Gainesville, FL, 6-7 March, 2014
- 71 Srinivasan, R.S., Thakur, S., Parmar, M., and Ahmed, I. (2014) Towards the Implementation of a 3D Heat Transfer Analysis in Dynamic-BIM Workbench. In Proceedings of 45th Winter Simulation Conference to be held in Savannah, GA, 7-10 December, 2014
- 72 Agdas, D. and Srinivasan, R.S. (2014) Parallel Computing in Building Energy Simulation. In Proceedings of 45th Winter Simulation Conference to be held in Savannah, GA, 7-10 December, 2014.
- 73 Yu Y, Woradechjumroen D, Yu D. A review of fault detection and diagnosis methodologies on air-handling units. Energy and Buildings, 2014, 82, 550–562.
- 74 Nirjon, S., Greenwood, C., Torres, C., Zhou, S., Stankovic, J.A., Yoon, H.J., Ra, H.K., Basaran, C., Park, T., and Son, S.H. (2014) Kintense: A robust, accurate, real-time and evolving system for detecting aggressive actions from streaming 3D skeleton data. In Pervasive Computing and Communications (PerCom).