
CHAPTER 7
Big Data for Small, Midsize, and Large Operations
Omar Abdon and Randy Shi
Introduction
In this chapter we describe the basics of data analytics and the migration to Big Data analytics when massive data volumes overwhelmed traditional methods of analysis, and detail the four process steps and the tools used in Big Data analytics. We demonstrate why Big Data is essential to manufacturing organizations of all sizes, and finally we demonstrate how Big Data analytics is helping small to midsize enterprises (SMEs), including best practices and affordable tools.
Data are facts and statistics collected together for reference or analysis. People have been analyzing data for thousands of years, but the Industrial Revolution (Industry 1.0) greatly increased available data for analysis, with the invention of the printing press making mass literacy possible.
The growth of data continued under Industry 2.0, with telegraph, telephone, and faster travel using trains and automobiles. The first uses of data analytics in business dates back to the turn to the early twentieth century, when Frederick Winslow Taylor initiated his time management exercises. Henry Ford's measuring the speed of his assembly lines is another early example.
Industry 3.0 accelerated the growth further with computers, software applications, the Internet, smart machines, barcoding, robots, and so on. Computers were key in the evolution of data analytics, as they were embraced as trusted decision-making support systems. Industry 3.0 created so much data that it outgrew traditional data analysis, fostering the introduction of Big Data analytics. Data warehouses, the Cloud, and a wide variety of software tools have accelerated the growth of Big Data over the past 20 years.
The first references to Big Data can be found in 2003 by The Data Center Program created by the Massachusetts Institute of Technology (MIT). Prior to this, the phrase “data analytics” was often employed as a crucial description in early research conducted in the late 1990s. It has become essential to clarify the words Big Data and predictive analytics to avoid confusion.1
To begin, it is important to understand the difference between analysis and analytics.
- Data analysis is a process to examine, transform, and arrange a data set to permit studying its individual components and then extracting useful information.
- Data analytics is an overarching discipline or science that incorporates the complete management of data. Data analytics includes not only analysis, but also data collection, data organization, data storage, and all the tools and techniques used for analysis.2
Next, it is important to understand the difference between structured data and unstructured data, especially given the rapid growth in unstructured data.
Structured Data and Relational Databases
Structured data usually resides in relational database management systems (RDBMSs). Examples include Social Security numbers, phone numbers, ZIP codes, sales orders, purchase orders, customer and supplier masters, item numbers in a bill of material, and so on. Relational databases are more than just structured data. The structure is supposed to reflect the relationships between the data as well. The columns, tables, rows, sheets, tabs, and so on of 2D, 3D, or 4D relational databases are supposed to permit the finding of subtle or hidden facts embedded in the data, as well as to make sorting, generating reports, and so on much easier. A program evaluation and review technique (PERT)-style schedule is an example of a relational database when in the format of a tool like Microsoft Project. Not only is data such as start and stop dates included, but also information such as which events are dependent on past events, what kicks off what, and so on. Then a number of other bits of data can be included, like costs, who is responsible, and so on.
Structured data may be generated by people or by machines, as long as it created within an RDBMS structure. This format makes it easy to search, either with human-generated queries or by searching types of data and field names.3
While structured data is easy to search, maintaining its accuracy can be a challenge to anyone using material planning systems (MRPs), enterprise planning systems (ERPs), and inventory/logistics systems. In an age of continuing mergers and acquisitions there is an ongoing merging of item, customer, and supplier masters, resulting in the same items, customers, and suppliers being easily duplicated and not always easily discovered through queries or even using specially designed tools.
My favorite story about part or item number duplication comes from the time I was managing the supply chain for a facility making dental X-rays and operating tables. One day my production control manager advised that production had halted due to a shortage of simple twist ties used to secure wire harnesses. Walking the floor, one of the plant's more senior production workers told me that there were plenty of twist ties in-house but they were stocked under four different item numbers – one for each of the small companies they had acquired over the years. The engineering department had never bothered to update the item masters to show the equivalency or to merge numbers. Ironically, the largest inventory was stocked under an item number designated as excess inventory and being written off by our KPMG auditors.
Another problem in using structured data is in maintaining accurate promise or due dates for sales, purchase, and work orders. I found this to be a chronic issue in both large and smaller organizations over the years. Past-due orders make it very difficult to execute production and meet customer commitment dates.
Unstructured Data
Unstructured data is basically everything else. While unstructured data has an internal structure, it is not structured using predefined schema or data models. It may be textual or nontextual, machine- or human-generated. Typical sources of machine- and human-generated data include:
- Human-generated unstructured data comes from word processing, spreadsheets, presentations, emails, logs, social media such as, websites, mobile data, chat, instant messaging, phone recordings, Microsoft Office documents, productivity applications, and so on.
- Machine-generated unstructured data comes from satellite imagery, weather data, oil and gas exploration, space exploration, seismic imagery, atmospheric data, digital surveillance, traffic, oceanographic sensors, and so on.
Large amounts of unstructured data are challenging to define. Data sets are increasing exponentially in size, becoming too vast, too raw, or too unstructured for analysis using traditional relational database methods. This is typically what is considered Big Data.
According to some projections, the quantity of accessible data is expected to double every two years.4 Data is coming from various sources, including conventional sources like industrial equipment, automobiles, electricity meters, and shipping containers, to name a few. Data is also coming from a variety of newer Smart Technology sources such as the Industrial Internet of Things (IIoT) and computer vision. Smart Manufacturing generates Big Data to measure location, movement, vibration, temperature, humidity, electric current, and vehicle identifications, to name a few.
Exhibit 7.1 shows the exponential growth in unstructured data from 2010 to 2025 in zettabytes.5 (A zettabyte is a measure of storage capacity, equal to 1,0007 (1,000,000,000,000,000,000,000 bytes). One zettabyte is equal to a thousand exabytes, a billion terabytes, or a trillion gigabytes.)6

EXHIBIT 7.1 Growth in unstructured data, 2010–2025
Why Manufacturing Needs Big Data Analytics
Binny Vyas, writing in Softweb Solutions, details the significant data challenges manufacturers face.7
- Distributed Data. There is a growing volume of distributed data collected from a variety of sources and often presented in an inconsistent manner. While organizations typically capture data correctly, they may fail to effectively analyze and utilize the data efficiently.
- Integrating New Data. To stay competitive, manufacturing companies bring on new technologies and integrate them into legacy systems.
- Growing Volumes and Complexity of Data. As the volume of data and complexity of data grow, they challenge existing visualization and interaction tools.
- Connected Tools. Adding industrial control systems and connected tools may overload hardware gateways that connect all the IoT devices in a facility. The proliferation of connected tools also exposes manufacturers to external hackers and security breaches.
Vyas goes on to describe how Big Data analytics can meet these challenges and the many benefits it brings to manufacturers.
- Lower Operating Costs. With search-driven data analytics, employees have the ability to create ad-hoc queries at any time. Sales dashboards monitor sales trends and spot problems quickly. Supply chain dashboards project pending material shortages and overages. Results are available in seconds and come in the form of visualization models and easy-to-read data, embedded in portals and shared workflows.
- Select the Optimal Areas to Automate. Using workforce analytics helps manufacturers introduce workable staffing solutions and monitor their success over time. With this information they can select the optimal areas to automate.
- Reduce Cyber Threats and Data Errors. Deploying a data security solution will help keep data safe from unintentional errors and external cyberattacks. Ironically, many manufacturers suffer greater data issues from their own employees’ errors than from external threats. When combined, specific authorization permissions, security layers over every data level and data rows, and robust data governance policies and procedures will go a long way in reducing costly data problems.
- Improve Decision Making. Using analytics in manufacturing does not only help make effective decision making but also helps resolve operational issues. With easy access to massive amounts of data that has gone through comprehensive data analysis (described in the next section), manufacturers can readily identify their best opportunities, their least efficient processes, and their greatest operational risks.
The Four Levels of Data Analytics
There are four major levels of analytics: descriptive, diagnostic, predictive, and prescriptive. The value increases from the first to fourth level with a corresponding increase in the effort required to use it.
Exhibit 7.2 shows the four levels of data analytics, the value, and the effort required.8
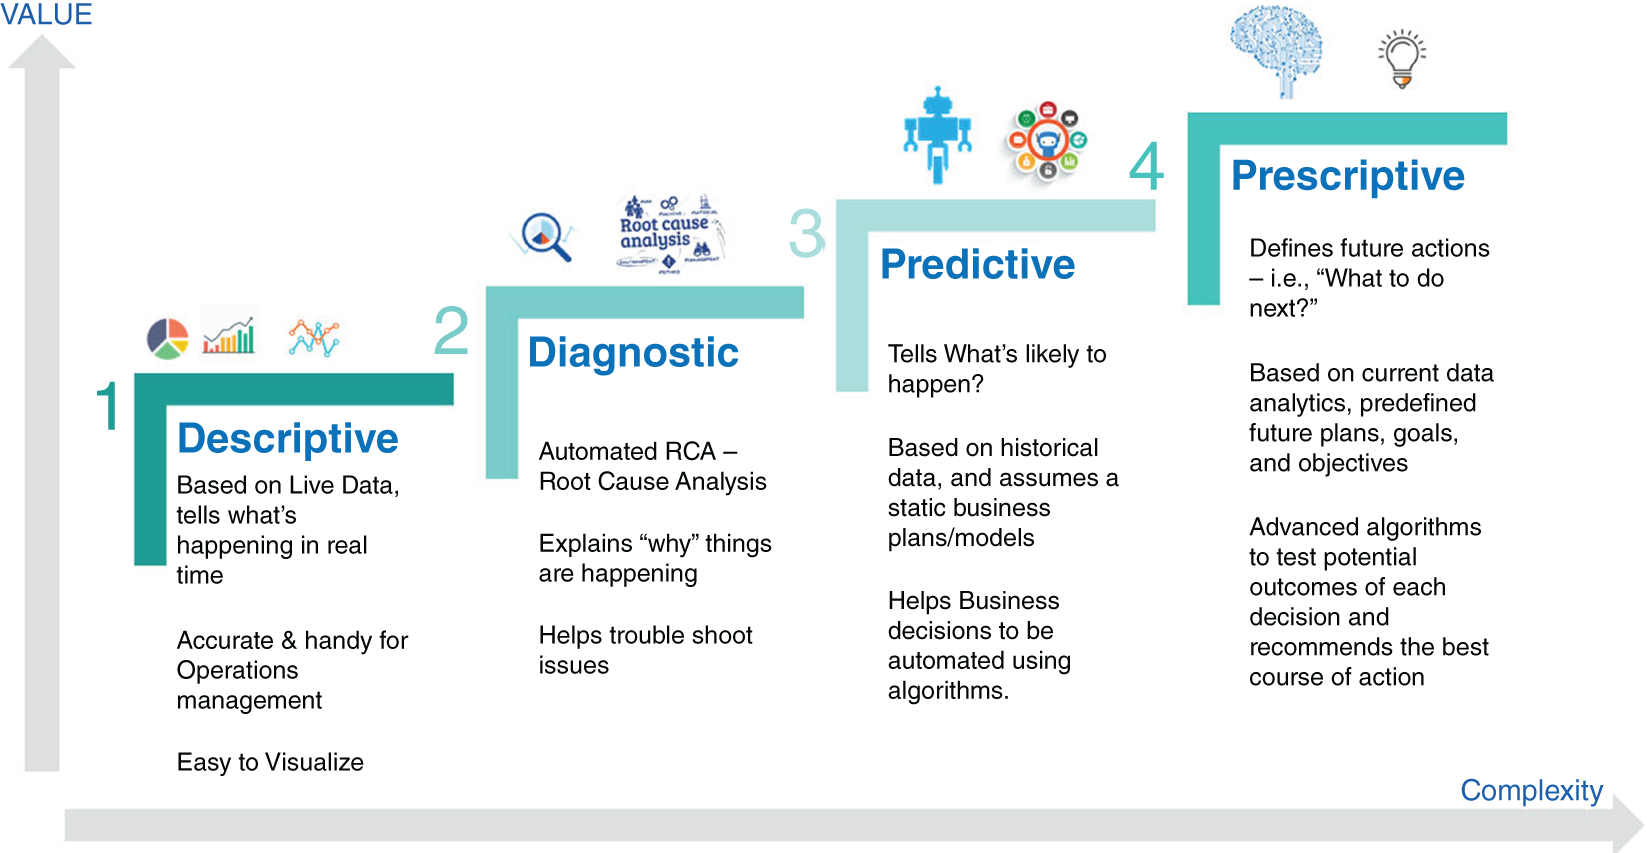
EXHIBIT 7.2 Four levels of data analytics
Source: From Vinit Kachchi and Yogesh Kothiya.
Descriptive Analytics – What Happened?
Descriptive analytics is a frequently used data analysis methodology that utilizes historical data collection, organization, and display to convey information clearly and concisely. In contrast to other analysis techniques, descriptive analytics focuses on what has already occurred in an organization and is not used to make conclusions or predictions from its results. In other words, descriptive analytics is a fundamental building block to inform or prepare data for further analysis.
The simplest way to employ data analytics is to use straightforward mathematics and statistical techniques, such as arithmetic, averages, and percent changes. Using visual tools like line graphs and pie and bar charts, it is possible to communicate results so that a large corporate audience can understand them quickly.
How does descriptive analytics work? The two most often used techniques in descriptive analytics are data aggregation and data mining (also known as data discovery). Data aggregation is the act of gathering and organizing data in order to generate manageable data sets. During the data mining phase, patterns, trends, and meaning are found in the data, and then this information is rendered in an intelligible manner.
The Five Phases of Descriptive Analytics
Descriptive analytics are broken down into five main phases.9
- Business Metrics Identification: The first step is to build metrics that analyze how well a business's goals, such as increasing operational efficiency or boosting revenue, are achieved. Key performance indicator (KPI) governance is critical to the overall effectiveness of descriptive analytics. Without governance, analytics may have a limited influence on decision-making.
- Data Identification: Data is obtained from databases and reports. To correctly gauge KPIs, organizations must record and precompute data sources specific to the business's present condition to derive reliable data and calculate metrics.
- Data Preparation: All the necessary data is gathered and arranged. Normalization, transformation, and cleaning are all important steps prior to analysis. This step can be very labor-intensive, but is necessary.
- Data Processing: Data summarization, clustering, pattern tracking, and regression analysis are employed to discover patterns in the data and assess performance.
- Data Presentation: Charts and graphs are typically employed to display findings that nonanalytic specialists can comprehend.
The Value of Descriptive Analytics
Descriptive analytics is widely utilized within organizations daily. Companies utilize descriptive analytics such as data on inventory, workflow, sales, and revenue to analyze their past operations. Reports of this type make it easy to get a comprehensive picture of an organization's activities.
The use of social analytics is usually an example of descriptive analytics, according to the DeZyre online learning platform.10 One way of understanding descriptive analytics is by studying what people share on social media such as Facebook and Instagram. This study would typically include capturing the number of followers, likes, dislikes, posts, reply posts, and so on.
Surface Data
The primary function of descriptive analytics is to collect surface data and perform a limited analysis of it. Further research and insights drawn from the data are not applicable to prediction and inference. Therefore, descriptive analytics cannot utilize them for either prediction or inference. What this approach is capable of revealing, however, are patterns and significance when data from different time periods are compared.
The Advantages and Disadvantages of Descriptive Analytics
Since descriptive analysis depends solely on historical data and simple computations, it may be performed simply and on a daily basis. Its application does not necessarily require considerable analytical skills. This implies that companies may report on performance reasonably fast and simply and obtain insight into improvements. In general, descriptive analytics is restricted analytics that usually cannot go beyond the data surface.
Diagnostic Analytics – Why Did It Happen?
After learning what happened, the next stage is to understand the reason for what happened. Diagnostic analytics can be challenging because of the need for domain knowledge. To be successful, the analyst must understand a business at a detailed level, including its processes, regulations, policies, target markets, and so on.11
The analyst is like a sleuth. For example, a grocery store experiences a large drop in vanilla ice cream sales in June. This fact was discovered using descriptive analytics. The next stage is for the analyst to investigate why this happened. The drop may have been caused by supply shortages or could have been caused by recent news reports of vanilla ice cream recalls over product contamination. This example demonstrates the hypothesis testing and the domain expertise required to understand why the drop in sales happened.12
Performing diagnostic analytics is especially challenging in larger organizations because departments often function in silos where data sharing is not the norm. This is when good interview skills and techniques will be very helpful. For example, imagine that a doctor examines a patient and just makes an observation that the patient is sick and leaves the room. Of course, good doctors use diagnostic analysis to determine the cause of a sickness. Data analytics works much the same way: the analyst makes an observation, identifies the descriptive analysis, and then moves forward to the diagnosis.13
Using diagnostic tools permits an organization to get the most out of its data by translating complex data into visualizations and insights that anyone in an organization can benefit from. Diagnostic analytics helps gain value from data by asking the right questions and then doing a deep analysis to obtain the answers.
Predictive Analytics – What May Have Happened?
As the name indicates, predictive analytics looks into the future and attempts to anticipate and understand what could happen. Analyzing previous data patterns and trends using historical data and consumer insights may anticipate what will happen in the future and, therefore, inform many business areas, such as creating realistic objectives, effective planning, managing performance expectations, and avoiding risks.
Probability-based predictive analytics is part of the predictive analytics discipline. Predictive analytics seeks to predict future outcomes and the likelihood of those events by employing various techniques, including data mining, statistical modeling (mathematical relationships between variables to predict outcomes), and machine learning algorithms (classification, regression, and clustering techniques). Predictions are made by machine learning algorithms, for example, by attempting to anticipate missing data with the best feasible estimates based on known data. A new type of machine learning, deep learning, resembles the design of human brain networks. Applications for deep learning range from social and environmental analysis for credit scoring to automated processing of digital medical X-rays to anticipate medical diagnoses for clinicians.
Using predictive analytics, organizations are empowered to act more proactively by using data-driven decisions and strategies. Predictive analytics may be used by businesses to do forecasting and trend analysis for various purposes, including predicting consumer behavior and purchasing patterns and detecting sales trends. Just as forecasts help predict such things as supply chain, operations, and inventory demands, predictions may help anticipate those issues as well.
Although predictive analysis cannot achieve 100% accuracy, it can serve as a valuable forecasting and business strategy tool. Many aspects of a business can benefit from predictive analytics, including:
- Forecasting for efficiency
- Customer service and support
- Fraud detection and prevention
- Risk analysis and reduction
Prescriptive Analytics – What Is the Best Next Step?
Descriptive analytics explains what has happened, diagnostic analytics explains why it happened, predictive analytics explains what may happen, prescriptive analytics explains what should be done in a given circumstance. With prescriptive analytics an organization has the information it needs to take action.
Prescriptive analytics uses what was learned in descriptive, diagnostic, and predictive analytics to recommend the best potential courses of action. A high level of specialized analytics expertise is required to be successful. Prescriptive analytics uses artificial intelligence (AI), and specifically machine learning, which incorporates models and algorithms that allow computers to make decisions based on statistical data relationships and patterns.14
Prescriptive analytics systems are powerful and complex, requiring close monitoring and maintenance. There are especially sensitive to data quality issues such as incorrect or missing data, which can lead to false predictions, or inflexible predictions that are poor at handling data changes.15 You should implement data quality standards and keep an eye on the models’ predictions. Because of its complexity, it is not used by many manufacturing organizations, especially SMEs. It definitely requires the help of data scientists.
Examples of popular uses for prescriptive analytics include the following:
- Navigate using GPS to recommend the optimal routes for drivers to reach their destination.
- Track the fluctuations in the price of major commodities like oil and coffee.
- Improve equipment maintenance for capital equipment.
- Advise the advantages of various end-of-life product strategies.
- Optimize product design, pricing, and marketing strategies.
- Test various marketing strategies to determine which ones meet sales targets.
- Estimate how changing various factors impacts product demand.
Future of Big Data Analytics
Increasingly, businesses are turning to data to unearth insights that may help them develop business strategies, make choices, and provide customers with better goods, services, and personalized online experiences. However, when considering the four different descriptive, diagnostic, predictive, and prescriptive analytics techniques, these methodologies’ potential utility is enormous, even though business analytics is a broad field. When utilized in conjunction with one another, these various ways of analysis are very complimentary and vital to the success and survival of any business.
A new phase in the Industrial Revolution, referred to as Industry 4.0, is characterized by a strong emphasis on interconnection, automatization, machine learning, and real-time data. In the context of Industry 4.0, which includes the Internet of Things (IoT), and Smart Manufacturing, physical production and operations are combined with smart digital technology, machine learning, and Big Data to create a more holistic and better-connected ecosystem for companies that focus on manufacturing and supply chain management, among other things. Every organization in the modern world faces a unique set of challenges. Still, they all share a fundamental requirement: the need for connectivity and access to real-time information across processes, partners, products, and people across all industries.
The following areas are some of the critical factors that will dictate the success of Big Data analytics in supporting Industry 4.0 and Smart Manufacturing.
- The Need for Data Governance. The risk of corporations misusing Big Data grows as they acquire vast amounts of information. As a result, many experts believe that data governance will receive increased attention. Peter Ballis, CEO of Sisu Data, shared his beliefs about the role of data governance: “As platforms for analysis and diagnosis expand, derived facts from data will be shared more seamlessly within a business as data governance tools will help ensure the confidentiality, proper use and integrity of data improve to the point they fade into the background again.”16
- The Rise of Augmented Analytics. Gartner analysts believe that augmented analytics will shape Big Data's future trends. Using augmented analytics entails putting AI, machine learning, and natural language processing (NLP) to work on large data platforms. This enables businesses to make better judgments and detect trends more quickly.
- Big Data and Researchers’ Work Coexistence. Many of today's big data systems are so powerful that it's natural for people to anticipate that they will be replaced in the not-too-distant future. Dr. Aidan Slingsby, a senior lecturer and head of a data science degree program at the City University of London, does not believe such an outcome is likely, particularly in applications such as market research employing big data. “Data science helps identify correlations. So data scientists can provide patterns, networks, dependencies that may not have been otherwise known. But, for data science to really add an extra layer of value, it needs a market researcher who understands the context of the information to interpret the ‘what’ from the ‘why.’”17
- Data Will Power Customer Experiences. When it comes to Big Data developments, Cloud computing is a key topic of debate. Following are a few predictions from experts in the know about what's occurring now and what could happen shortly when consumers mix big data with Cloud computing.
According to Nick Piette, director of product marketing and API services at Talend, one of the upcoming trends in Big Data analytics is leveraging the data to improve customer experiences. He also believes that adopting a Cloud-first attitude will be beneficial. Piette says, “More and more brand interactions are happening through digital services, so it's paramount that companies find ways to improve updates and deliver new products and services faster than they ever have before.”18
- Big Data Will Be More Accessible. One of the most significant advantages of Cloud computing is that it allows users to access programs from any location. Andy Monfried, CEO and creator of Lotame, envisions a time when the majority of employees will be able to use self-service Big Data apps.
Monfried explains, “In 20 years, big data analytics will likely be so pervasive throughout business that it will no longer be the domain of specialists. Every manager, and many nonmanagerial employees, will be assumed to be competent in working with big data, just as most knowledge workers today are assumed to know spreadsheets and PowerPoint. Analysis of large data sets will be a prerequisite to almost every business decision, much as a simple cost/benefit analysis is today.”19
He then ties that prediction to Big Data technologies that work in the Cloud. “This doesn't mean, however, that everyone will have to become a data scientist. Self-service tools will make big data analysis broadly accessible. Managers will use simplified, spreadsheet-like interfaces to tap into the computing power of the Cloud and run advanced analytics from any device.”20
- Data Processing and Manipulation. Proper data analytics should avoid “garbage in, garbage out”: inaccurate or incorrect data getting fed into analytical models, and analysts receiving deceiving results. To get the accurate, necessary, and robust data set, data handling will need to start in the beginning. Different methods and tools are required to support the process. Before having walked through the process step by step, one must be equipped with knowledge on what tools are out there to use.
Data Science Tools
Great cooks always have handy knives. Letting different tools handle different tasks is extremely important in the data science pipeline as well. The data pipeline procedures include data collection, data process, and data analytics. This section walks you through the dominant data tools in the market and illustrates how each tool is used in the pipeline. In addition, this section also contains sample codes to facilitate your reading.
- Structured Query Language (SQL). In the data science world, SQL, and its different variations, is the most common language that any data science will use. Its primary function is storing and querying extensive volume data in SQL databases like MySQL, PostgreSQL, and others. In Industry 4.0, a firm could accumulate millions of data records within weeks or days, and it is nearly impossible for Excel to handle that much of data. Having an efficient database to store, retrieve, and update the data is the cornerstone of successful decision-driven data analytics. Using SQL databases, data across multiple departments can be easily aggregated, compared, and used for further analytics purposes. While you are waiting to open an Excel file with 100 megabytes, a SQL database user could have already gained the fundamental insights for that data.
- Python. Python is a potent tool beyond data science. Such incredible power enables Python to be used in every step in the pipeline: from scraping third-party data to the integration of all different data sources or from featuring the existing data to create machine learning analytical reports. While Python can reach the furthest corners of data science and analytics, it is designed for computer science and data analytics beginners.
- Business Intelligence (BI) Tools. Business intelligence tools such as Tableau and PowerBI are meant to transform the most complicated data set into easy-to-read visualization reports. The advantage of BI tools is that they are client-facing products. The designers of these tools are committed to making them easy to use and easy to maintain. Having the ability to connect and consolidate different data sources into one workbook, a user of most BI tools only needs to drag and drop to get the desirable dashboard.
Data Analytics Pipeline
Data pipelines can be described as moving data from one source to another so it can be stored, used for analytics, or combined with other data. Specifically, it is the process to consume, prepare, transform, and, finally, enrich unstructured, structured, and semistructured data in a controlled manner. This section discusses what the pipeline consists of and some details that one should be watching for during the process.
Collection
Collection starts with using different methodologies to grab data and ends with storing them in a data warehouse cleverly. Most analysts don't need to spend too much energy in the data collection process. In most cases, the analysts are the users of the collected data. However, in the managerial level of analytics, data collection/warehousing is a must-know procedure.
A proper data collection process requires a clear business goal. Is our future data for internal use or external use? Which parts of the data are we collecting in a business process? Are we observing the operational data or the production data? What are we trying to achieve with the data we will collect? Are there other data we should acquire to supplement the collected data? Many examples tell the stories of failure when these questions are not properly addressed:
One of my clients uses cameras to gather their business customers’ data. Despite the innovative method that brings significant monitor values to their business customers’ operation, the data itself cannot capture the production results. In another words, when the analytics tell a story about improved operation, their business customers cannot easily find its effect on their production. Now, my client will need to find additional means to collect the production data.
On the other hand, there's always a tradeoff in precision and generics in the design of data warehouses, where collected data is stored. What are the collection sources of your data? What transformation do you need to do before putting those data into a datamart? Do you expect a large volume of data with different build-ups in the future? Without considering these questions, your data management will be chaotic. Data warehouse breakdowns are more likely to happen. Communication of data problems will be more confusing. Data insights will be more difficult to discover. Finally, when you want to renovate your data warehouse to improve efficiency, it is already too big, too complicated, and too costly for you to change.
- Data Service System. The system/method for collecting data also matters. Using data management tools such as CRM tools, vehicle ticketing systems, and so on is usually an easy way to start digitizing your operation and analytics. Often, service providers offer matured data warehouse solutions and maintenance. As soon as the tools are installed in your system, you could immediately understand the basic internal operation of your firm or facility. Without a powerful and highly structured system, integrating these systems with external data will be difficult.
- IoT. With proper design and configuration, IoT devices such as sensors and cameras generate valuable data. I0T configurations may require more technically expert employees to install the hardware, create a data feeding system, and construct a datamart. With technicians familiar with the system, adjustment and optimization of the data collection process is easier to achieve.
- Cleaning and Standardization. In the initial step of a data pipeline, data cleaning and standardization create the foundation for analysis. The first step is to standardize data during the collection and storage process, including designing proper data structures. When dealing with unistructural data, one must not only think about the key components requiring extraction, but also consider initial raw data processing. Is the data stored in the same format, so as to reduce the process time and storage cost, or is the data in a tabular format so that it's easier for the analysts to query? Do the observed components have a constant number of attributes so that the data is in a column-wise format, or is there uncertainty on the collected attributes so a row-wise format table is more flexible? In addition, labeling of variable names requires robust and rigorous standardization. Countless workplace examples have shown that inaccurate labeling jeopardizes analytics efficiency. For example, the same attributes have completely different names when the attributes belong to two different observants. Without a proper dictionary, analysts waste time in communicating to find the definition for each attribute.
The phrase “garbage in, garbage out” describes how flawed data produces flawed results. Unfortunately, even with a rigorous processing of data collection, the data is never clean. Thus, data cleaning is inevitable in order to convert flawed data into usable data. Common areas needing cleaning include dealing with null values, merging different data sets, and unifying timestamps.
Analytical output is the final product presented to the users, who can be managers, stakeholders, customers, and others. In terms of dashboard design, maximizing the users’ reading efficiency, the simplicity of the content is crucial. Removing distractions allows viewers to focus on the essentials more clearly. Standardization means unifying title names, font styles, font sizes, and so on. The analytical products should look professional and clear. Cleaning and standardization not only play a significant role in the design phase but also help analysts across different departments to communicate and collaborate. The color palette is usually a neglected area for standardization. Assigning different colors to the elements in charts is one of the most effective methods to improve usability.
The Benefits of Big Data for SMEs
There are significant benefits for SMEs to adopt Big Data analytics. Some of the good reasons to make the investment are:
- Improved Customer Loyalty from Big Data. Big Data analytics is helping SMEs evaluate customer retention and customer loyalty to uncover changes in buying behaviors. These insights help SMEs maintain their current customers and expand their markets. Big Data can also be used to identify the hidden costs to acquire new customers and clients. This is critical, as the costs of bringing on some new customers may not be worth the travel, entertainment, and many hours to land that first order.21
- Critical Customer Insights from Big Data. Big Data helps SMEs to focus on customer preferences, especially those of their highest-volume customers. Armed with these insights, organizations can personalize product offers, sales, and marketing campaigns, providing a competitive advantage.
- Optimized Decision-Making from Big Data. The growing influence of social media warrants using a Big Data tool called social media data mining to gauge customer interests, assess reactions to quality issues, and evaluate responses to marketing campaigns and promotions. Social media data mining can look at these same factors for major competitors and peer organizations. This is a good way to discover best practices and to avoid landmines – major mistakes your competitors have made. Many organizations, big and small, fail because they miss major moves in the market. Traditional data analysis is reactive. Big Data analytics is proactive and predictive in nature, which helps to get in front of market changes.22
Big Data Tools for SMEs
Large manufacturing and distribution organizations are very adept at using enterprise-level analytics tools. These tools are essential for them to remain viable in today's global marketplace. While SMEs are not candidates for the highest-end platforms, there are good options available to them as well. SMEs will also need to use more affordable and easy-to-use Big Data tools for them to remain viable in today's marketplace. A few examples of suitable tools include:
- Data Integration Tools. For most SMEs, like most larger organizations, data resides in a variety of disparate silos and is not easily extracted, scrubbed, and normalized for analysis. Data integration tools are able to connect siloed data in various locations and in different formats and then transform that data into one data set in one easily accessed location. Data sources may include web traffic, CRM systems, material requirements planning/enterprise resource planning (MRP/ERP) systems, marketing operations software, sales systems, and a variety of other sources.23
- Data Preparation Tools. Because of the disparate nature of data regardless of the number of silos they reside in, many SMEs spend much of their time cleaning data, with few resources available to analyze it. Data preparation tools can help solve this problem by automating the data preparation process, reformatting data, correcting it, and combining data sets.24
- Data Quality Tools. Because data comes in various levels of quality and reliability, data quality tools are essential to bring data up to the level where it valuable for analysis. Valuable insights emerge by eliminating duplicates and normalizing data.25
- Data Governance Tools. Data governance is a collection of processes, standards, policies, procedures, and metrics for the efficient and effective use of information so that an organization can meet its goals and objectives. Data governance helps outline who takes action upon what data, in what situations, and using what methods. It helps improve data quality and the understanding of data. Data governance tools allow SMEs to gain value in their data.
Problems SMEs Face in Adopting Big Data Analytics
There are many data sources and data types available for SMEs. They come in a wide variety of conditions, from poor to high quality levels. For these reasons, data can be misused and misunderstood, which can lead to major problems if not rectified. Michael Keenan, writing in Cyfe, describes some major issues SMEs face in gaining value from Big Data analytics.26
- Hesitancy to Use Data Analytics. Many SMEs fear using data analytics because it is new to them and to their peers. It is doubtful that many of them were exposed to the value of data analytics in their education, training, and conferences they attended. This can also be a generational issue, as the average manufacturing executive is over 45 years old, going to school before the notion of Big Data existed.27 Even today, degrees in data analysis are not offered in many two-year and four-year schools. Another reason for the hesitancy is the hype surrounding Big Data analytics. Manufacturing folks tend to be fairly conservative and have been bombarded for years about the latest and greatest technology that is hyped to solve all their problems.
- Using the Wrong Data Analytics Tools. There are dozens of widely available free reporting tools, but free is a relative term. One of the reasons they are free is that no in-house developers are managing it for you, which means the burden falls on your IT team. If support is offered, it may come at additional costs. Free reporting tools typically lack an intuitive user interface (UI) and are difficult to navigate.28
- Looking at the Wrong Metrics. There is a tendency for large and small organizations alike to measure the wrong metrics. Traditionally, very large and complex organizations measure everything rather than focusing on the critical few metrics key to their success. A good test of whether the correct metrics are being measured is determining whether, when combined, the metrics tell an organization if they are getting better or worse.
A problem prevalent in small organizations is the tendency to focus on vanity metrics such as Instagram followers and Facebook Likes. The best advice in measuring metrics is to focus on the very few key performance metrics, especially forward-looking metrics that help predict future events. For example, the size of the sales pipeline when compared over time is more predictive than measuring bookings or shipments over time.29
- No Longer Asking Why. It is not unusual for long-time business owners to become complacent in their knowledge of market conditions. This is a problem in all sizes and types of organizations. A great example is the complacency of the Big Three American automobile manufacturers in the 1970s and 1980s, which become so complacent that they failed to measure the success of Japanese imports that offered more reliable vehicles at lower costs. Big Data analytics can help even the best-managed organizations to gain valuable new insights.
Best Practices in Data Analytics for SMEs
There are some commonsense best practices in data analytics that have proved their value to SMEs over the years to expose critical business trends. Trend analysis quantifies and explains trends and patterns in a data set over time. A trend is an upward or downward shift in a data set over time. A trend is valuable, as it quantifies and explains data patterns over time. Armed with trend analysis, an organization can take actions to support good trends and address bad ones.
Michael Keenen provides a good list of proven best practices.30
- Measuring Web Traffic Source. A web traffic source tool can show where visitors came from before landing on your website. A direct source is someone visiting your website by typing in its URL. An organic source is through a search engine such as Google. By tracking the sources of traffic, an organization can optimize the effective channels.
- Determining Keyword Rankings. After determining the source of web traffic, it is important to track website keyword rankings. Determining keyword rankings identifies the most popular content.
- Measure Duration of Website Visits. High volumes of visits are of limited value if they only last a few seconds.
- Calculate Percentage of Visitors Converted to Subscriptions. This will help determine the effectiveness of your messaging. Many organizations use website content to move site visitors to subscribers.
- Present Your Data Analytics on Mobile. This is especially important with diverse teams and road warriors who travel frequently.
- Keep Your Data in One Location. This will make it easy to share with your employees, your customers, and your suppliers.
- Create a Data Dashboard. A good data dashboard, accessible to all stakeholders, will provide real-time monitoring of key performance indicators and will give viewers live updates of your most important metrics, be they website traffic, online sales, or active sales funnels.
Summary
Data analytics is a critical component of Smart Manufacturing and Industry 4.0 for a very simple reason. All the new technology creates massive amounts of structured and unstructured data from many different sources. The large volumes, inconsistent quality, and disparate nature of all this new data is far beyond the scope of traditional data analytics. Big Data analytics has proven its utility in analyzing data for large and small manufacturing organizations alike. While most of the powerful data analytics tool require the help of talented data scientists, SMEs can enjoy the benefits of Big Data by availing themselves of a variety of affordable and easy-to-use analytic tools to lower operating costs, increase market share, and reduce quality issues.
Sample Questions
- Tableau and PowerBI are examples of
- Python providers
- Business intelligence tools
- Machine learning tools
- Prescriptive analytics tools
- The first references to Big Data were in 2003 from
- Stanford
- Harvard
- UC Berkeley
- MIT
- “A process to examine, transform, and arrange a data set to permit studying its individual components and then extracting useful information” is the definition of
- Data Analytics
- Big Data
- Data processing and manipulation
- Data analysis
- Why is structured data easier to analyze than unstructured data?
- It resides in a datamart.
- It resides in a database.
- It resides in a relational database.
- It resides anywhere.
- An example of untrusted data is
- ZIP codes
- Instant messages
- Item masters
- Social Security numbers
- Descriptive analytics explains
- Why it happened
- How it happened
- What could have happened
- None of the above
- Why is data analytics important to manufacturing?
- The volume of distributed data collected from a variety of sources is growing.
- The existing visualization and interaction tools cannot handle the growing volumes of data.
- Gateways are overloaded by new industrial control systems and connected tools.
- All of the above
- Of the four levels of data analytics, which is the simplest?
- Prescriptive
- Predictive
- Diagnostic
- Descriptive
- The quantity of data accessible is expected to double how often?
- Every four years
- Every six months
- Every two years
- Every month
- Moving data from one source to another so it can be stored, used for analytics, or combined with other data is one definition of
- Data pipelines
- Data migration
- Data normalization
- Data scrubbing
Notes
- 1. Foote, K. (December 14, 2017). A brief history of Big Data. DataVersity. https://medium.com/callforcode/the-amount-of-data-in-the-world-doubles-every-two-years-3c0be9263eb1.
- 2. What's the difference between data analytics and data analysis? (January 23, 2020). GetSmarter. https://www.getsmarter.com/blog/career-advice/difference-data-analytics-data-analysis/.
- 3. Taylor, C. (May 21, 2021). Structured vs. unstructured data. Datamation. https://www.datamation.com/big-data/structured-vs-unstructured-data/.
- 4. Gallenger, B. (October 7, 2020). The amount of data in the world doubles every two years. Call for Code Digest. https://medium.com/callforcode/the-amount-of-data-in-the-world-doubles-every-two-years-3c0be9263eb1.
- 5. Coughlin, T. (November 27, 2018). 175 zettabytes by 2025. Forbes. https://www.forbes.com/sites/tomcoughlin/2018/11/27/175-zettabytes-by-2025/?sh=4cdf41c05459.
- 6. Chojecki, P. (January 31, 2019). How big is Big Data? Towards Data Science. https://towardsdatascience.com/how-big-is-big-data-3fb14d5351ba.
- 7. Vyas, B. (February 24, 2021). Why the manufacturing industry should embrace data analytics. Soft Web Solutions. https://www.softwebsolutions.com/resources/data-analytics-in-manufacturing.html.
- 8. Kachchi, V., and Kothiya, Y. (May 8, 2021). 4 types of data analytics every analyst should know – descriptive, diagnostic, predictive, prescriptive. Medium. https://medium.com/co-learning-lounge/types-of-data-analytics-descriptive-diagnostic-predictive-prescriptive-922654ce8f8f.
- 9. Shung, K. (May 20, 2020). Four levels of analytics/data science. Building Intelligence Together. https://koopingshung.com/blog/four-levels-of-analytics-data-science-descriptive-diagnostic/.
- 10. DeZyre. Data science course. ProjectPro. https://www.dezyre.com/data-science-training-course-online/36.
- 11. Shung, Four levels.
- 12. Ibid.
- 13. Ibid.
- 14. Prescriptive analytics guide: Use cases & examples. Stitch. https://www.stitchdata.com/resources/prescriptive-analytics/ (accessed September 2, 2021).
- 15. Ibid.
- 16. Matthews, K. (June 9, 2020). 6 important big data future trends, according to experts. Smart Data Collective. https://www.smartdatacollective.com/6-important-big-data-future-trends/.
- 17. Ibid.
- 18. Ibid.
- 19. Expert predictions: The future of Big Data and business 20 years from now. The Future of Everything. https://www.futureofeverything.io/expert-predictions-the-future-of-big-data-and-business-20-years-from-now/.
- 20. Ibid.
- 21. How big data benefits small business. Talend. https://www.talend.com/resources/big-data-small-business/.
- 22. Ibid.
- 23. Morris, A. (April 16, 2021). 23 case studies and real-world examples of how business intelligence keeps top companies competitive. NetSuite. https://www.netsuite.com/portal/resource/articles/business-strategy/business-intelligence-examples.shtml.
- 24. King, T. (March 16, 2021). The 10 best data preparation tools and software for 2021. Solutions Review. https://solutionsreview.com/data-integration/the-best-data-preparation-tools-and-software/.
- 25. How big data benefits small business.
- 26. Keenan, M. (May 13, 2020). Small business analytics: 4 ugly truths and 6 best practices. cyfe. https://www.cyfe.com/blog/5-ugly-truths-small-business-analytics/.
- 27. Vice president of manufacturing: Demographics and statistics in the US. Zippia. https://www.zippia.com/vice-president-of-manufacturing-jobs/demographics/.
- 28. Adair, B. Open source reporting tools: Pros and cons. SelectHub. https://www.selecthub.com/business-intelligence/pros-cons-open-source-reporting-tools/.
- 29. Keenan, Small business analytics.
- 30. Ibid.