CHAPTER 8
Industrial Internet of Things (IIoT) Sensors
Deb Walkup and Jeff Little
Introduction
Human history is full of attempts to better understand and monitor our environment, often involving the development of objects and technologies to observe, measure, monitor, and predict our environment. Early civilizations developed a number of ways to monitor time and the seasons; Stonehenge is an example. Taking advantage of a naturally occurring glacial scar in the landscape of the Salisbury Plain, the ancient Britons used this landmark to measure time and predict the seasons, in particular, the Winter Solstice. They built the monument we see today over a period of centuries to enhance this prediction capability. Today, while most people use the monument to note the Summer Solstice, it was actually the Winter Solstice that the ancients were concerned about, as it marks the end of shortened of days and the beginning of longer days, leading to summer and the times for planting and harvest.
Throughout history, other measurement and monitoring devices have been created to monitor data both seen and unseen. Some common examples are:
- Telescopes to see things that are far away
- Compasses to measure directions
- Thermometers to measure temperature
- Barometers to measure air pressure to monitor and predict the weather
- Microscopes to see things invisible to the naked eye
In the age of electronics, these devices, along with thousands of other kinds of sensors, have all been designed to communicate electronically by a variety of means. When combining these electronically connected sensors with networking, computers, and application software, we have a technology that is now called the Internet of Things, or IoT, meaning that networking no longer involves just humans and computers. It now includes anything that can provide data to a network/computer complex for monitoring and control through electronic communications.
The origin of the term Internet of Things or IoT has been attributed to several sources. The two most likely are:
- The concept of and term Internet of Things first appears in a speech given by Peter T. Lewis in Washington, DC, in September 1985.
- The actual term “Internet of Things” was coined by Kevin Ashton in 1999 during his work at Procter & Gamble. Ashton, who was working in supply chain optimization, wanted to attract senior management's attention to an exciting new technology called radio-frequency identification (RFID).
Industrial Internet of Things (IIoT) refers to the use of IoT in industrial contexts. It is also called “ubiquitous computing,” a term first coined in an article by Mark Weiser in 1991 and described in detail in a 1994 IEEE article by Reza Raji.1 The Industrial Internet Consortium (IIC) was founded in March of 2014. This is not a standards organization. It brings together a number of major industry players such as AT&T, Cisco Systems, General Electric, IBM, and Intel as well as innovators from academia and governments to accelerate the development, adoption, and use of IIoT technologies. The IIC created the Industrial Internet Reference Architecture (IIRA) in 2015. The current version can be found at https://www.iiconsortium.org/IIRA.htm.2
The IIRA is an extensive discussion of all aspects of IIoT, including technical, business, and best practices.
PLCs
The beginning of industrial automation and the use of sensors to monitor and control processes and equipment in an industrial setting is generally thought to be the invention of a programmable logic controller (PLC), the Modicon 084, invented by Dick Morley for General Motors in 1968. The PLC is a ruggedized device with inputs and outputs that can be programmed to control machine operations. An input would run through a program stored in nonvolatile memory and an output would be sent back to a machine.
Exhibit 8.1 shows an early PLC.
Relay logic systems made up of hard-wired relays, cam timers, and mechanical drum sequencers were difficult to set up and maintain and were often unreliable. The Modicon used software programming to replace the hardwiring and difficult “programming” of mechanical devices like cams and drums. Over the years, PLCs improved in reliability, ease of programming, and capability. They are still widely used in industry today and range from large modular systems to single-board computers such as the Raspberry Pi, and even single-chip controllers such as the Nano ACE PLC from Data Device Corporation (DDC).3
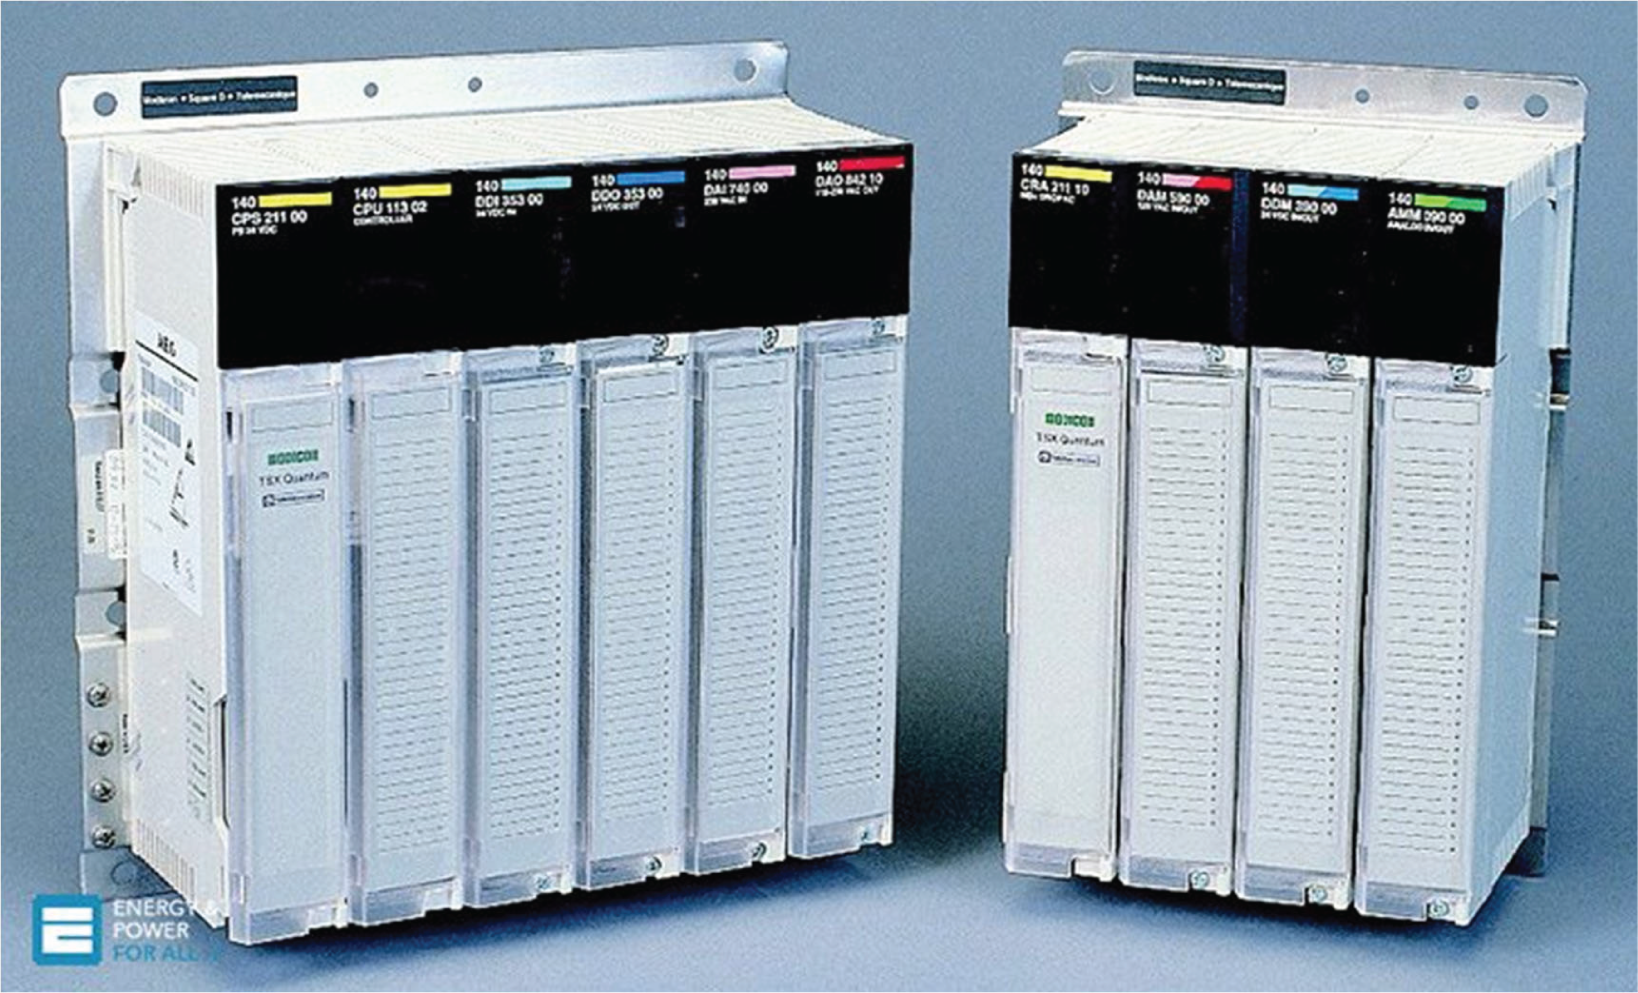
EXHIBIT 8.1 An early PLC
A great example of sensors revolutionizing an industry is the introduction of dive computers in 1983. The first dive computer was the Orca Edge. Prior to the use of dive computers, a diver would plan a dive that would follow a profile. A typical recreational dive lasts about 50 minutes, and a diver would plan on going to the deepest depth first (about 60 feet) and then working to more shallow depths with an estimate of how long they would be at each depth, with a 3-minute safety stop at 10 feet. The reason for this is that nitrogen builds up in a diver's body tissue the deeper they go and the longer they stay at depth. This can cause the bends, which can lead to death.
Divers would then use a table with depths and times to calculate the amount of nitrogen they would absorb. The use of the tables and simple profiles was a very conservative way of calculating the nitrogen level. With a dive computer you measure the exact depth and time for each second of the dive; with this more granular level of data, divers had a much better idea of their actual nitrogen absorption and could do more dives per day safely. Dive computers are now integrated in websites and logbooks to also record all dives with GPS tracking. An added level of safety locks a dive computer when a diver exceeds recreational limits or surfaces too fast, or the dive profile doesn't include the safety stop for outgassing. Operators will not allow a diver back into the water if their computer is maxed out. Even diving without an operator, a diver should cease diving until the computer clears. The upside is that it is possible to take a one- to two-week-long vacation on a live-aboard dive boat and safely dive up to five times a day. An entire industry was born.
Carnegie Mellon
The next leap in IoT technology happened with the introduction of the Ethernet in 1980 and a Coca-Cola machine at Carnegie Mellon University. By building a device to sense the lights indicating inventory levels for the columns of Coke in the machine, and connecting that data to the Ethernet, students David Nichols, Mike Kazar, and Ivor Durham, with the help of research engineer John Zsarnay, were able to build a device that monitored the lights for each row of the vending machine. A light going on and off was just someone buying a Coke. A light staying on for more than five seconds meant that the column was empty, and when the light went off the machine had been refilled and it would be three hours before the bottles were cold. Anyone at the university with access to the Ethernet, later extended to the ARPANET, could see the status of the machine and know whether it was worth walking across campus to get a cold Coke.4
Consumer-Oriented IoT
In 1985, a new company called Cloud Nine (CL 9) was founded by Steve Wozniak, one of the founders of Apple Computer. His dream was to have a universal control and monitoring technology that could allow a person to control various aspects of their home through their personal computer or a simple universal remote. This would include things like radio, stereo, TV, and video players, and eventually also lights, garage doors, security systems, and thermostats. Even kitchen appliances were included in this vision. While CL 9's intellectual property was eventually sold in 1988 and its other assets sold at auction, the idea had caught on.
In 1988, another new company called Echelon was founded to produce a technology called LonWorks. Lon stands for local operating network. This was a technology created for control applications using network technologies such as twisted pair cabling, high frequency over AC power lines, fiber optics, and radio. It was introduced as a technology for home and office building automation to control things like lighting, HVAC, security, and so on, but it is sometimes reported that its biggest successes were the control technology for lighting and special effects used in live stage events such as rock concerts and used by AC power utilities to manage their smart meters in certain countries in the EU. In 2010 it was reported that there were 90 million Lon-enabled devices installed. But this installed base has declined in recent years and in 2018 Echelon was acquired by Adesto Technologies.
Webcams
The first webcam was created at the University of Cambridge in the early 1990s to monitor a coffeepot. The coffee station serviced several labs in the building on multiple floors and no one enjoyed making the trip for a cup and finding the pot empty.
Exhibit 8.2 shows a sample of the images taken by this webcam.
Exhibit 8.3 shows Dr. Paul Jarderzky's setup of a Philips camera, to capture an image of the coffeepot three times per minute.
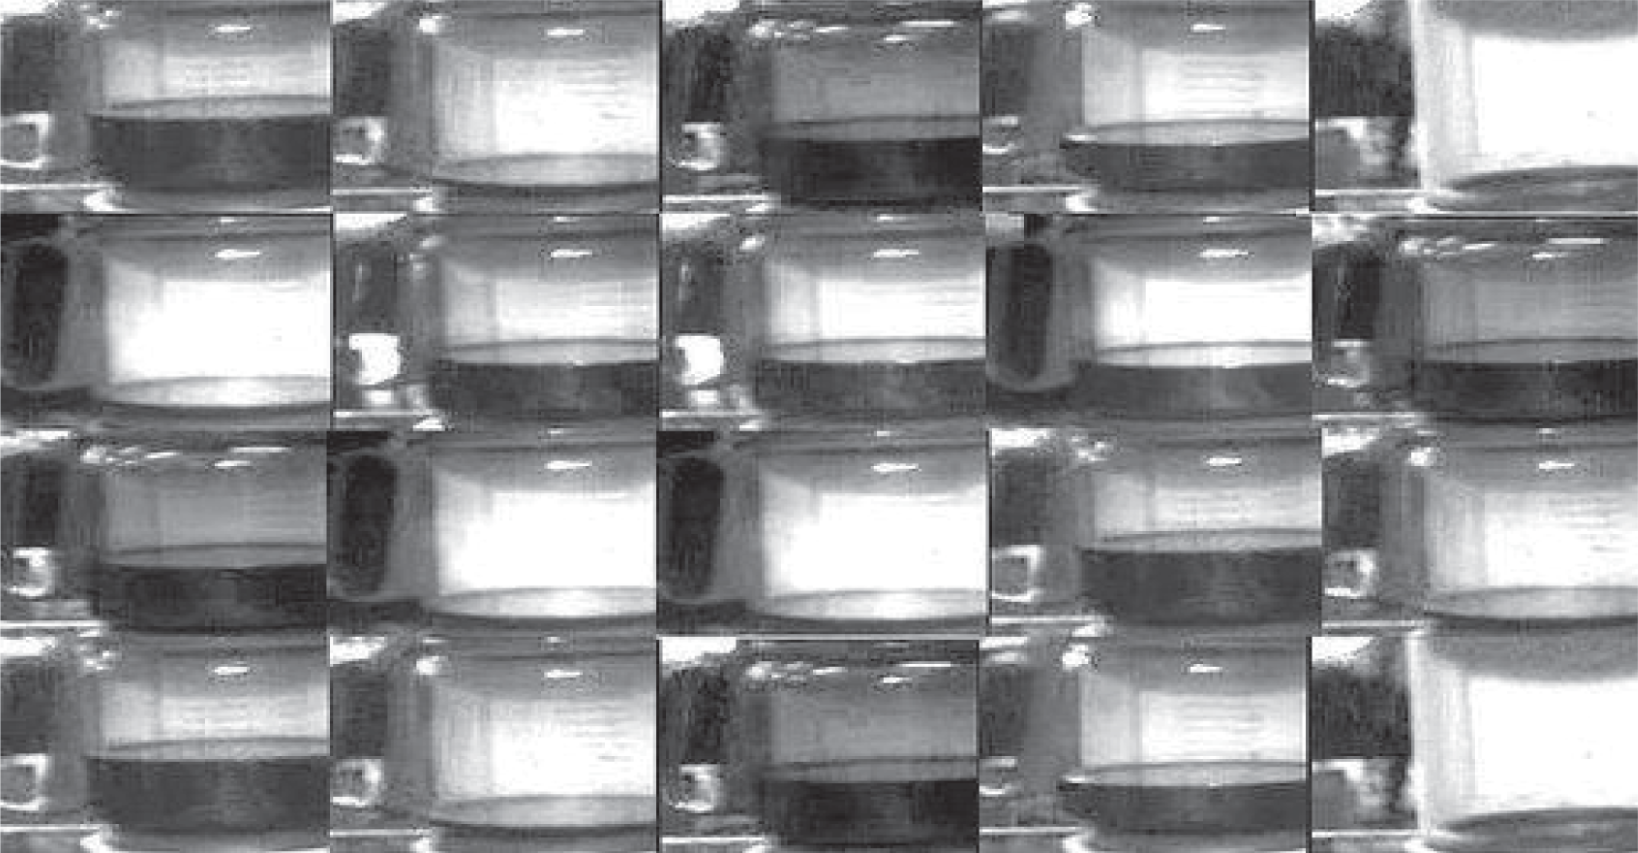
EXHIBIT 8.2 Sample webcam images
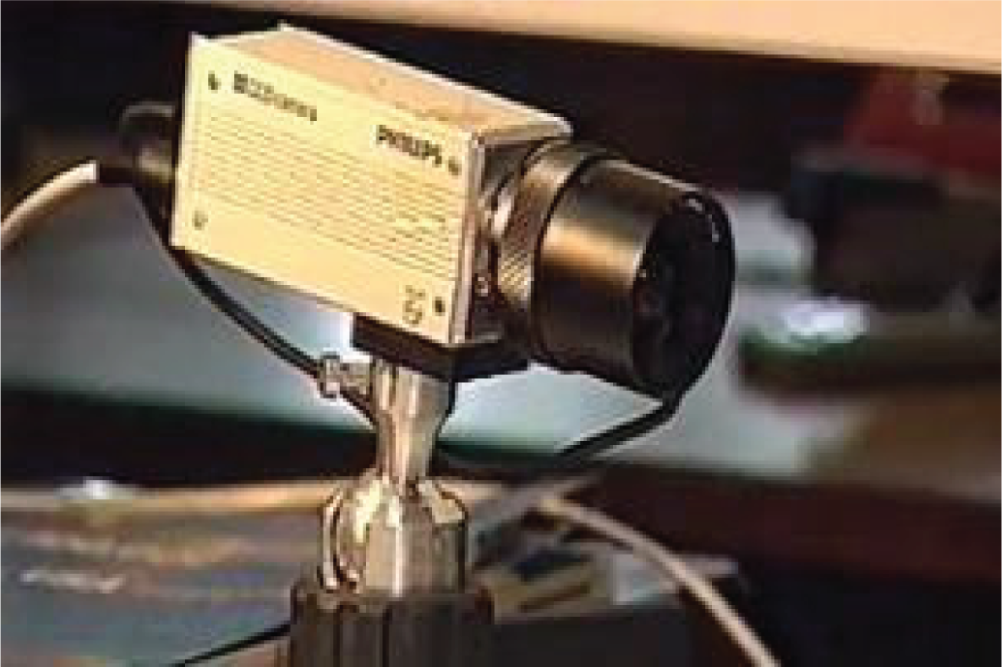
EXHIBIT 8.3 Dr. Paul Jarderzky's Philips camera
Dr. Quentin Stafford-Fraser, along with Dr. Jardetzky, created the software to serve the images to the Ethernet at Cambridge. In November of 1993, Dr. Martyn Johnson, who was not connected to the internal network, wrote the code that served the images to the World Wide Web (WWW). The program started with about 12 lines of code and anyone in the world could hit the website and see if there was coffee for the lab staff. This is most likely the first viral web sensation. Tech enthusiasts from around the world were checking it out and sharing it with their friends. There were requests to add a light to the area so that the status was visible at night when the other side of the world was awake.
Exhibit 8.4 shows the final image broadcast of a scientist's fingers pressing the “off” button.5

EXHIBIT 8.4 The final coffeepot image
IIoT -Enabling Technologies
It was a natural evolution for PLCs and similar monitor/control systems to tie into communications technologies and eventually the Internet. With the emergence of Cloud technology around 2002, the ability to gather and process large amounts of data permitted a number of new capabilities to be applied to the industrial context. These included things like monitoring historical trends, predicting when maintenance or replacement might be needed on machines and tooling, efficiency studies, and safety alerts.
The number of technologies that enable and can be used in an IIoT environment are many and varied. Following is a listing of just a few. The key aspect is that the element being used to support IIoT generally has some form of electronic or RF communication capability so that it can report data without human intervention and may also receive commands to establish thresholds, perform actions, or adjust settings without human intervention. Some examples of these enabling technologies are:
- Smart Sensors. Both analog and digital sensors with embedded controls are available for hundreds of applications. These use transmission technologies such as TCP/IP or other network technology, Wi-Fi, cellular, and Bluetooth. The most versatile and prolific sensors are cameras that can record still images or video.
- High-Speed Secure Communications. When sending data to the Cloud, it is important to ensure the security of that data; Chapter 5 presents the important aspects of data and network security. Based on the amount of data and the time frame for transmission, the network should have the speed and bandwidth to accommodate the data in a timely manner.
- Edge Computing. Performing analysis of the data at the source can reduce the amount of data sent to the Cloud as well as provide near-real-time alerts and exceptions to make corrections as soon as possible. For safety and/or security applications this is vital. This is covered in Chapter 11, “Edge Computing,” by Vatsal Shah and Allison Yrungaray.
- Cloud Computing. This is connecting to the Cloud through the Internet to deliver data for later analysis. This analysis will provide feedback to the IIoT implementation that allows the IIoT devices to take appropriate actions without direct human intervention.
- Big Data Analytics. The real power in more and better data is being able to analyze historical data and understand trends. Analytics can be performed in the Cloud or at the Edge. This is covered in Chapter 7, “Big Data for Small, Midsize, and Large Operations,” by Omar Abdon and Randy Shi.
- Artificial Intelligence and Machine Learning. Machine learning is used to build models that can be used with artificial intelligence (AI) to determine whether processes are going smoothly, not quite right, or horrendously out of control. This can be supported at the Edge or in the Cloud. Edge analysis provides much faster feedback at the site. This is covered in Chapter 9, “Artificial Intelligence, Machine Learning, and Computer Vision,” by Steven Herman.
- Cyber-Physical Systems (CPSs). CPS is an intelligent and/or computer system that monitors and/or controls a mechanism and/or process through computer-based algorithms. CPS involves the merger of cybernetics, mechatronics, and design and process science through a multidisciplinary approach. This is the integration of physical functions and processes with communications, software, sensors, and so on. Examples include autonomous automobiles, industrial control systems, robotics, and auto pilots in aviation. This is covered in Chapter 5, “Improving Cybersecurity Using Smart Technology,” by Craig Martin.
- A Layered IIoT Architecture. As mentioned previously, the Industrial Internet Consortium (IIC) has published the Industrial Internet Reference Architecture (IIRA), which is an extensive discussion of all aspects of IIOT, including technical, business, and best practices. But similar to the kinds of layered architectural models found in networking, IIoT can also be described by a simple model with four layers.6
Exhibit 8.5 shows the four layers used in IIoT.
EXHIBIT 8.5 Four layers of IIoT
| Layer Number | Layer Name | Function |
|---|---|---|
| 1 | Content | User interface devices: computer screens, point of sale stations, tablets, smart glasses, 3D goggles, smart surfaces, etc. |
| 2 | Service | Applications: software to analyze data and transform it into actionable information |
| 3 | Network | Communication protocols: Wi-Fi, Bluetooth, Ethernet, cellular, etc. |
| 4 | Device | Hardware: computers, network gear, cyber-physical systems, machines, sensors, etc. |
A wide variety of IIoT implementations can be modeled using this simple layered model structure.
IIoT Platform Building Blocks
From a platform perspective the services needed for IIoT are:
- Device Connectivity. How are devices connected to the network and how is the data being captured consistently?
- Edge Analytics. Performing analytics at the Edge to provide immediate feedback makes every IIoT scenario more valuable and effective.
- Data Integration. Is there a normalized set of data elements so that different data elements can be combined efficiently? An example is taking data from three different sensors and understanding the state based on that data by timestamp.
- Application Deployment. Applications are the secret sauce that differentiate competitors in the IIoT market. The applications can be a combination of native code and third-party plug-ins. A typical example is capturing license plates using a third-party app and then using that data to understand the movement of vehicles through a yard and the duration at each point of interest. An example is a parking lot that provides parking for a fee. With a timestamp of each vehicle entering and leaving the lot, you have accurate data for how long the vehicle was there and there is no ticket to lose. In the event the driver leaves without paying you also have the license plate to tie the charge back to a vehicle and an owner.
Inputs to the platform might include data from:
- Sensors
- PLCs
- Manufacturing execution systems (MESs)
- Enterprise resource planning systems (ERPs)
- Materials requirement planning systems (MRPs)
- Historical databases
- Services the platform should provide include:
- Cloud services
- Big Data
- Machine learning
- Applications
IIoT Sensors
A wide range of IIOT sensors are available today. Sensors have evolved from manual devices to analog components to digital semiconductor devices. The addition of cameras, as sensors, allows visual capture of manual devices and for the collection of data from existing components of your manufacturing environment. This allows a company to embark on an IIoT path without a complete revolution in the sensors and devices in current use.
Virtually any phenomena that can be measured now has a sensor that can monitor, record, and report that measurement. The following list is just a representative example of the phenomena that can be sensed by modern sensors today.
- Light. Different sensors can measure different kinds of light, including infrared, visible, and ultraviolet, as well as distinct colors or light frequencies only. This was a component of the Carnegie Mellon Coke machine monitoring in the 1980s.
- Current Sensor. Current sensors can be used to capture the power utilization of machines. Even a machine that is plugged in and unused draws power and uses energy. By capturing the power usage profile of machines and having a better understanding of how they are utilized and combining that information with smart switches, a machine shop could reduce their power consumption without a decrease in service levels.
- Smoke and Gas Detectors. Common examples are the smoke detectors and carbon monoxide detectors found in homes. But there are many different kinds that can also measure many different gases and types of smoke and fumes. Gas detectors can be for specific gases and provide a level of safety in the event of a leak of toxic gas. A detector can also enable a cost savings if an expensive gas is leaking.
In industrial environments a thermal or infrared sensor could provide better and faster discovery of combustion. These sensors can identify the location of a hot spot before it ignites and before there is enough smoke to trigger a detector on the ceiling. An example is a paper recycling center. If a fire is started in this environment, by the time a smoke detector is triggered the building is lost; the goal is to get people out to safety.
- Alcohol Sensor. This sensor measures the amount of alcohol in a fluid, which is very useful in brewing and winemaking.
- Strain. This is a sensor that can measure the mechanical strain or force exerted on the sensor. This can be used to measure the mechanical strain in structures or machines.
- Weight. Weight is the basic element of a scale; there are many variations of scales that cover weights from micro-ounces to tons. In yard applications this sensor can be used to measure tare (unladen) weights of vehicles and loaded weights and then an application can compare the difference and match it with the invoiced quantity to ensure that accurate amounts are provided to customers and all amounts are paid for.
- Pressure. A pressure sensor can be used to measure the pressure in different enclosed spaces for air or fluids like oil and water. For presses or injection molding machines it can measure the pressure being applied mechanically. If the pressure is outside target limits, it could mean that maintenance is required. A common vehicle example is the air pressure sensor that measures the pressure in the tires on a continuous basis and engages a dashboard light when the pressure is too high or low.
- Proximity. These sophisticated measurement sensors often use lasers or ultrasonic sound waves to measure the distance between objects. An example is enforcing social distancing requirements of six-foot spacing between people on the factory or warehouse floor. Another common example is the sensors in the rear of vehicles that warn of close objects in the path of the vehicle when backing up, especially when they are in a blind spot.
- Position. Position sensors measure position by mechanical, optical, or other means. They are used to determine if something is in a particular position. An example could be an asphalt machine working on road resurfacing. Having an indicator that the machine is aligned with the road and moving in the right direction would be helpful.
- Humidity. A humidity sensor measures the humidity in the air or in any gaseous environment.
- Sound. Typically a sound sensor is a microphone using acoustic pressure sensors, pressure microphones, high-amplitude pressure microphone, prepolarized condenser microphones, high-amplitude pressure microphones, probe microphones, condenser microphones, and prepolarized free-field condenser microphones. These devices can measure sounds that are audible to humans, subsonic sounds (below the audible range of humans), and/or ultrasonic sound (above the audible range of humans). You could use this type of sensor to answer the age-old question, “If a tree falls in the woods and no one is there, does it make a sound?”
- Lidar. By measuring distances using the time it takes for a laser to bounce off a surface, this technology can create a map of the ocean floor or an accurate representation of material in a closed bin or silo so that a volume can be calculated for material that isn't visible. An example is a cement plant that has different silos for cement, fly ash, and aggregate. By using lidar, the amount of material in the silos is a known entity and not a guess and replenishment is much more accurate. This technology is also used in self-driving vehicles to help in navigation.
- Passive Infrared Sensor (PIR). A PIR is an electronic sensor that can measure the infrared light being radiated from an object within its field of view.
- Flow and Level. A flow and level sensor can measure the flow and/or the level of gas or liquid in a pipe or container. A couple of common examples are the sensor that measures the amount of gas in a gas tank, and the gas meter on a house that measures the amount of gas consumed.
- Accelerometer. This sensor measures the change in velocity of an object to detect abnormal vibrations in rotating machines, which can indicate that maintenance is required. They are also used in tablets and video games to detect a change in velocity. For a tablet, this means always showing the display correctly and in games it provides feedback to the game of the user's motion.
- Radio-Frequency Identification (RFID). An RFID sensor uses electromagnetic fields to automatically identify and track tags attached to objects. An RFID system consists of a tiny radio transponder, a radio receiver, and a transmitter. When triggered by an electromagnetic interrogation pulse from a nearby RFID reader device, the tag transmits digital data, usually an identifying inventory number, back to the reader. This number can be used to track inventory goods. Passive tags are powered by energy from the RFID reader's interrogating radio waves. Active tags are powered by a battery and thus can be read at a greater range from the RFID reader, up to hundreds of meters.7
- Barcode Reader. This is a specialized reader for barcodes, optically readable labels that can carry an ID or tracking number. The most common example can be found in the supermarket checkout stand. A common use is to identify retail goods at the checkout stand of a store so that the checkout person does not have to key in the identity of the goods being purchased. Barcodes are also used in shipping and warehousing to identify cartons, pallets, and containers. Barcodes are also readable by cameras; they don't always need a reader to work.
- Quick Response (QR) Codes. QR codes are a type of matrix barcode that can be read by a camera attached to a sensor that can do the appropriate decoding. They were invented to support high-speed component scanning. Today they are widely used with smartphones. QR codes can carry more information than ordinary barcodes, as well as hyperlinks to more information.
- Temperature Sensors. Digital temperature sensors are common, and most off-the-shelf sensors will use a device mounted on a circuit board inside a mechanical assembly. Digital devices typically measure temperature between –55° C and 150° C. Exhibit 8.6, an excerpt from an Analog Devices datasheet,8 shows an example of one kind of digital temperature sensor.
Analog temperature sensors include thermistors, thermocouples, resistance thermometers, and silicon bandgap temperature sensors. A thermistor is a type of resistor whose resistance is strongly dependent on temperature, more so than in standard resistors. The word is a combination of thermal and resistor. Other types of analog temperature sensors vary a voltage according to the temperature. This can be a voltage either created by the sensor or measured across the sensor.
A typical temperature sensor application is in cold chain logistics. Some products, such as produce, require cooler temperatures to maintain freshness in transport. It is now possible to track the temperature of a refrigerated container as it moves across distances and different modes of transportation. The data is uploaded to the Cloud and an audit trail of the entire trip is available with alerts if the temperature falls outside the specific range – too cold and vegetables freeze; too hot and they go bad.
Exhibit 8.7 shows the specifications for five types of temperature sensors.
- Cameras (Vision Sensor). The most versatile sensors used to capture IIoT data are cameras. With machine learning, cameras can become almost any type of sensing device. They can be used to capture still images or video. A camera can capture an image to show if a light is on or what color it is. A video can capture whether it is solid or flashing. Cameras can capture barcodes, QR codes, or text, and algorithms can be used to translate those images into values and data strings. Cameras can capture temperature readings, scale readings, dials, and gauges, and time-stamp those images. A group of images can be aggregated to understand processes. An example is a machine in idle mode. Whether an operator is present, what status the stack light is displaying, whether there is material to feed the machine, are all elements that can be combined to determine if the machine is in setup, being ignored, or planned to be idle.
Pairing these images with AI algorithms and computer vision you can monitor older manual sensors, safety issues, work in progress, quality control, inventory, and shipping. There are a lot of cameras on the market and there are more every day.
Three different types of cameras are available. An area scan camera takes an image of an area using a rectangular sensor. Line scan cameras take an image of one row of pixels and then stitch multiple images together to make videos (used for continuous process operations). The third is embedded smart cameras that can be either area or line scan and they are integrated into an Edge computing device.

EXHIBIT 8.6 Specifications for a low-cost temperature sensor switch
EXHIBIT 8.7 Temperature sensor specifications
| Temperature Sensor | Temperature Range | Output | Comments |
|---|---|---|---|
| Digital IC device | –55 to 150° C9 | Voltage | Most common |
| Thermistor | –100 to 300° C10 | Resistance | Ruggedized and immersible |
| Thermocouples | –200 to 2,500° C11 in continuous operation | Voltage | Well adapted to high temperatures |
| Resistance thermometers | –200 to 500° C12 | Resistance | Also called RTDs (resistance temperature detectors) |
| Silicon bandgap temperature sensors | Up to 250° C13 | Voltage | Often used to measure the temperature of a silicon chip that the sensor is part of. |
There are two types of sensors used, CCD and CMOS. CCD sensors capture an array of data and process it serially, and CMOS captures pixels and processes them in parallel. CCDs tend to be used in cameras that focus on high-quality images with lots of pixels and excellent light sensitivity. CMOS sensors traditionally have lower quality, lower resolution, and lower sensitivity. CMOS sensors are just now improving to the point where they reach near parity with CCD devices in some applications. CMOS cameras are usually less expensive and have great battery life.14 Most phone cameras today have a CMOS because of the speed and battery life.
Sensor size matters. It's not just a matter of megapixels; the size of the sensor determines how much light is captured, which is a big factor in the quality of the image. Larger sensors are more expensive and require more space in the camera. Smaller sensors are typically paired with wide-angle lenses, which can introduce distortion to the image.
How the camera is mounted is very important. Most applications require a fixed camera with a study mount that will not be in the way of workers, processes, or hazardous environments (some cameras can be mounted in housings for placement in hazardous environments). Cleaning is also important, so you will need to access the camera or housing for scheduled cleaning.
Lighting the work area is critical if you are comparing images over time. An example is an outdoor application like an airport, where the sky may be overcast, it could be raining or snowing, or the sun could just be moving across the sky during the day. Even indoors the lights surrounding your area of interest could affect what is captured by the camera. Lights may go on and off, or flicker. Lighting can be provided to compensate for variations. An example is at the toll booth in a parking lot. A bright light comes on and a photo is taken of the license plate for reference, and this works in all conditions.
The field of view is dependent on the lens used with the camera and represents the angular size of the view cone. A large angle or wide-angle lens will introduce distortion of the image. Integrating data from a camera requires an understanding of the transmission interface.
Exhibit 8.8 shows a list of some of the common transmission interfaces for cameras.
EXHIBIT 8.8 Common transmission interfaces
| Transmission Interface | Year Created | License Required | Underlying Protocols | Maintenance Association | Connection | Portable Computing Language |
|---|---|---|---|---|---|---|
| GigE Vision | 2006 | Yes | TCPIP, UDP | AIA | Ethernet | No |
| USB 3.0 | 2013 | No | USB Implementation Forum | USB | Yes/No | |
| CameraLink | 2000 | No | Channel Link | AIA | 26 pin MDR 26 pin SDR | Yes |
| USB 2.0 | 2000 | No | USB Implementation Forum | USB | Yes/No | |
| CoaxPress | 2013 | No | JIIA | Coax Cable | No | |
| IP Camera | 1996 | No | TCP/IP | ONVIF PSIA | USB Wi-Fi Ethernet | Yes/No |
Application Areas for IIoT
IIOT can be utilized in support of a number of applications in the industrial space. Some of these are detailed next.
Quality Control. Some companies offer automated detailed part inspection to ensure quality. This has been an area that has needed automation for years. Typically inspection is done by humans, and they can be very subjective, they can be less than vigilant, and they can make mistakes. Quality control can also be expanded to automatically ensure that each step of a process is completed accurately so you can catch issues before parts have completed a line and the error has been propagated to many more parts. An example could be the requirement of an O-ring in an assembly. If the O-ring installation step becomes misaligned and the O-ring isn't installed correctly, the defect may not be discovered until the part is physically tested hours or days later, or when the customer receives the faulty part and it fails. Then there would be corrective action to try to find all the finished parts that could be affected and possibly a recall.
Inventory Monitoring/Asset Management. By attaching RFID tags or Bluetooth tags to items and positioning readers at different points of interest like doorways, inventory and assets can be tracked effortlessly. In the past, inventory technology has been centered around scanning barcodes. Each item is scanned individually and because it's a repetitive task, mistakes are made. The main barrier to wireless tag technology has been price. Over time, RFID tags have decreased in price to about 10% of the original cost ($0.10 instead of $1.00). Integration of this data with warehouse management software and ERP systems makes it faster and easier to receive goods, provides higher quality on fill rates by ensuring that the right parts are selected, and reduces leakage or theft by triggering an alert when items go out a door. It is now common for the RFID tag to be added to the item at the site of manufacturing and travel with the item for its lifespan, and because it's wireless technology it works for items in cartons, boxes, and on pallets.
Overall equipment effectiveness (OEE) is the ability to measure how well equipment is utilized. Many times the first response to a capacity issue is buying more machinery and hiring more people, but by increasing OEE all machines are more fully utilized during work shifts and capacity is increased without a large capital expenditure. Monitoring the actual uptime against the planned uptime is the first step. Going deeper, you can monitor whether an operator is present, whether there is material to feed the machine, and whether the machine requires maintenance (stack lights typically indicate this). In general, machines are utilized about 60% of the time and increasing this by even 10% can make a big impact to the bottom line.
Predictive maintenance has been accomplished by using a time interval or a usage target, similar to changing the oil in your car every 2,000 miles or two months. This is generally an inaccurate science. A better way to look at this issue is to monitor the machine for deviations from normal that can be defined through AI learning, so if a new vibration is detected it could mean repairs are needed. Most catastrophic failures occur randomly, and routine maintenance could be swapping good parts too soon. A great example of this is data centers full of server racks. A company may buy 10,000 servers a year and swap them out on a scheduled basis. Detecting temperature rises and power consumption could be a better way to understand deterioration of that hardware, and lower maintenance costs. Going forward, historical data and AI can now predict when repairs or replacement of equipment might be needed without monitoring.
Safety and Security. In large chemical or gas plants, monitoring people in restricted areas could prevent accidents. Also, knowing whether people are in a hazardous area and how many are in the area could be very helpful if a rescue operation were to be needed.
Security cameras do a good job of monitoring for theft, for example, an industrial truck being driven off the property by someone. But you really need to combine that monitoring with AI and machine learning to have a system that can also prevent theft or property damage. Most security cameras record hours of nothing and have to be reviewed in their entirety many hours after an incident occurs to try to piece together what happened, and the video quality is usually terrible. A smart system could determine whether the person was an employee or a stranger, exactly when the theft occurred, and it could also be connected to security devices that close and lock the exit gates or sound an alarm if the person is unauthorized and the truck is moving. This system would only record the time frames of interest.
By monitoring power consumption in conjunction with machine utilization and smart switches, a solution could turn off machines that are not in use and help reduce the carbon footprint for the company. Many homes today also have smart meters that help homeowners understand their power usage and gives them the tools to reduce their carbon footprint as well.
Industries Where IIoT Can and Does Play a Role
Where can IIOT be utilized? It can be used to improve the efficiency, yield, safety, profitability, and quality of almost any industrial activity. Following are a few examples with some of the benefits highlighted.
Manufacturing. This would include not only automation of formerly manual processes, but also inventory management and control, factory monitoring for predictive maintenance and repair, inspection and quality control, and many other aspects of a manufacturing facility that were formerly done manually or in a disconnected fashion.
Automotive Industry. IIOT enables new ways to move data from sales, engineering, and customers directly to the factory floor. This permits a greater degree of customization than any achieved before. It also supports new tools and processes to be included in the manufacturing process, such as 3D printing. It makes possible moving to 24-hour production with higher security, safety, and efficiency. Data analytics makes monitoring and trend prediction possible on a grand scale.
Cars themselves contain many sensors that provide feedback to the owner, the mechanic, and any Cloud-connected service like OnStar.15 A list of typical sensors found in cars follows.
- Airbag
- Brake fluid pressure
- Cylinder head temperature gauge
- Exhaust temperatures
- Fuel level
- Oil level
- Oil pressure
- Oxygen
- Transmission fluid temperatures
- Water in fuel
- Curb feelers
- Parking
- Tire pressure
- ABS status
Oil, Gas, and Chemical. IIoT will not only improve the efficiency of complex chemical and energy-generation activities, but will also greatly improve safety through more complete and targeted monitoring. This would include widespread use of smart sensors to monitor for leaks, overheating, dangerous pressure, and safety violations. Due to the size of, or widespread distribution of, these kinds of facilities, personnel, public, and asset safety is greatly enhanced. Environmental impact can also be better mitigated. Companies will also be better able to adjust for fluctuations in demand, price, availability, and risk management.
Agriculture. With IIOT, farmers will be able to better monitor all kinds of aspects of their operations, they will be able to choose the best times to plant or harvest, apply fertilizer and irrigation for optimum results, monitor livestock more effectively, and monitor weather and soil conditions on a micro-basis. Currently there are drone offerings that will monitor a field for weeds, insects, and lack of water; theoretically you can use fewer people to cover more land.
Food Processing. From harvesting at the peak of ripeness, maintaining a cold chain from harvest to consumer, checking for foreign objects, and smart packaging and labeling, IIoT can make the food chain safer and increase the quality of the food.
Construction. Safety on a construction site is very important; accidents in this environment are usually fatal or life-changing. Being able to monitor worker actions with IIoT could prevent many accidents from happening. It typically isn't one thing that goes wrong, it's a chain of events where several things go wrong; catching even one of these events could make a difference.
In addition, by counting people in different work areas, an accurate model of costs can be developed so that the following proposals can be more accurate and less of a mystery.
Another area where mistakes can be avoided is in tracking the contractors delivering materials. When a skyscraper goes up there are different grades of cement for each section, with the strongest and most expensive being in the foundation. Verification that the right materials were used in the right place can help avoid costly rework and repairs or a collapse after construction is complete.
Retail Distribution and Wholesale Inventory Management. As mentioned earlier, the use of RFID tags or Bluetooth devices can give an exact picture of inventory positions across stores, warehouses, and distribution centers. With the blending of in-store and online shopping, being able to fulfill an order with inventory from any location within the network becomes a differentiator. The goods on the shelves can be monitored for replenishment and distribution centers have a better idea of what to stock to avoid excess or shortages. An example is a clothing manufacturer that thinks they have excess inventory in the stores but no way to aggregate the numbers, so they run a campaign for a sale on those items. If half of the stores have no inventory, they run the risk of disappointing customers who have been enticed to shop there and they have wasted their advertising budget.
Shipping and Transport (Ocean, Rail, Truck, Air). Using AI and IIoT in a transportation chain, a reliable model for predicted arrival times can be learned and it will have all the nuance and details that can tell you which ports are slow, which carriers bump containers, and where leakage occurs and why, providing a complete picture across ocean, truck, air, and rail. Once the transportation chain is understood with this type of model, you can start counting inventory in transit as available at a predicted date and lower safety stock levels.
Benefits may include better estimated times of arrival, asset tracking, loss reduction or prevention, security, and so on. With better data the next round of transportation contract negotiations will be more accurate and fairer.
Public Spaces. Wherever people gather – airports, restaurants, parks, or highways – there are applications for making the experience better. The security lines at airports can be ridiculous. If there is more than one checkpoint, knowing whether all of them or just one particular one are bad would be helpful. Passengers could even be directed to the shortest line through signage. Also, monitoring lines and crowding can be helpful in retail stores or airport gate check-ins. Staffing can be modified so that there are enough staff to accommodate the traffic.
Some parking garages now have sensors for each space to detect when a car is parked in it. Driving into the garage there are signs showing exactly how many spaces are available on each level to take the guesswork out of where to park. Previously there might have been a sign on each level that said full, and it might be accurate.
Future Trends in IIoT
John Burton, writing in IIoT World, has made some exciting predictions as to what we can expect from IIoT technology in the coming years.16
- 5G 3D Video Streaming. Models run locally on computer devices today, much like how we used to download movies for viewing. 5G will enable streaming of such information, similar to how we watch movies today. You can also expect to see full 3D video streaming for industrial uses.
- Augmented Reality (AR). Virtual reality (VR) has found a niche in industry, typically for training. AR use cases will grow dramatically with sophisticated head-mounted gear that combines a display, a camera, and a microphone. This will include viewing live video, digital twins, and data sheets using voice commands.
- 3D Modeling. With 3D scans, 3D CAD, and 3D digital twins, the Smart Manufacturing world will model its environment in 3D.
- Self-Training Machine Learning. As discussed in Steven Herman's Chapter 9, “Artificial Intelligence, Machine Learning, and Computer Vision,” unsupervised learning for AI will greatly simplify machine learning by detecting normal usage patterns quickly and then monitoring for unusual patterns that exceed a preset threshold.17
Summary
The Industrial Internet of Things (IIoT) is now impacting more areas of Smart Manufacturing and Industry 4.0 than any other technology. IIoT is also the simplest and least expensive of all Smart Technologies to implement, which is especially important for smaller manufacturers and distributors. Proof of the IIoT's popularity is the dramatic growth of devices deployed. Juniper Research predicts an increase from 17 billion in 2020 to 37 billion in 2025.18 There will also be a dramatic growth in revenue spent on the IIoT over the next four years. According to Market Research Report Reprint, IIoT revenue will double from 2021 to 2025.19
In this chapter we have showcased over 20 types of IIoT devices and how they can transform quality assurance, inventory control, and asset management safety, security, and operational efficiency. We can expect the power of these devices and their use in industry to continue to grow at an accelerated rate.
Sample Questions
- What is the difference between IoT and IIoT?
- There is no difference.
- IoT refers to devices like sensors and IIoT to the intelligent systems employing the sensors.
- IoT is generally thought to be consumer-oriented and IIoT is IoT technologies in an industrial setting.
- IIoT must utilize connections to the Cloud and Big Data for analysis.
- When was the first webcam introduced?
- 1980
- 1993
- 1968
- 2500 BC
- Which of these are important application areas for IIoT?
- Asset monitoring and control
- Safety
- Automation
- All of the above
- What industrial activity would not get much benefit from IIoT?
- Consumer retail
- Transportation
- Food preparation
- There are no industrial activities that would not be able to benefit from IIOT.
- Security is an important subject for IIoT. What security applications would not gain much benefit from the implementation of IIoT?
- Personnel security in a factory or office
- Cybersecurity due to the vulnerability of IIoT
- Asset security such as controlling who can adjust a machine or process
- None of the above
- What is the definition of a Smart sensor? How would we identify one?
- A Smart sensor has an embedded controller that provides some level of control or formatting of the data reported by the sensor.
- A Smart sensor has the capability to communicate directly with the Internet, which is what makes it Smart.
- A Smart sensor can perform its function autonomously, with no connection to anything else.
- All of the above
- How many layers are there in the IIoT Layered Architectural Model?
- Seven, just like in the OSI Model
- The number of layers is variable depending on the IIoT technology involved
- Four
- Three: sensors, controllers, and high-speed communications
- Which of these is not a real-world current example of IIoT?
- Self-driving cars and trucks
- Factory automation
- Video conferencing
- Facial recognition used in security systems for access control
- The Industrial Internet Consortium (IIC) is a Standards organization made up of major industry players such as IBM, Cisco Systems, General Electric, and AT&T. True or false?
- True
- False
- Which of the following are currently available sensors?
- Alcohol
- Proximity
- Cameras
- All of the above
Notes
- 1. Raji, R. S. (June 1994). Smart networks for control. IEEE Spectrum 31 (6): 49–55. https://doi.org/10.1109/6.28479.
- 2. The Industrial Internet Reference Architecture v.1.9. Industry IoT Consortium (IIC). https://www.iiconsortium.org/IIRA.htm.
- 3. Programmable logic controller (PLC). Wikipedia. https://en.wikipedia.org/wiki/Programmable_logic_controller (accessed August 23, 2021).
- 4. Teicher, J. (February 7, 2018). The little-known story of the first IoT device. IBM. https://www.ibm.com/blogs/industries/little-known-story-first-iot-device/.
- 5. Kesby, R. (November 22, 2012). How the world's first webcam made a coffeepot famous. BBC News. https://www.bbc.com/news/technology-20439301.
- 6. Hylving, L., and Schultze, U. (January 1, 2013). Evolving the modular layered architecture in digital innovation: The case of the car's instrument cluster. International Conference on Information Systems (ICIS 2013): Reshaping Society Through Information Systems Design, Milan.
- 7. Radio-frequency identification. Wikipedia. https://en.wikipedia.org/wiki/Radio-frequency_identification (accessed August 23, 2021).
- 8. Low cost, 2.7 V to 5.5 V, pin-selectable temperature switches in SOT-23: ADT6401/ADT6402. (2008–2013). Analog Devices. https://www.analog.com/media/en/technical-documentation/data-sheets/ADT6401_6402.pdf.
- 9. List of temperature sensors. Wikipedia. https://en.wikipedia.org/wiki/List_of_temperature_sensors (accessed August 23, 2021).
- 10. Thermistor. Wikipedia. https://en.wikipedia.org/wiki/Thermistor (accessed August 23, 2021).
- 11. Thermocouple. Wikipedia. https://en.wikipedia.org/wiki/Thermocouple (accessed August 23, 2021).
- 12. Resistance thermometer. Wikipedia. https://en.wikipedia.org/wiki/Resistance:thermometer (accessed August 23, 2021).
- 13. Silicon bandgap temperature sensor. Wikipedia. https://en.wikipedia.org/wiki/Silicon_bandgap_temperature_sensor (accessed August 23, 2021).
- 14. What is the difference between CCD and CMOS image sensors in a digital camera? How Stuff Works. https://electronics.howstuffworks.com/cameras-photography/digital/question362.htm.
- 15. OnStar Corporation is a subsidiary of General Motors that provides subscription-based communications, in-vehicle security, emergency services, hands-free calling, turn-by-turn navigation, and remote diagnostics systems throughout the United States, Canada, China, Mexico, Europe, Brazil, and Argentina.
- 16. Burton, J. (January 5, 2012). IoT trends for industry 4.0 in 2021. IIoT World. https://iiot-world.com/industrial-iot/connected-industry/iot-trends-for-industry-4-0-in-2021 (accessed August 23, 2021).
- 17. Ibid.
- 18. O'Halloran, J. (October 3, 2020). Industrial IoT connections to reach 37 billion by 2025. Computer Weekly. https://www.computerweekly.com/news/252491495/Industrial-IoT-connections-to-reach-37-billion-by-2025 (accessed August 23, 2021).
- 19. Kawasaki, L., Huges, I., Zwakman, and Renaud, C. (April 29, 2021). IoT revenue expected to nearly double through 2025; data generation to triple. Market Research Report Reprint. https://f.hubspotusercontent10.net/hubfs/5413615/451_Reprint_Industrial-IoT_29APR2021.pdf?utm:campaign=451%20Reports&utm:source=resources%20pge (accessed August 23, 2021).