
Chapter 7
Week 4: Influence and Measurement
If you could ask your customer just one question—and your business depended on the answer—wouldn’t you want to ask that question? The Net Promoter Score®, developed by Fred Reichheld, is based on one simple question: “How likely are you to recommend [brand, company, product, service]?” It’s a fundamentally important metric and central to the successful implementation of social media. If your own customers—armed with Twitter and a smartphone—would not recommend you … well, you can see the problem.
This chapter starts with an in-depth look at the Net Promoter Score. It continues and covers existing metrics, some of which you are probably already collecting, and then it shows how these metrics can be used to make a case for social media by establishing a basis for the determination of success.
Chapter Contents
- Influence and the Social Web
- Quantifying the Conversation
- The Main Points
The Net Promoter Score
 In this chapter,
I refer to the Net Promoter Score, created by director emeritus and Bain fellow Fred
Reichheld. Based on one question, it can be quickly added to existing surveys. It is
also easy to build an action plan based on the Net Promoter Score over time. Knowing
how likely your customers are to recommend your product or service takes you
straight into the kinds of product or service changes that lead to the increased
likelihood of a strong, powerful recommendation. Most important, the Net Promoter
Score takes into account the powerful impact of detractors. On the social web, the
detractor—positioned opposite the evangelist—plays a powerful role. For a complete
treatment of the Net Promoter Score and how you can apply it to your business,
please read The Ultimate Question, by Fred Reichheld (Harvard Business School,
2006). I highly recommend it.
In this chapter,
I refer to the Net Promoter Score, created by director emeritus and Bain fellow Fred
Reichheld. Based on one question, it can be quickly added to existing surveys. It is
also easy to build an action plan based on the Net Promoter Score over time. Knowing
how likely your customers are to recommend your product or service takes you
straight into the kinds of product or service changes that lead to the increased
likelihood of a strong, powerful recommendation. Most important, the Net Promoter
Score takes into account the powerful impact of detractors. On the social web, the
detractor—positioned opposite the evangelist—plays a powerful role. For a complete
treatment of the Net Promoter Score and how you can apply it to your business,
please read The Ultimate Question, by Fred Reichheld (Harvard Business School,
2006). I highly recommend it.
Measurement and the social web go hand in hand, although it’s not always obvious how to go about measuring something as dynamic as a conversation. Further, because the social web is a relatively new medium, many of the measures you’d like either aren’t available or aren’t yet proven as fundamental indicators of success as it applies to marketing. Reach and frequency, developed for mass advertising over a period of years and refinement, are solid mass media indicators. As a largely—but not exclusively—online phenomenon, social media measurement borrows heavily from existing online metrics. At the same time, questions like “How likely is it that you would recommend me to a friend?” are rooted in the principles that drive social media.
What Is a Conversation?
One of the terms that is often used but seldom defined in the context of social media is conversation. It can sound like a lot more than it really is, too, since it’s one of those words that we are familiar with in an everyday sense. In this book, and in most social media uses, a conversation is a series of posts that are related to each other by topic. So, where the individual element is the post—a tweet, a status update, or a photo—the conversation is the related set of these that constitute the back-and-forth dialogue that follows from that original post.
So, a conversation can be much less significant on the social web—a quick question and answer, for example—or can be quite significant—for example, the hundreds of comments that may flow off of a popular blog post or discussion of a current event as it works its way across Twitter.
In the opening sections of The Ultimate Question, Fred Reichheld makes two fundamental points:
- Customers who are willing to evangelize, based on direct experience, are the only sustainable source of long-term profits.
- Profits earned through any form of coercion, trickery, or misleading advice are at best short term and will—if left unchecked—ultimately destroy the firm.
Look at these two items and think about the social web. Customers who are “willing to evangelize” are precisely the customers that I identified as actively talking in Chapter 5, “Week 2: The Social Feedback Cycle.” These are the customers who have tried your product or service and have something to say about it. Precisely what they have to say may be a different matter, but nonetheless these are the customers who are both inclined and able (i.e., have the online tools and skills) to talk about the experience you have delivered. At the same time, you’ve (hopefully!) earned a profit on these customers. Running a sustainable, healthy business requires a profit, after all, and for most businesses the only source of that profit is your customers. Yes, you can spend less, and you can be more efficient with resources. These kinds of disciplines and activities can improve your profit margins as you adjust to a changing business climate, or they can help you establish a long-term competitive cost advantage. At the end of the day, however, the cash flow you need to operate comes from exactly one place—your customers’ wallets.
If you buy into the idea that your customers are both informed and inclined to make smart choices, then tracking the Net Promoter Score makes quite a bit of sense. The direct implication for generating long-term profits, according to the principles Fred defines, is that if you have generated your revenue through any activity or business practice that doesn’t delight your customers—or wouldn’t if they fully understood it—your days are numbered. The exact number of days may be large: Some businesses run for a long time, all the while abusing their customers in one way or another simply because their customers have no other choice. However, eventually those firms either change or fail.
Think about mobile phone companies, banks, and media providers, who often give new customers a better deal than existing ones. Automobile dealers—who have long made the bulk of their profits on service and parts sales (not car sales) created price floors for the quick lube and replacement parts providers, and in so doing gave rise to the businesses that now undercut them in these areas. Full-cost airlines who long enjoyed near monopolies in heavily regulated markets gave rise to innovators and entrepreneurs like Herb Kelleher of Southwest Airlines. The airline focused on customer satisfaction, expressed not by designer uniforms (remember Braniff?) but instead by efficient, affordable flights that took off and landed on time. Not coincidentally, Southwest Airlines is consistently profitable and steadily growing, having recently acquired AirTran to further build its service base.
Building a winning brand and maintaining one are two different things. Dell built a commanding position in the personal computer market by offering a better way for its customers to buy one. When its customer service floundered, however, Hewlett-Packard gained and retook the global market share top spot, only to consider in 2011 exiting the business altogether. Dell, number two in 2011, is gunning for the top spot, all the more so given that Apple has moved up to take the number-three spot.
Not coincidentally, social media and the positive practices that drive it are part of Dell’s program. In all of these cases, the role of the customer recommendation is central to the rise or fall of the brand.
Put these two concepts together—first, that evangelist are the key to long-term growth, and second that profit earned by means that fail to delight your customers threatens your long-term viability—and you have what is essentially a formula for success not only on the social web but in your overall business as well. On the social web—made up of blogs, photos and shared videos, collaborative event-planning tools, ratings and reviews, and more—the conversations that stem from actual, delightful experiences with products and services are the key to driving and sustaining evangelism and hence long-term growth.
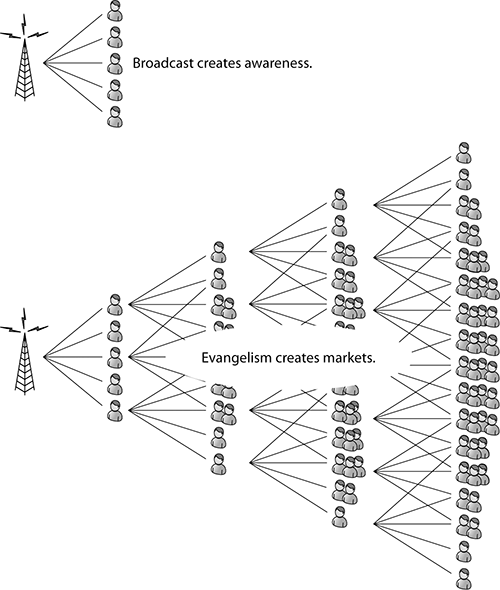
Traditional marketing programs are essential in driving awareness and seeding markets. It is evangelism, however—the impact of which is shown in Figure 7-1—that drives a steady amplification that builds over time through the combination of word of mouth and digital content on the social web. It literally creates markets. Contemporary brands and their social reputations are being built through practices that encourage evangelism.
You can counter that price or some killer feature might be more important in the creation of evangelists. To be sure, I don’t know anybody who doesn’t like a deal, and low prices do get talked about. But at the same time, a good chunk of your customer base will enthusiastically promote you for a variety of reasons if you’ll only give them the means. This desire goes beyond any single characteristic—for example, price—associated with your brand. There are a few million people out there who do not want Southwest Airlines to go out of business and who are willing to pay extra to make sure it doesn’t. This was made clear following September 11, 2001, as customers literally wrote in to support the airline, offering cash contributions and emotional support to keep the airline in the air and to keep all of its employees working. That’s love, and love is a key ingredient in the development of evangelism with regard to a brand, product, or service.
Figure 7-1: Evangelism driving sales
This connection to the brand, based on actual experience, is the reason the Net Promoter Score is so powerful in social media applications. It gives equal treatment to what you are perceived as doing right and what you are perceived as doing wrong. This is where most satisfaction surveys fail.
Here’s an example: Suppose that 60 percent of your current customers were highly likely to recommend you, while another 20 percent were reasonably satisfied but perhaps not moved to the point of offering spontaneous recommendations. The typical satisfaction survey asking questions directed at satisfaction rather than likelihood of recommendation will often group these together and conclude that 80 percent of the customers surveyed were basically satisfied or better. Who wouldn’t be happy to learn that the majority of their current customer base considers the product or service acceptable?
The problem with this type of analysis is twofold. First, it lulls everyone—including the CMO, CEO, and COO—into the false sense that everything is fine. Eighty percent sounds like a lot, and in truth it is. It’s “almost everyone.” The problem is that on the social web, which is where your social media campaign will play out, 100 percent of your customers are present. “Eighty percent satisfied or better” is not “fine” if it means that 20 percent of your customers are walking around actively telling people not to buy your stuff. The typical satisfaction survey and conventional analysis can and often does conveniently hide this fact. What do you suppose will happen when you invite all of your customers to talk about you? The social web, by definition, is open to all participants. Do you think these 20 percent will stay home that day? They won’t. If you don’t know who they are, or what they are likely to say, or what you will say when they start talking, that 20 percent will quickly become your worst nightmare.
Satisfaction surveys—unless they also reliably identify influential respondents—can also fail by missing the key social participants. Suppose you have equal numbers of lovers and haters, for example. That’s good data, but it’s not enough. It is also important to know the makeup of each group: Which group contains more of the A-list bloggers, influential customers, and highly connected industry pundits? Which group reflects the comments of people participating in the 100,000-member or 1,000,000-member versus 1,000-member forums? Which bloggers are your potential customers listening to? This same caveat applies to your Net Promoter surveys, so be sure that you consider this. You may not be able to get this data right away, but if you ask for it, you can build it up over time and gain valuable insight into your audience on the social web.
The Net Promoter Score helps you in three ways. First, it correctly identifies the share of customers who will stand up and recommend you. A score of 7 or 8 out of a possible 10 means they think you’re OK, but it doesn’t mean that they’ll go out of their way to actively recommend you. A score of 9 or 10 means they will. So right off, you have a big leg up in preparing for and managing social campaigns: You know what kind of active support you’re likely to have. Second, you know what share of your customer base is going to give a negative recommendation.
In our simple survey, we asked only one question. In practice, you’ll probably have more information available to you, including the type of customer, purchase history, demographics, and more. You can use this information to pinpoint issues, which brings us to the third benefit. Using the Net Promoter Score and the methodology Fred has developed, you can put a plan into place that reduces the number of detractors while you also work on building the number of promoters. This is a huge gain for you: Actively working to reduce both the influence and the number of detractors takes you deeper into the operational aspects of your brand and can get at things that are often passed over and dismissed with excuses such as “We can’t fix that” or “It’s not my department.” If detractors are beating you up about it, whatever it is does matter, and you must fix it. Looking at promoters versus detractors can also expose internal practices considered sacred: “At Jones & Jones, we simply don’t do things that way.” Maybe this a good time to start! Seriously, while I am making light of what can be real challenges, when tracked over time the Net Promoter Score is an invaluable yardstick for social media practitioners. It is easy for your colleagues to understand, share, and internally promote. Most important, it gets directly at what drives the conversations that occur on the social web.
Tip: You influence conversations on the social web by simultaneously increasing the share of promoters while decreasing the share of detractors.
Spend a minute thinking about this; it’s the fundamental essence of social media management from a marketing perspective. You cannot control the social conversation in the same way as you can control your advertising message. Look at it this way: Yes, you can control the ad campaign, but you can’t control the response to it. Social media is an articulation of the response to your brand, product, or service in actual use. The ad or PR campaigns you create set the expectations against which that response is generated. Fundamentally, the social web is built on conversations that do not belong to you but instead belong to someone else. Instead of trying to control the conversation (or worse, the participants), you have to change your product or service experience that drives the conversation. This, along with your behavior on the social web, is the only element of a social media campaign over which you have full control.
If you have a great product that is delivering a superior (delightful) experience, then use social components such as blogs or video sharing that encourage more talk. Use the social web as a platform to spread your message. If you have work to do, use tools such as support forums to identify and correct issues. Use the social web as a listening tool, and take the conversation to the COO, where you can fix the problems. Above all, participate and be open and honest about what you are doing.
This week is about establishing basic metrics and then using them to predict or measure results. On Monday you’re going to set up a call sheet and questionnaire and start calling. Hopefully you’re not scared to call your customers. No customers to call? If you are working in a prelaunch startup, or are a student or in some other role that does not provide access to customers, then pick a brand and call your friends or colleagues and ask them the questions posed about that brand instead. On Tuesday you’re going to make more calls and continue to ask your customers (or friends) how likely they would be to recommend whatever brand, product, or service you are calling them about. By Wednesday you’ll be wrapping up the results. There’s a chance that you won’t have connected with everyone on your list by Wednesday. In that case, continue with the exercises and move into the next chapter. However, keep working on this exercise until it is complete because what you learn here will be critically important in developing your actual social media campaign.
Tip: A set of worksheets covering this week’s exercises can be found in the appendix of this book. In addition to these printed worksheets, you can download electronic copies and access related resources at the website accompanying this book. Complete information regarding these resources and the website is included in the appendix.
Monday and Tuesday: Influence and Metrics
Turn back to Fred Reichheld’s “ultimate question”: “How likely are you to recommend [brand, company, product, service]?” Embodied in this simple question is everything that powers (or destroys) a brand on the social web. This one question is the basis of a very simple—but powerful—measure of influence.
When your customers willingly support you through a pricing structure that provides a profit based on satisfaction, and are themselves willing to evangelize your brand—to recommend it to others—you are in a very good place. Applying social media will be a straightforward and largely risk-free proposition. After all, your customers are already talking about you favorably, and you have a business model that will stand up over time. Are you worried about managing the conversation? In effect, you already are. Through the experience of delight that you already provide, you are influencing the conversation in a way that is favorable to your position.
The experience of delight is the only way to positively influence the conversation on the social web. Delight can arise as the result of a great experience or because you handled an experience that was less than great in a great way. Think here for a moment about the incredibly important experiences created by your customer service team! Too often overlooked as a marketing driver, customer service is a foundational element of social media. Provide a great experience—through the actual product or service experience or after the fact, in customer service—and the conversation will take care of itself. In contrast, provide a poor one, and the conversation will reflect that instead. The measurement of influence, and in particular tracking it over time, is key to managing your social presence and fully tapping the social web.
Monday’s One-Hour Exercise
Today you’re going to spend an hour identifying a set of customers that you can call. You’ll be putting together a basic call sheet. I’ve provided a starting script that you can follow. You are, of course, free to improvise as long as you still ask your customers how willing they’d be to recommend you. Note that asking them if they like you, if they are happy with your relationship or with the last order, or if everything is going OK is not the same as asking them how willing they’d be to recommend you. Liking someone is different than personally vouching for them. There is a higher degree of commitment implied, and it is for exactly this reason that a recommendation and the measure of its likelihood are worth so much.
A Sample Call Script
“Good afternoon, this is ____ from ____. We’ve been doing business together for ____ years, and it occurred to me that I’ve never asked you about whether or not you’d tell others to try us. So, I’m calling today to ask you: On a scale of 0 to 10, where 0 means “no way” and 10 means “absolutely, without hesitation,” how likely would you be to recommend our firm to your colleagues or others who you feel could use our____ [product or service]?”
Your script can be as simple as that. You’ll want to say “thank you” at the end of your call, too. You may well find that this call opens a dialogue, especially if the answer to your question starts out along the lines of “Well, I’m glad you called because actually there are a couple of issues that would prevent me from recommending you.” Structure your call sheet like the one shown in Figure 7-2. If your call does open a dialogue about challenging issues, be sure to note these issues. Add these to your notes for use later when you build your plan.
Figure 7-2: A typical call sheet
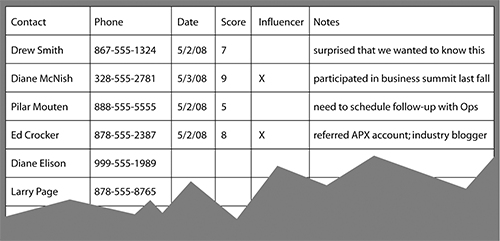
In the call sheet shown in Figure 7-2, I want to call out one specific attribute: influencer. As you are calling, or through research that you do ahead of time, identify the role that each of your contacts plays in generating influential social content. Also, during your conversation or on your survey form, ask about this person’s use of social media; does this person write a column or author a blog?
It may be, for example, that the customer you are speaking with writes a well-read industry blog or is a moderator in a popular forum. Take a look at the website of Indium (http://www.indium.com), a global solder supplier, for example. Many of the executives, researchers, and application engineers employed at Indium blog. The things they blog about get noticed throughout the industry. The recommendation metric is unchanged, but knowing when someone is more or less influential than your average customer is valuable when you are looking to stem negative conversations or quickly communicate positive developments that you initiate through social media later on.
To get a handle on influence, look for blogs authored by the person you are calling. Use Google and search for the person’s name and company or title, for example, or ask questions like, “Have you ever recommended us or one of our competitors?” If the response is “Yes, all the time. In fact, just last week…,” then go ahead and check Influencer.
Depending on your organization, you may need to work with sales or an alternative team when compiling a list of customers. Most important, do not call only those clients you know will tell you what you want to hear. Don’t avoid problem customers. They can be your greatest source of insight. Sure, you can stack the deck, but then the only thing you’ll learn is how to make a call, and you probably already know how to do that. Instead, pick customers randomly; you want a few who you know are tough and some with whom you have a great relationship. Approaching this week’s exercise in this way is sure to produce some new learning, and after all, isn’t that why you are taking the time to read this book?
Now it’s time to make your calls. Create a list of customers, and enter them into a list like that shown in Figure 7-2. Next, pick a random subset to call. I suggest calling at least 10 customers, so you want to start with a list of 20 or more.
Tip: To pick customers at random, sequentially assign numbers to each of the customers in your initial list. Then, jump over to Research Randomizer (http://www.randomizer.org/form.htm). Generate a list of random numbers, and call the customers corresponding to those numbers.
Figure 7-3 and Figure 7-4 show how Research Randomizer can be used to make picking customers easy and truly random. In the figures, I have asked for 10 random picks from my list of 50 customers. I will be calling the customers numbered 2, 7, 18, 26, 34, 37... from my list of 50 customers.
The randomization process may seem like extra work, but it’s actually quite important. When you do a survey, you always want to take that extra step to push bias, however unintended, out of the system. Besides, when your colleagues start peppering you with questions about how you did your survey, won’t it be nice to be able to look at them and say, “I used a standard randomization method to select our sample population from our current customer base.” That usually impresses the naysayers, helping you to win support for your program when the time comes. Running a successful social media program begins with successfully building support for that program across your organization.
Figure 7-3: randomizer.org input
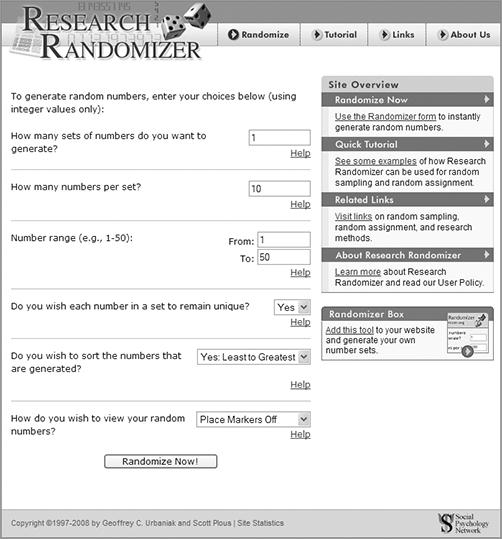
Figure 7-4: randomizer.org output

For the next hour, work through the following items. Don’t rush—take the time to talk with your customers. You have tomorrow to finish any calls you don’t get to today.
- Using your script and call sheet, make your calls.
- Using your call sheet, record notes from each call.
Tip: Although it may take longer, you can use an email or other type of survey instrument if this works better in your specific case. Use the same randomization method when determining who to include, and adapt the script for use in these alternate survey tools.
Monday’s Wrap-Up
Today you set up a basic call sheet and even made a few calls. What new things did you learn? Most people have a preset expectation of what they are likely to encounter. You may, for example, expect that a certain feature or competitive lack thereof or a recent price increase is going to come up in every call. Did it? By calling customers at random and then asking about the likelihood of a recommendation rather than “How’s it going?” or “Do you like our new products?” you focus the conversation on the issues that really drive the conversation on the social web. No one likes a price increase. Real business issues may prevent you from matching a competitor’s offering feature for feature. But neither of these necessarily stands in the way of a strong, positive recommendation.
Look at your call sheet; is it working for you? You may want to modify your call sheet to fit the kind of information you are getting. If you have time and the inclination, replace the sheet altogether with a simple database so that you can expand the questions down the road and track the results over time. This would be a great project to get a larger team involved in too and thereby build support for your social media program.
Tuesday’s One-Hour Exercise
Today you’re going to spend an hour finishing your calls and making any final notes based on what you have learned. Tomorrow you’ll use the information you’ve gathered today and yesterday to determine your Net Promoter Score.
Go back to the call sheet you set up yesterday, and work through any remaining clients. Here are some helpful points that will ensure you get the most out of this exercise:
- If you’re getting all 10s, do a quick reality check. Have you picked your 10 best customers, or did you choose them randomly? Are your customers being frank with you?
- If they say they’re very likely to recommend you, can you think of a customer you have now who was such a referral?
- It may be that you need to do the survey anonymously. For example, you can conduct an online or email survey and then collect the data over time. In that case, move on with next week’s exercises while waiting for the responses to come back.
Central to both yesterday’s and today’s exercise is getting the information that you need. If the people you are talking to are saying nice things about you—that they like doing business with you or that you have been one their longest running suppliers—push harder. Don’t upset them, of course, but do make sure you get the information you need. The question you want answered—the only question you want answered for this exercise—is the question pertaining to the likelihood of a recommendation. More information is great, but make sure you get the answer to this one question.
Although it will take a bit longer to set up, an anonymous survey may be the way to go. Typically, you would employ an outside service provider and then work with them to set up the survey you want done. The results can be very valuable and quite telling. One of the teams I worked with talked with its customers regularly and over time confirmed that they were indeed well-liked. However, when they ran the same basic survey anonymously and had the survey firm probe more deeply, it was clear that while they were liked they weren’t necessarily seen as a business partner. Being viewed as a business partner more often than not results in a strong recommendation as compared with the significantly softer “being liked.” What was subsequently learned about how to change the perception of the firm to that of a business partner was worth much more than the cost of the anonymous survey that identified and quantified the underlying issues.
Tuesday’s Wrap-Up
If you were able to make 10 calls and talk with 10 customers, that’s great. If you have a few more or a few less, that’s fine too. As long as you called randomly, you’ll be fine in this exercise. Ultimately, you’ll be going out to the marketplace with a social media campaign. It’s much better to learn about issues that are preventing recommendations now. Likewise, it will be very helpful in presenting your case for using social media if you can stand in front of your colleagues and confidently say, “I talked with our customers. They indicated that they would be very likely to recommend us.” If you’ve called your favorite customers, your colleagues will see right through it. Even worse, if you have, and they go along with it, then when you do go out in the marketplace, the customers you avoided are likely to chime in. More than anything else, you really want to avoid surprises on the social web. The best way to avoid unhappy accidents is through a combination of excellent customer experiences and advance knowledge of what your customers think of you.
Wednesday: Applying Influence: Social Media
On Monday and Tuesday you conducted a basic customer survey focused on the social media fundamental of the recommendation. Recommendations are a critical component of social campaigns—in fact, recommendations are social campaigns. When you deconstruct a traditional campaign, you find at its core a message crafted by a professional PR firm or agency creative team. You find a message that is aspirational with regard to the brand. It’s what the brand manager and agency account executives hope you will think, which will then carry a potential customer all the way through the purchase funnel to the cash register. There is, of course, nothing wrong with this. It is simply how most consumer transactions are thought about from a purely business and advertising perspective.
This stands in contrast to a recommendation. Recommendations—whether in the form of a conversation or a video clip—power the social web. A recommendation, often appearing along with a review or a rating, is an expression by one person of what might be useful or helpful to another. Ratings quantify the strength of the recommendation. Five stars on Amazon means “I really got a lot out this book.” Reviews add depth to the basic rating or recommendation, providing the necessary detail to make it meaningful. Unlike the aspirational or persuasive marketer-generated message, a consumer-generated recommendation is often a purely informational component in the purchase process. Consumer-generated messages are both positive and negative, and they are generally first person, adding authenticity and urgency to the message.
Think back to the social feedback cycle: The conversation—however it is expressed—impacts the purchase process in the consideration phase, between awareness and purchase. Social media covers the range of emotions and views that are raised in the post-purchase experience. Consumer-generated content can sway, convert, or dissuade, depending on its polarity (positive or negative). By comparison, marketer-generated messages nearly always attempt to positively persuade: “You’ll love our product because….” So much of what happens in advertising is positive (that is, encouraging and supporting a purchase) that the general response has become, “Nice, but you’re really only giving me part of the story. What about the negative? What happens after I buy?” Of course, that question leads directly onto the social web, where it gets answered.
By comparison, political attack ads are one of the few examples of marketing communication where the entire ad (not just a feature comparison) is often negative. They are often deliberately styled to appear to be more like consumer-generated media in terms of lower production value and a more direct speaking style. This is not generally the case in mainstream traditional advertising, again separating that medium from social media. Ford, for example, would never run an entire ad directly attacking Chevy other than in something like a feature comparison, whereas plenty of pickup owners will post emphatically in online forums about how they’d rather “push a Ford than drive a Chevy.” There are some things that consumers can get away with that marketers generally do well to steer clear of. When dealing with social media, and consumer-generated media in particular, you are dealing with the statements of individuals woven together into a conversation. Using social media, you can tap the emotional elements of consumer-generated media by influencing—but not controlling—what happens on the social web.
Influence on the social web, expressed through the diverse set of social media components, is indeed powerful. Trust—covered extensively in Chapter 2, “The Marketer’s Dilemma”—is a big part of the reason. It is because of the role of trust that being open and honest is critical. Any indication that integrity is in question causes an otherwise well-intentioned social campaign to weaken or actually work against the brand. It is influence—not control—that you are really after in your social media campaigns. It is influence that can be applied tactically at the point of consideration in the purchase process. This is the exact point where a purchase decision is being formulated and validated. Understanding who is likely to recommend you (or who will not) and to what degree along with why (or why not) is critical in assessing your readiness for a social media campaign.
Wednesday’s One-Hour Exercise
Today you’re going to score your survey. Referring back to Fred Reichheld’s Net Promoter Score, the methodology you’ll use is simple. A quick note is in order before you do this. The sample you have used is decidedly small. The intention is to show you how this works so that you can apply it on a larger and more rigorous scale as you build your social media program over time.
Here are the steps you will follow to compute your Net Promoter Score based on some sample data. You’ll calculate your actual score following this example:
1. Add up the number of respondents who gave you a 9 or 10 and compute the corresponding percentage. These are your promoters. If you called 10 customers and 6 gave you either a 9 or 10, the result of step 1 is a Promoter score of 60 percent.
2. Add up the number of respondents who gave you a 6 or less and compute the percentage. These are your detractors. If two gave a score of 6 or less, this is a Detractor score of 20 percent.
Tip: Mark any zeroes for future follow-up.
3. Subtract the Detractor score from the Promoter score. Your Net Promoter Score is the difference. In the example used, the Net Promoter Score is 40 percent.
Forty percent? That’s terrible! That’s failing, right? And what about the 7s and 8s; don’t they count?
First, 40 percent is actually quite good. It means that you have significantly more active promoters than detractors. When you are fighting for every share point, you want more people pulling for you than pushing against you. A score of 40 percent says that this is the case. That’s good. What’s a score that indicates problems that need to be corrected? How about negative 40 percent! A negative score means you have more detractors than promoters. Jumping into social media and expecting to use it as an outreach tool with a negative Net Promoter Score is a lot like bringing a spoon to a knife fight; you’re in trouble before you even walk in. With regard to the 7s and 8s, no, they don’t count, and here’s why: A score of 7 or 8 means people think you’re OK but would not necessarily give you a strong recommendation. In a world driven by recommendations, 7s and 8s don’t count.
Now calculate your actual Net Promoter Score, using the survey data you collected:
1. Add up the number of customers who gave you a 9 or 10 and compute the corresponding percentage. These are your promoters.
2. Add up the number of customers who gave you a 6 or less. These are your detractors.
3. Subtract the Detractor score from the Promoter score. Your Net Promoter Score is the difference.
4. Write down your Net Promoter Score.
Wednesday’s Wrap-Up
Today you determined your Net Promoter Score and got your first real look at a metric that can guide your social media program. Understanding your current base of active promoters versus likely detractors is essential to successfully implementing social media. If your score was 40 percent or higher, that’s great. If it was 100 percent, run through this chapter again with 10 new customers. Seriously, if your score is 70 percent or higher, that’s really terrific. And yes, you still can improve. If you eliminate your detractors (not in the James Bond sense), you could achieve a score of 80, 90, or even 100 percent. However, you need to put this into perspective. Bain studied a group of respected companies. Scores ranged from near zero to the low 80s. One stood out for me personally: Harley-Davidson. Harley-Davidson scored 81 percent. What kind of customer base drives a Net Promoter Score of 81 percent? Customers who will tattoo the brand name on their body! Take a look at Figure 7-5. What would it take to get your name there, in permanent ink? Suffice it to say, 80 percent and above is indeed remarkable.
Figure 7-5: Harley-Davidson tattoo

Photo and tattoo used with permission of tattoo artist Daniel Upton, Golden Apple Studios, Austin, Texas.
Thursday and Friday: Metrics—From Influence to ROI
So far this week you’ve worked exclusively with the Net Promoter Score. Think of this as the foundation for social media metrics, certainly as they apply to understanding your readiness to engage in promotional social campaigns.
Net Promoter: Supports and Critics
While I favor the Net Promoter Score because of its wide applicability, clarity, and simplicity, there are both alternatives and views that suggest alternatives to the Net Promoter. One alternative—or just as well, a complementary tool—is the Customer Lifetime Value model developed by Dr. V. Kumar. You’ll find a description of the book Customer Lifetime Value—The Path to Profitability and Dr. Kumar’s contact information here:
http://www.drvkumar.com/contact/
You can review the arguments for and against the Net Promoter methodology on Wikipedia. See the following as a place to further your understanding of all points of view around this type of central social media metric:
If your score is relatively high (if promoters outnumber detractors, for example), then the social web ought to be reasonably receptive to your efforts, provided you follow the basic rules of etiquette and conduct as established: disclosure, transparency, and participation versus interruption. If detractors outnumber promoters, then engaging the social web directly—in other words, using social media as an outreach tool—is risky. Fortunately, even in this case you can still use the social web and social media. Using social media for outreach is just one of the two available modes; the other is listening and feedback. Particularly for brands, products, or services with a low (or negative) Net Promoter Score, the social web can be a great place to quickly and at low cost discover the kinds of things that, if addressed, will prove themselves valuable over the long run.
In addition to the measurements like the Net Promoter Score, a range of similarly quantitative metrics is available to you. If you currently have a company website or blog, or you are using basic social media channels already, you can tap these for data. For example, if you have a website, you can link your sources of traffic to the metrics you collect there, such as page views and detailed site visitor information, including length of time spent, traffic patterns, and entry and exit pages. If you are operating support forums or basic discussion boards, you can collect this same information and use it to get a handle on engagement or stickiness. If you maintain a blog, you can count the number of subscribers versus unique visitors, compute the ratio of comments to posts, and generate an estimate of the interest that people who frequent your blog take in its content. Together, these give you a baseline from which you can draw conclusions about the level of participation that currently exists. This is important in developing a baseline against which you can measure future changes as you develop and implement new or additional social media efforts.
Featured Case: Cymfony and Sony Blu-ray
Using the Cymfony social media metrics platform, from a group of nearly 18,000 posts on blogs, discussion boards, and consumer review sites a sample of 2,000 was pulled for detailed analysis early in the Blu-ray/HD DVD battle. Early on, HD DVD had the lead: 2.5 times more posts discussed being impressed with the technology of HD DVD as compared with the number of posts mentioning Blu-ray technology, while 70 percent more posts discussed HD DVD’s advantages versus those that discussed Blu-ray advantages. There was little discussion of Blu-ray’s larger storage capacity or more sophisticated interactivity, both of which are significant differentiating features in favor of Blu-ray. In retrospect, Sony could have shortened the Blu-ray/HD-DVD battle if they had paid attention to how their marketing communications were failing to engage early adopters and influential writers and then quickly zeroed in and focused on this very important audience.
You can also measure the conversations that are occurring outside your own online properties. For example, you can measure the number of times your product or brand is mentioned in blogs and even the context (favorable or unfavorable) of the mentions using tools like BlogPulse. With tools like those offered by Nielsen, Cymfony, Radian6, and others, you can quantify the conversations and measure uptake of traditionally delivered messages as well build an overall picture of your brand reputation.
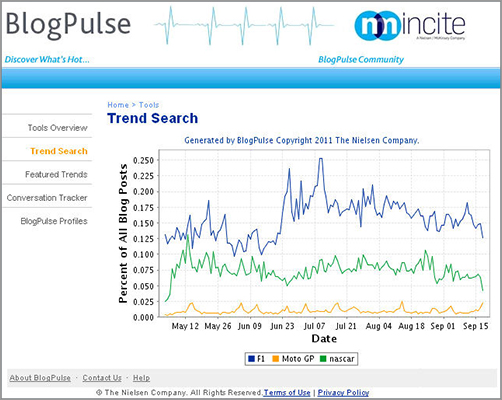
Figure 7-6 shows selected blog topics around motorsports trended over the six months ending September 2011. Global motorsports—led by Formula 1—are popular topics and point up the importance of blending traditional marketing and sponsorship programs with social media.
Figure 7-6: BlogPulse and global motorsports
The challenge in the adoption of social media is, of course, to develop a way of interpreting and reporting on key metrics that result in valuable insight or predict likely outcomes that are specific to your business. As I’ve said in prior chapters, standing in front of the CEO and COO, it’s going to be a tough sell on the part of the CMO or marketing director armed with only ideas and hunches about the value of social media. One way or another, some sort of quantitative basis needs to be advanced to successfully make the case for a social media budget and, more importantly, to make the case for funding the kinds of operations efforts that need to be undertaken to positively influence the conversation on the social web.
Table 7-1 provides an index to the most useful metrics that are commonly available. They are presented in a grouped format, where the groups themselves are taken from the work of Robert Scoble and others. Note that you may not have access to all of these metrics; you may have only a website right now, for example. That’s fine. You can begin with what you have and then build additional measures as you develop your social media program in upcoming chapters. Importantly, the measures referenced in Table 7-1 are examples of metrics you are likely collecting already. You can use these to form the basis of your understanding of who is paying attention to you now on the social web and what they are finding interesting or talk-worthy. In upcoming chapters, you will supplement this with the specific social media metrics that the social platforms you choose as a part of your program also provide directly.
Table 7-1: Social media metrics
| Target Knowledge | Interpreted Information | Underlying Metric |
| Audience | Who’s reading what | Aggregate profile data |
| Unique visitors | Page views, visitor info, blog mentions, click analysis, traffic patterns, sources of traffic via referrer measures | Web analytics: unique visitors |
| Influence | Memes: thoughts, ideas, current conversations, and intensity over time (See Figure 7-6.) | Time on site, blog context, review polarity, Klout score, or other measure of author influence |
| Engagement | Number of clicks, length of stay, conversations | Time on site, pass-alongs, comment-to-post ratio, blog mentions, reviews, bounce rates |
| Action | Conversions | Pass-alongs, conversions, reviews, likes, +1s, followers |
| Loyalty | Trends: subscribers, repeat visitors, referrals | Pass-alongs, blog mentions, time on site, bounce rate |
By taking the time to gather the kinds of data mentioned in Table 7-1 and then examining trends and patterns as you try discrete social media experiments, you can identify the metrics that are most valuable to you and that have the most potential for suggesting likely outcomes. You are a pioneer, and in the pioneer spirit you are looking for clues as to what lies around the next corner.
Thursday’s One-Hour Exercise
Today you’re going to spend an hour reviewing and compiling the metrics that you have available presently and then supplement those using BlogPulse or a similar online tool.
Think as well about metrics that you may also have but that aren’t listed. For example, how could you use your CRM data to refine or supplement the metrics suggested in the table? If you don’t have this data handy—or don’t even know where to start looking—take heart. By adding quantitative metrics to your social media program, you are simultaneously building a platform for success and differentiating yourself from the many who will try social media without measurement. You may have to visit with IT, your webmaster, or your CFO to get the data you need. No matter what, time spent on this now will pay big dividends later because you are sorting what works from what doesn’t and making the case to increase your participation on the social web. The main point of today’s exercise is this: Using Table 7-1 as a start, find as many sources of data as you can that relate to how your customers perceive your brand, product, or service and how they interact online with whatever digital assets—a website, a blog, customer service emails—you have in place now. You’ll sort them out in later chapters. For now you are simply identifying sources.
For the next hour, and using Table 7-1 as a guide, do the following:
- Track down the sources of as many of the metrics suggested as you can, at least as far as those that apply to your business.
- Note these sources of data in your emerging plan.
What you are looking for is the beginning of a measurement dashboard and “report card”—a standardized data presentation that you can build and sustain and that you and those on or around your team can use to guide your social media program. Note that some of these may not apply directly to social media right now. Part of the objective of this exercise is to connect you with the sources of data that may prove useful in the future or that may indicate the types of data you’ll want to request later.
Then, having completed your basic list of metrics, do this:
- Open your browser and go to the BlogPulse website.
- Look for posts about your company using the search tool.
- Look for posts about your competitors.
- Look for posts by the customers you interviewed in your Net Promoter Score exercise.
- Click the Trend This icon, and compare your brand mentions with your competitors’ social mentions over the past six months.
Tip: You’ll find the BlogPulse website here: http://www.blogpulse.com
Figure 7-7 shows a typical query. I looked for occurrences of the word “apple.” Try it with the name of your firm, and see if any of them reference your company or your competitors. This exercise will show you how broadly the conversations that matter to you extend on the social web.
Figure 7-7: BlogPulse trend chart and conversations
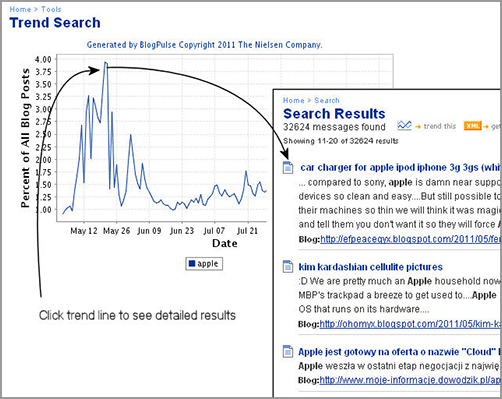
Tip: When visiting the BlogPulse site, click the spikes in the BlogPulse trend chart (see Figure 7-7) to see the details of the days that have interesting activity.
BlogPulse will give you an indication of the blog coverage that you have currently. You can use this as a baseline as you take your current marketing program and expand it by adding social media. In the same way, move beyond the blogs themselves. Search Twitter, YouTube, and Flickr, along with other social applications that may be applicable to your business. As you do this, keep track of URLs or specific comments that are relevant to you.
Tip: If you know of specific support forums that reference your brand, product, or service, you will need to search these separately. First, tools like BlogPulse index blogs, as the name implies. They do not typically index support forums and social communities. Second, many of the support forums—for let’s just say technical reasons—are largely invisible to indexing and search services. Therefore, you will need to search these, often as a member yourself, in order to add this data to your overall results. Do take the time to do this—this can be the source of the some of the best data. The easiest way to search support forums is through the search tools supplied with the forum.
Thursday’s Wrap-Up
Today you gathered a larger set of metrics and then surveyed the blogs and social applications for evidence of conversations. The goal of this exercise is to begin putting together a map that connects the people who are most likely to be talking about you, or talking about others in your industry, with the actual conversation that they are having. This will reveal the types of recommendations that are occurring. When you combine this with the metrics you’ve identified in the first part of this exercise, these conversations and the references they contain will ultimately show you the value of influence on the social web.
Friday’s One-Hour Exercise
Today you’re going to spend an hour writing up what you’ve pulled together this week. Spend the next hour condensing what you’ve learned. Relate it to your social feedback cycle, touchpoint map, influence measures, and metrics selected and to your current marketing plan.
Social Feedback Cycle
Pull out your social feedback cycle. Look at any specific comments you found using BlogPulse or when searching support or other private communities. The conversations you found are entering the purchase funnel at the point of consideration. Then ask yourself these questions:
- Are these comments helpful, or are they creating obstacles that you have to overcome?
- How many of these specific comments can you relate to campaigns that you’ve run in the past?
- Is there a conversation that you found that references a customer service experience or a change in product design?
- Have any of your prior marketing messages referenced this same thing?
Touchpoint Analysis
Look at your touchpoint map and consider the following:
- How many of the touchpoints or experiences created have been reflected in your search of social content?
- How do your digital touchpoints drive social conversations?
Influence
Look at the Net Promoter Score surveys you completed this week and at the overall score you calculated. You should see the beginnings of a cohesive view when you compare this with the notes you have added to your consideration cycle and touchpoint map.
- If your Net Promoter Score and survey responses are distinctly middle-of-the-road—6s, 7s, and 8s—then it’s likely that you have also found relatively little talk or content on the social web.
- If you have 9s and 10s—or 1s and 2s—you probably found a lot more. This is a direct indication of how much the social web is impacting you.
- If you’re in the middle, the impact is less notable. This means you are missing out. Raise the performance of your touchpoints, and participate on the social web to get the conversations going.
Metrics
Finally, look at the metrics based on Table 7-1 and integrate those with your Net Promoter Score, social feedback cycle, and touchpoint map.
- While you may not have actual data at this point, create the shell for your report card based on the data you expect to begin collecting.
- Build relationships with the sources of that data.
Friday’s Wrap-Up
You’ve covered a lot, and it is important to document and organize what you’ve learned. In the upcoming part of the book, you’re going to start looking at specific social media components and applications. Based on what you’ve learned and documented this week, you’ll be building selected components into your actual social media marketing plan.
What your customers have to say about you is where the rubber meets the road. By talking with a small set of customers, you are seeing how to begin a systematic and ongoing evaluation of all customers, current and prospective, and how to use what you have learned or will learn to refine your marketing. Congratulations! You are now ready to confidently step into the social web.
Chapter 7 covered the concepts and practices associated with understanding influence and applying quantitative measures to your social media–based program. Chapter 7 covered the following points:
- The measurement of influence is critical to successfully implementing social media. The Net Promoter Score works very well for capturing and tracking this.
- Influence—rather than control—is the central element you have at your disposal on the social web.
- Taking the time to gather and distill quantitative metrics is essential. Speak with IT, your webmaster, your media group, and your CFO to develop a comprehensive dashboard and report card that include potential social measures.
- Integrate blog-indexing services and any relevant online data that you have access to into your measurement platform.