
Chapter 13
Week 1: Objectives, Metrics, and ROI
Walking into a ballgame, you’ll often hear someone shouting, “Programs! Get your programs! Can’t tell the players without a program!” I can’t think of a better analogy for this chapter: It’s all about nailing down—in writing—the metrics you will use to measure progress toward your goals. Knowing what to measure—and indeed what social media channels to apply—begins with your business objectives and your audience.
Chapter Contents
- The Basis for Social Media Metrics
- Choosing Social Media Metrics
- Real-World Connections
- Planning for Measurement
- The Main Points
The Basis for Social Media Metrics
In any marketing program, it’s usually safe to assume that the fundamentals of the program are at some level found in the business objectives of the firm or organization. However, it’s not universally true, and it’s often even less so when the temptation to try new technology creates a desire to experiment or to adopt some technique you may have heard about or seen used somewhere else. To avoid this trap, it’s important that everything you do begins with a firm grasp or statement of business objectives.
Aside from the desire to experiment (aka picking the technology first), a second challenge can arise: Your organization may be highly departmentalized. It may be, for example, that what you are doing as a marketer is actually distanced a bit from operations—perhaps by control and ownership issues. The result is one or two degrees of separation between business objectives and marketing efforts. When applying social media, it is critical that your business objectives and social marketing efforts be tightly linked.
Why? Think back to your touchpoint map and the social feedback cycle. Each marketing touchpoint—every interaction between your brand, product, or service and your customers—potentially triggers a conversation. Recall the Chili’s “To Go” signage and separate “To Go” store entrance: Both of these drive (favorable) conversations among takeout customers that are then expressed in the social feedback cycle. On the social web, your customers drive the conversations.
With traditional advertising and marketing, you get to do the talking. You get to tell your potential customers what to expect, why whatever it is that you offer carries value, and how your customers will benefit from choosing you over a competitor. If something goes wrong—for example, if an item is out of stock or a flight doesn’t arrive on time—you can fix it after the fact by offering an apology, providing a future discount, or making some other similar gesture. So not only can you make amends with your inconvenienced current customer, but your next potential customer will still see your original promise, with the implied benefit still intact. With traditional media, preexisting brand or product issues aside, you always start with a clean slate. This is not the case on the social web. While you can make amends with a customer who feels wronged, this same customer will have already told others that your original promise was not met. This social media adds its voice to your voice, and combined voices influence the next customers.
Define Your Objectives and Audience
It all adds up to this: Regardless of where your directives for traditional media come from, your directives for social media must be tightly coupled with operations-based efforts and your business objectives because social media links experiences—not promises—with the resulting conversations. This linkage—shown in Figure 13-1 along with the conversations and resultant actions—is at the core of what social media metrics are all about.
Figure 13-1: Objectives drive social media metrics.
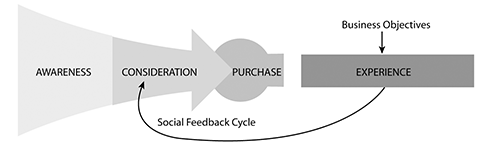
On the social web, conversations are driven by actual experiences, which are themselves driven by operations policies and processes. Accepting that the conversations that really help you are ultimately based on what happens when people try your product or service means that your social media metrics must be linked to your business objectives.
So, before you start into a social media program, meet not only with your marketing team but also with your product managers, business unit leaders, and operations team. Review customer service calls and look at product returns and the issues that drive them. Talk to HR. Tie your social media objectives to the specific business objectives that drive improvement, and in doing so identify not only your choice of social media channels but also the metrics that will indicate success (or lack of) within those channels. Then—and only then—apply the social media–based marketing techniques covered in Part III as you work toward those objectives from a holistic marketing perspective.
Key Performance Indicators
With your business objectives defined, next up is establishing the KPIs (key performance indicators) that are both available to you (or could be) and that fit with your organizational or business culture. Take the following for example:
- If your business or organization is highly motivated by sales conversions, then look for KPIs like clicks and close rates associated with the purchase funnel that lead to conversion.
- If your organization is all about brand visibility or reputation, then tie instead to KPIs that indicate your relative presence on the social web—for example, likes or +1s and any trends over time within your specific audience.
In selecting your key indicators, it is equally important to think through the kinds of social activities that your audience—or various components of it—may be engaging in. Your audience may be actively reading blogs but not at all interested in actually blogging themselves. These types of differences in behavior will certainly impact your choice in the activities you offer them and hence the types of metrics that are available for analysis.
Tip: In addition to measurements and the metrics you can identify and collect, be sure to tap resources like Forrester Research and eMarketer for baseline data and the trends that provide context to your quantitative objectives. Both Forrester Research and eMarketer offer a free newsletter in addition to subscription services. Featuring timely data and quick insights, both should be part of your regular reading.
eMarketer: http://www.emarketer.com
Forrester Research: http://www.forrester.com
What and Where to Measure
Measuring different aspects of social media allows you to evaluate what is happening at various points in the purchase process and on the social web, something shown in Figure 13-2. In the next section, you’ll revisit the metrics table from Chapter 7, “Week 4: Influence and Measurement,” and Chapter 8, “Week 1: Build a Social Media Campaign.” This time you’ll select the metrics that are essential to you and then integrate them into your plan.
Figure 13-2: Metrics and the social feedback cycle
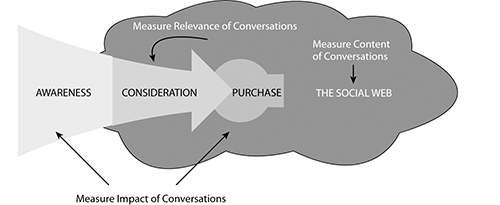
Looking at Figure 13-2, you’ll see various applications of metrics as they are collected at specific points. In the next section, I’ll present various measurement points. You can use one or more, or all of them, to help build a robust measurement platform for your campaigns.
Tip: Because social media is a moving target, you’ll want to establish a baseline for each of the metrics you choose to collect and then track those metrics over time. It is often the change—and not the absolute value—in a given metric that is important in establishing an ROI for social media–based campaigns.
The three types of metrics that I suggest collecting are those aimed at
- Quantifying content: the social conversations and artifacts themselves
- Quantifying relevance: the degree to which what is being said matters to you
- Quantifying impact: the bottom line, the net benefit, the direct measure of the change in desired outcomes following exposure to a socially created and delivered message
Just as social media is a complement to your existing campaigns, the metrics that apply to social media are a complement to your existing measures. For example, you looked at the purchase funnel and saw the social feedback cycle that links post-purchase measures of satisfaction and the likelihood of a positive recommendation. Recommendations and similar conversations are the drivers of what happens in the consideration phase, between awareness and purchase. The metrics that quantify them are just as much a part of your marketing program as rating points and market share.
Social Content Creation
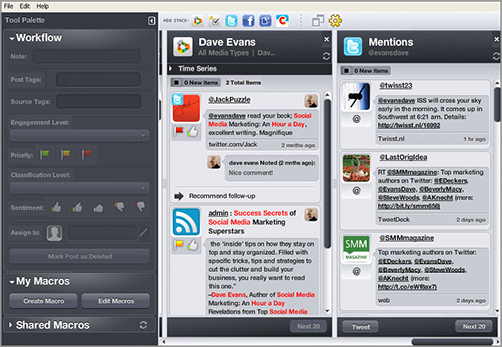
The recommended starting point in gathering social media metrics is the social web itself. It’s the most direct indication you can get with regard to understanding and tracking what is being said about you. If you measure nothing else, at least measure the relevant conversations as they occur on the social web. There are numerous platforms, including complete marketing toolsets from Radian6, Alterian’s SM2, NetBase, Sysomos, and Visible Technologies. Figure 13-3 shows the Radian6 Engagement Console, one of the most popular listening and response tools. Of course, you are always welcome to build your own. Beginning with tools such as Google Blog Search and Google Alerts, you can go a long way toward gathering, responding to, and tracking social media posts.
Beginning with content measurement has the added benefit of setting you up to listen to what your customers are telling you. If this is your first marketing effort outside traditional media, this can be an especially insightful starting point. One of the most valuable aspects of the social web for marketers, and specifically with regard to the role of social media, is its ability to provide a clear, detailed picture of what the people who matter to you are saying about you and what they are telling others. Again citing the ZenithOptimedia study referenced in Chapter 3, “What Is Social Media?” there are an estimated 3.2 billion word-of-mouth conversations, worldwide, each day—about 2.3 billion references to a brand, product, or service, either directly or through a reference to associated advertising or media. Social web data services provider Gnip reported in November 2011 on the online news site Mashable that it delivered 30 billion pieces of social media content to its paying subscribers that month, again working out to about a billion per day. The absolute number of conversations that reference your firm or organization directly may be small, but if you expand what you are listening to so that it includes your industry, suppliers, competitors, and customers and then roll that whole collection forward as more people, globally, switch to smartphones, you’ll find that a larger conversation is surely happening—one that is definitely worth hearing.
Figure 13-3: Radian6 Engagement Console
Tip: Attention B2B marketers: The potential for using the social web to follow not only your firm and your competitors but also your suppliers and customers is huge. Look for the communities that support them. Participate, pay attention, and take notes on what you find there.
One of the easiest ways that a measurement-oriented listening program built on the social web can be started is through a private research community. Think of these as a sort of community/focus group hybrid: A place where a dedicated group—usually composed of a few hundred people—is regularly consulted in situ on a range of issues that often have relevance to marketers and product developers. Although these are not social web communities per se—they have been formed by design and are maintained primarily for purposes of research—they do represent a significant source of knowledge and are a great step up from one-off focus groups. Firms like Communispace and Passenger specialize in these types of listening applications. You saw two examples of Communispace applications, one for Hallmark in Chapter 3 and another for GlaxoSmithKline in Chapter 5, “Week 2: The Social Feedback Cycle.” Naturally, these types of listening applications provide detailed metrics and are well worth your consideration.
Tip: Thinking back to Chapter 12, “Week 5: Social Interactions,” it is essential when considering the use of managed applications that you get involved and stay involved. Unlike traditional media campaigns that begin and end on command or focus groups where your brand is often anonymous, social applications result in visible, durable relationships between people and your brand that take on a life of their own. By being involved and by thinking clearly about how a managed program will evolve and play out, you not only benefit from the program itself, but you also set in place the basis for a true community built around your brand and the larger experiences you provide as your overall social media program expands later on.
Social Content and Specific Offers
It can be useful to gauge the relevance of specific social media channels as the conversations they carry enter the consideration phase of the purchase process. By relevance I mean the degree to which the conversation helps a potential customer relate to your particular offer. This kind of measurement can be helpful in prioritizing social media channels. In prior sections, for example, I referenced the application of social media and listening to B2B marketers. Social media is applicable to suppliers and partners right along with customers and competitors. You are probably interested in what your customers are talking about if your business objectives center on boosting sales. Alternatively, if you are looking for a competitive advantage, you may find the conversations between your suppliers and partners to be valuable.
This same sort of thinking applies to essentially any listening application involving social media. In all cases, you’ll want to track the references to specific terms, or mentions of specific sources, as they show up in the conversations that your customers are having. For example, in order to locate the most useful social applications from the perspective of your customers, you need to know what they are participating in. This can help you to design and guide your own social media campaigns as well as provide insight into some of the marketplace dynamics that drive your business.
The Ultimate Goal: Conversion
Finally, social media can have a pronounced impact on the activities depicted through the purchase funnel. In Chapter 5, I offered the following tip:
Tip: Your promise minus your delivery drives what your customers say at and after the point of sale.
To recap, if the social web is full of beneficial conversations about what you offer, you’ll need to do less than you would otherwise do to get a potential customer across the goal line and talking about you. If the social web is working against you, you will instead have to work harder. You can actually tap your basic purchase-funnel dynamics and use them to gauge the impact of your social campaigns, often without collecting any data beyond what you are collecting now.
Consider the assessment of effectiveness for traditional ad spending. By comparing changes in awareness with changes in conversions at the point of sale, classical marketing analysis draws a relationship between the spending required to achieve certain levels of awareness and certain levels of consumption. You’ve likely gathered (and will need to gather before launching social media campaigns) a reasonable base of just this type of information. You probably already know how changes in awareness drive changes in purchase behavior. You know the lower limit of enough awareness—in other words, the lower limit of ad spending below which the impact is roughly the same as not advertising at all—as well as the upper spending limit above which saturation occurs and incremental sales per dollar spent begin to slow or even drop. Between these points, if you have the data, you can draw a fairly robust baseline relationship.
Enter social media. Beneficial conversations on the social web have a neutral to positive impact on the conversion rates for the portion of your audience that comes into contact with them. This, by the way, is why it’s so important to establish both your business objectives and your audience behaviors before you start your campaigns. If you’re all over YouTube but your audience isn’t, then your viewership metrics are meaningless and your business gains will be minimal at best.
In the previous section, I presented a basic approach to the design of your social media metrics: Begin with your business objectives and the capabilities or social media–related behaviors of your intended audience. At the macro level, you look at content, relevance, and resultant impact as a primary guide in what you want to be measuring. If you’re starting out, you focus on content and get a firm handle on what (if anything) people are saying about your brand, product, or service. If you have a blog or a basic support forum or community, if there is evidence of a meaningful conversation about your offer, focus on the consideration phase or your actual conversions and look for the impact of social media.
In the next section, you’ll put all of this together as you define your starting set of social media metrics. Look at Figure 13-4. Although it’s a bit of a chicken-and-egg scenario, the logical flow of social media–based content that I’ll assume—and the metrics that stem from that flow of content—begins on the social web with the content itself, with the conversations that are of interest to you. This is, essentially, a listening approach to collecting and tracking metrics: They talk, you listen, and then you track the changes in what is being said over time and evaluate how they help or hurt you.
Figure 13-4: Metrics and the social feedback cycle
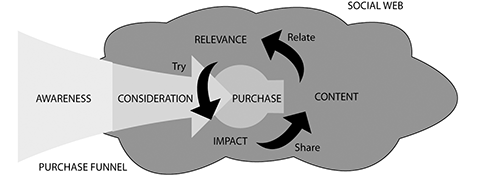
Your study of metrics continues with the relevance of this content and its entry into your marketing world at the point of consideration. How are these conversations being used? Are the conversations central to the benefits of what you offer? For example, are people specifically calling out a product feature that your competitors don’t have or one that your product lacks—or is the conversation more generic, more focused on the industry as a whole? The former tells you that your overall message—or that of your competitor—is getting through. The latter says, at least as viewed through these conversations, that either you have a “me-too” or undifferentiated product or you are operating in a low-interest segment. This is still very useful data: It provides guidance on how to go to market.
Metrics in Motion
Social media metrics are evolving as the discipline of social media marketing evolves and the drive for robust metrics across a range of marketing and advertising applications intensifies. As a result, developing a solid metrics base for your activities often involves a combination of well-understood data—for example, the time spent on your company website—along with trends that you develop over time based on the wider range of data available to you. This underscores one of the keys to establishing a solid quantitative base: Measure and collect more than you think you’ll need, and then dig into the trends you observe. In so doing, you’ll uncover the key relationships that matter in your particular business and your use of social media.
Content Metrics
Beginning with the metrics associated with social web content, Table 13-1 shows the relationship between content measures aimed at quantifying your audience—who is talking about you and your industry—and what they are saying. If you only do this much, you’ve made great use of the social web and social media. The metrics that you can collect will be used to indicate how the total of everything else you are doing—including the actual delivery experience—is perceived.
You can use this data strategically to isolate the contributions of your evangelists as well as the fallout from your detractors. Of course, you can also use this data in a highly tactical way (for example, to prioritize product improvements or schedule your response to competitive moves). Note as well the return of the Net Promoter Score. While the actual Net Promoter Score methodology involves directly questioning your audience and applying a specific 10-point scale, phrases that you can pick up and measure on the social web that begin “I’d highly recommend” can certainly be used as a directional indicator in assessing the overall health of your brand. As well, you may find your own promoters being picked up on the social web.
Tip: Do not skip the formal Net Promoter Score, as presented in Chapter 7, in favor of an abbreviated assessment. You will not get the reliable data that you need in regard to this foundational social media metric unless you adhere to the methodology presented in The Ultimate Question, by Fred Reichheld (Harvard Business School, 2006).
Table 13-1: Content fundamentals and metrics with suggested sources
| Fundamental | Metric | Source | Reveals |
| Content | Makeup of blog posts, recommendations, tweets and RTs, likes, and +1s | BlogPulse, Google Alerts, Cymfony, Radian6, Sysomos, NetBase, Alterian SM2, and Google (search) | Who is talking about you, what people are saying about you and your industry |
| Counts and Trends | Volume | NetBase, Sysomos, Radian6, Alterian SM2 | Trends and volume changes over time: popularity |
| Polarity | Sentiment | NetBase | Positive or negative nature of posts |
The collection method you use can be as simple as tracking Google Alerts, for example, and then making note of the source of the content referenced in the alerts. This kind of analysis, though it may be a bit labor intensive, needn’t cost you a ton of money.
Tip: Consider using an intern if you approach the collection of data manually. The opportunity to explore the social web and extend some of the basic social media metrics tools aimed at content is rewarding and a great first step toward a marketing career. This can be beneficial to both you and your intern.
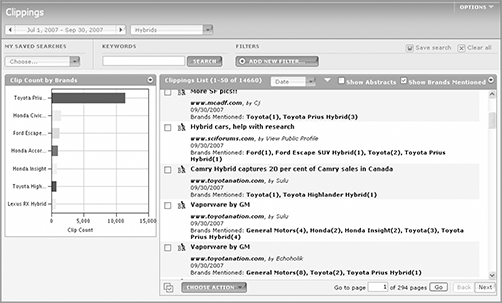
Alternatively, you can enlist any of a number of service providers to collect, distill, and report this data for you. Some of these service providers—in particular Cymfony—offer social media dashboards that include offline audience measures in addition to online. By combining online and offline information, you can more effectively tie your social campaigns to your traditional marketing efforts. Cymfony’s reporting module, listing online conversations across media types, is shown in Figure 13-5.
Figure 13-5: Capturing content metrics
Relevance Metrics
Continuing with the flow of content on the social web, the metrics associated with relevance—again, in the sense of social media experiences that link or relate the interests of potential customers with what you have to offer—are typically of interest to marketers. Although not perfect, the idea here is to link the metrics around the conversations on the social web that you covered in the prior section with the actual impact on your desired conversions, something we’ll cover in the next section. Table 13-2 shows the relationship between the selected relevance measures that help quantify the contributions of social conversations in terms of influence, engagement, and loyalty.
Unlike the content metrics, many of the relevance metrics are associated with your own social media efforts—your company website, or other properties or assets for which you have access to the underlying analytical data. In evaluating relevance, what you are looking for in these metrics is an indication that the associated content is being used as a part of the decision-making process. You are specifically focusing on the application of these metrics and the weight given to the social media content as it enters into the consideration processes that support conversion. As with nearly all social media metrics, the key is to track what you find over time. You will discover the elements that are most important to you and those that are most valuable in specific situations.
Tip: Social media measurement is based as much on heuristics—using what is available to make the best of what you have—as it is on more traditional quantitative and statistical analysis. Don’t be afraid to go with your gut: Your experience is worth a lot when it comes to making sense of these new channels.
Table 13-2: Relevance fundamentals and metrics with suggested sources
| Fundamental | Metric | Source | Reveals |
| Relevance | Time on site, bounce rate | Web Analytics: Google Analytics, Omniture, Webtrends | The value of the opinions and conversations to those interested in purchase. |
| Engagement | Pass-alongs, comments-to-posts ratio, Diggs, Stumbles, bookmarks, podcast listens, and views | Web analytics, Google Analytics, Omniture, Webtrends, DoubleClick, Digg, StumbleUpon, FeedBurner | The interest levels in your message. Are customers willing to pass a referral along given a potential gain or loss of personal social capital? |
| Loyalty | Blog posts for brand, recommendations, tweets, and similar | BlogPulse, Google Alerts, Cymfony, Techrigy, Google (search), Technorati | The context and intensity of blog posts. Are people sticking up for you? This can have a direct impact on whether or not this information makes it to the consideration process. |
Impact Metrics
The prior sections—content and relevance metrics—covered information picked up by listening on the larger social web. This was then enhanced by gauging its relevance through the analysis of data available from social media tools that you may be using now (for example, a company blog or support forum). By taking an additional step—connecting the metrics associated with social media content and its relevance to the consideration processes within the purchase funnel—you can use the same tools you have in place now for measuring advertising and marketing effectiveness to assess the net impact of social media on your marketing program. Table 13-3 shows the relationship between content measures aimed at quantifying the impact of social media and indeed the entire social feedback cycle within your purchase funnel.
Looking at metrics from the point of the view of conversion impact brings the value (positive or negative) of social media home. When looking at your web analytics (for example, in evaluating your online commerce results, promotional offer uptake, or simply your incoming requests for more information), the first thing you want to establish is a baseline. If there is already some degree of social conversation happening, then your current conversion measures reflect this. This is your baseline.
Table 13-3: Impact fundamentals and metrics with suggested sources
| Fundamental | Metric | Source | Reveals |
| Content | Referrers, demographics | Web analytics, Google Analytics, Omniture, Webtrends, DoubleClick | To whom your social media campaign is appealing. |
| Influence loyalty | Time on site, bounce rate | Web analytics, Google Analytics, Omniture, Webtrends, repeat customers | How involved your audience is with your message and brand, product, or service as a result of exposure to social media. |
| Action | Conversions, reviews, recommendations, tweets, and similar | Web analytics, Google Analytics, Omniture, Webtrends, reviews and ratings platform, Net Promoter Score | The number of times a desired outcome occurs following exposure to your holistic campaign. Tweets or similar references to a definite purchase or action reveal this as well. |
When you combine this with the additional historical data that you have around spending, awareness, and conversion, you can place bounds on the deviations from your baseline awareness/conversion charts to account for competitive moves, economic conditions, and many of the other details that complicate the real-life calculation of impact around any single media channel. Sure, this is a fundamentally empirical approach—that is to say, based on observation rather than hard science—but is nonetheless a valid approach. Precisely because it is empirical, it has the nice side benefit of placing you in direct contact with the flow of social media and the data associated with it.
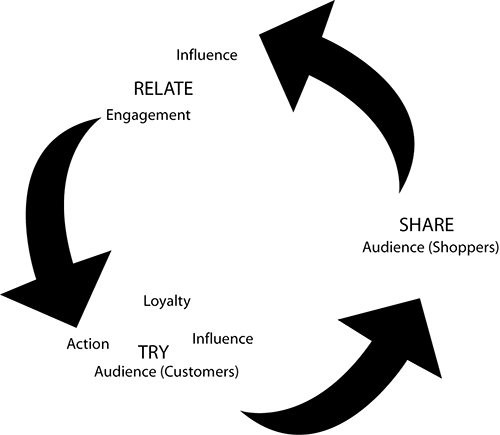
In the previous section, I presented the fundamental indicators and the associated social media metrics. The intent was to provide an explanation of how these metrics can be derived from conversational and analytical data. This is important because there is no social media sensor that you can wave over the Web to see what’s going on—at least not yet. Instead, you have to measure what is visible, track it, and then derive the results based on what you see. In the next section I’ll tie these fundamentals to five key areas of interest to most marketers: audience, influence, engagement, loyalty, and action. Within each of these areas, as shown in Figure 13-6, you’ll see how the suggested metrics can be used to establish a baseline and then build on it as your social media program is put into practice.
Figure 13-6: Connections to the social feedback cycle
Audience
An understanding of your audience adds depth to the conversations you uncover by telling you who is leading them versus who is being led. What they are saying—the actual conversation—is only part of the story. Knowing who is saying it and who is listening gives you very valuable insight when planning your social media campaigns. By tracking not only the content but also its sources, you can pinpoint your influencers. The sources of conversations are available in most of the commercial tools referenced; this is a great feature to look for when selecting a metrics partner.
Taking audience measures one step further, once that audience arrives at your site—influenced by whatever they found on the social web—you’ll want to measure what they subsequently do. Here, you can turn to your own commerce or conversion analytics and supplement that with your web analytics (for example, referrer data, which is good but not always reliable) or tracking data from a third party like DoubleClick (which is much better) when and where applicable.
Tip: Use audience measures to answer questions such as “Who are the influencers?” and “Are those they influence more or less likely than others to follow along?” Tools like Radian6, Alterian SM2, and BuzzStream are especially useful for these types of measures.
Influence
Influence, one of the key drivers of the interest in the use of social media in marketing, is present as a factor in both relevance—the likelihood that a conversation will lead someone to consider or reconsider your offer—and impact—the actual increase (or decrease!) in the likelihood of a purchase based on social media exposure. Influence is evident in two fundamental metrics that are easily obtained: time spent and bounce rate.
Time spent, as its name implies, indicates how much time people spend with your site, blog, or other online content that you maintain. More time spent generally correlates with higher interest. In the social sense, higher interest typically follows from an experience that has been relatively more influential. Think about it this way: If a trusted source whom you know to be a domain expert tells you to go and look at something, even if you don’t understand why right away, you will tend to spend more time considering it, precisely because it’s been recommended by a trusted source. That is influence.
Tip: If you measure conversations that include strong indicators of active recommendations, look for corresponding increases in time spent at the destination point (for example, your site or offer page).
Bounce rate is a sort of inverse indicator; generally, you want it as low as possible. Bounce rate measures the percentage of landing page terminations compared with all landing page arrivals. A bounce rate of 100 percent means that everyone who landed looked and split.
Unless your entire campaign is built on a single page and has no clickable call to action, the bounce rate is a clear indicator of arrivals who lost interest and moved on to some other search area or site rather than looking at your offer in further depth (clicking into your site). Like time spent, bounce rate is related to influence; higher influence in directing people to your site, all other things being equal, will lower the bounce rate.
Tip: If you measure conversations that include strong indicators of active recommendations and your bounce rate is still high (for example, over 50 percent) or is starting to climb, look at the landing page and check that the experience it provides is consistent with the likely interests or motivations of those arriving. If it’s inconsistent, fix it.
Engagement
Often talked about but seldom grounded in hard numbers, engagement is one of the most elusive social media measures. Engagement, in the context of social media marketing, means simply the degree to which someone feels attached to your product, brand, or service and the social media elements that are involved with it.
Engagement—or at the least, a very good surrogate for it—shows up in the consideration phase as action taken. Examples are the number of items sent to a friend and the comment-to-post ratio on your blog or those of others that reference your brand, product, or service. Send-to-a-friend actions are particularly good, because these indicate the degree to which someone spent enough mental energy to conclude that what you offer would be perfect—for someone else. If you are simultaneously tracking sources, then you can also get a sense for engagement as it regards that source. When you see a disproportionate share of traffic arriving from a certain site or community, you can conclude that a relatively high degree of engagement exists within that community. This is a point that technology maven Robert Scoble has made with regard to Digg. When your content generates Diggs, you get a lot of traffic. Digg is an engaged community. Look at Digg and StumbleUpon and the discussions or recommendations of your content through RTs, +1s, and likes as indicators of engagement for your own social media content. If you are using podcasts, look at the numbers of downloads using the great toolset available, at FeedBurner.
If you are maintaining a blog—or if you are evaluating a blog as a source of influence and interest in your content—the ratio between posts and comments indicates relative participation: More comments per post indicate that your audience is doing relatively more of the talking. That’s generally good.
Tip: “Comments to posts” or “posts to comments”? You’ll find this measure expressed both ways. While “posts to comments” is more popular, “comments to posts” is the measure that actually rises in value as the thing you are generally after—audience participation—improves. Either way, they both tell the same story: how engaging your blog is.
Loyalty
Loyalty means spending time with something or someone on a repeat basis: coming back for more as a result of consistently choosing this over its competing alternatives. In the context of social media marketing and relevance, it means coming back to the point of consideration, moving consistently from the general conversations on the social web back to the social media–driven entry point into the purchase funnel. The more that someone is coming back to make or consider a purchase, the stronger the indication that this person has a relatively high degree of loyalty (or would be willing to develop a high degree of loyalty if you ultimately do your part). Once purchase intent is expressed, you can turn to things like cart abandonment, analogous in commerce to bounce rate in landing pages, and similar measures that indicate loyalty and ultimately conversion.
Repeat customers—and the conversations they provide through ratings, recommendations, and reviews—are an obvious indicator of loyalty. Tracking an index based on your repeat customers along with what they are saying and then tying this to conversational metrics gives a forward-looking (that is, predictive) metric with a timeline roughly equivalent to your sales cycle. How? Simplified, it works like this: If your sales cycle is 90 days and your typical repeat customer buys from you twice per year, then when your repeat customer conversational index begins to dip you can expect to see a magnified impact about two quarters from now. It’s an early warning. You have 90 days to jump into the conversational data and find out what the cause is and then develop a proactive response through a combination of efforts (for example, targeted email and social media) that are specific to your repeat customer base.
Action
Action is the bottom line: Did the conversion happen or not? Did social media play a role in this happening—or not happening? The most straightforward way to approach your development of action-oriented metrics is by looking at your conversion rates and comparing them with your benchmarks for conversion rates in the absence of social media. The best way to assess impact—and to get a handle on ROI (see the related sidebar)—is to establish a robust baseline that describes the relationship between the marketing activities you are currently engaged in (spending levels, awareness, and sales, for example) and then compare this to what you observe as you introduce social media into the mix.
Many of the metrics you are likely to have at hand are related to both conversion and the number of people expressing intent versus the number who actually convert. Add to this the direct observation of social media: reviews, recommendations, and posts on Twitter and similar social forums, all of which provide guidance in understanding the role that social media is playing in driving (or dissuading) conversion. Look to your web and commerce analytics tools, your reviews or review platform, and of course to your Net Promoter Score and its trend over time.
Assessing ROI
Fundamental to measuring or assessing ROI is determining what constitutes the return. You opened this chapter with the requirement of setting business objectives, so be sure to tie ROI to your business objectives. Remember too that ROI is a financial measure: It is defined as a change in net revenue given an investment that either drives sales or reduces expenses. Essential in developing a robust indicator of ROI is tracking that measure over time to gauge the effectiveness of specific marketing activities as they relate to your business objectives. This gets to the heart of empirical measurement. Ultimately, if you sort through the data you have—or could have—you can create a reasonable measure of ROI. Create a baseline for your current activities and a wide range of marketplace scenarios, and then use this data to separate the various contributions of specific marketplace efforts. As you introduce social media, look at the changes in what you observe, and from this make your case for ROI.
Based on what I’ve presented in this chapter, the exercises this week will lead you through the identification of specific metrics—based on your business objectives—that are most useful in guiding your social media implementation. The exercises this week focus on setting objectives, evaluating the data sources that you looked into in Chapter 7 and Chapter 8. This week you’ll be identifying a starting set of metrics to support your plan.
Featured Case: Jig-A-Loo: Grassroots Social Marketing

Jig-A-Loo is a silicone-based lubricant and water-repellent spray. It has been used in the commercial and industrial sectors in Canada since 1958. It was launched in 1998 to the Canadian mass retail market and launched globally in 2007. The campaigns’ goals were to drive online awareness of Jig-A-Loo, ideally resulting in consumer trial of the product and an increase in frequency of product use.
Fanscape’s Grassroots department instigated strategic online buzz and fan activation about Jig-A-Loo in social online venues in 2008. The strategy behind Fanscape’s approach was twofold:
1. Focus on extremely targeted social media gathering places that would be responsive while tapping Fanscape’s knowledge of the social media space and its relationships with site owners along with analytics tools such as Quantcast and comScore’s Media Metrix suite.
2. Engage the target audience by presenting solutions to common problems that could be solved by the use of Jig-A-Loo while being fully transparent with the messaging, as shown here.
As of the end of May, the team had conducted over 20 extremely targeted responses on question-and-answer sites; posted 7 videos across user-generated how-to video sites, resulting in over 2,000 video views; and posted a highly researched text and photo how-to post across five sites. The Yahoo! Answers screen shot shows a typical question and answer. To assess the acceptance of answers, the number of direct, overt references to the connection between the respondent and the product were tracked.
Monday: Your Business Objectives
Today you’re going to spend an hour finalizing your business objectives. This is the opening exercise for the creation of the metrics portion of your social media marketing plan.
Monday’s One-Hour Exercise
For today’s exercise, do the following:
- Reach back to your exercise from Chapter 5, and look at the business objectives and success metrics you defined when you created your social feedback cycle. At the same time, pull together the larger business objectives that define your company or organization’s success goals for the coming years.
- Connect each of your specific goals and success metrics set in Chapter 5 to one or more of your overall goals.
- Define each of the success metrics, and identify the source of the data that you’ll need to support this metric.
Tip: A set of worksheets covering this week’s exercises can be found in Appendix A, “Worksheets.” In addition to these printed worksheets, you can also download electronic copies and access related resources on the book’s companion website. Complete information regarding these resources and the website is included in Appendix A.
Monday’s Wrap-Up
Today you pulled your business objectives into your social media plan. This is the essential first step in setting up for success since it grounds your plan in the things that are valuable and, as a result, actually drive your business. Don’t worry that you haven’t actually connected your business objectives to your plan yet; you will.
Tuesday: Your Audience
Now that you’ve defined your business objectives and established in them the basis for your social media campaign, today’s exercise is all about understanding your audience. Knowing what they do online—reading, creating content, commenting or offering reviews, or doing nothing at all—is essential in developing a social campaign.
Tuesday’s One-Hour Exercise
Today you’re going to pull together the data you need to make an informed choice about the social media channels that might apply. You are not going to pick them today; you’ll do that in Chapter 14 when you make your plan.
In Chapter 9, “Week 2: Social Platforms,” I referenced Groundswell by Charlene Li and Josh Bernoff. The book takes a detailed look at the impact of social media and related technology and the resulting transformation of consumers. Pulling from the extensive Forrester Research studies, the authors have identified fundamental consumer behaviors for various demographic groups. For example, they have separated people involved in content creation—making and posting a video or writing a blog—from those who would rather simply comment. They’ve identified active participants versus spectators versus nonparticipants. This is a solid framework for today’s exercise as well as for your regular use when mounting social media marketing campaigns.
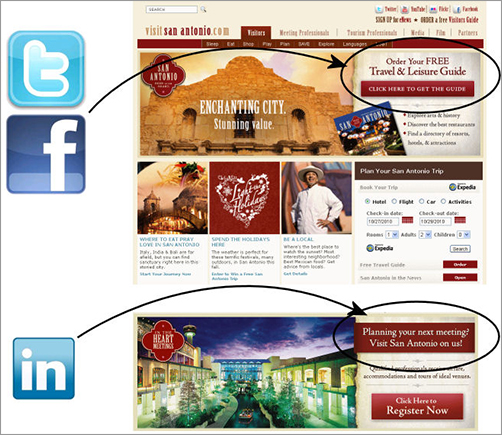
Featured Case: San Antonio Visitor’s Bureau
Powered by Smart Content, the San Antonio Visitor’s Bureau serves online media based on the origin of inbound traffic to its site. People arriving from Facebook and Twitter—think families—see offers for family activities. People arriving from LinkedIn—think businesses—see convention and business conference planning guides.
The campaign was measured using the Smart Content platform and the conversions were tracked. The results speak for themselves. While the overall site views remained constant, the conversion rate rose from about 4.5 percent to over 6 percent, an increase of almost 50 percent.
For more on Smart Content, visit the website here:
http://www.getsmartcontent.com
Tip: An excellent—and free—profile tool that provides a quick snapshot of your audience with regard to its use of social media can be found on Forrester’s website:
http://www.forrester.com/empowered/tool_consumer.html
http://www.forrester.com/empowered/index.html
The Forrester Social Technographics tool is updated annually and is available for both B2C and B2B application. In addition to the Forrester tools, the eMarketer newsletter referenced earlier in this chapter are an excellent source of high-quality trend and behavioral data.
To complete today’s exercise, do the following:
- Identify each of the audience segments—using standard age groups and demographics—that you are interested in with regard to your social media campaign.
- Gather internal data (or pull from your own knowledge) a picture of what each of your specific segments does when online.
- If you do not have this data—or if you simply want to check your data against the Forrester Research studies—use the free profile tool found at the Groundswell website.
- For each segment in your audience, create a profile of the typical behaviors you expect. Are they content creators? Do they write reviews? Do they watch TV all day?
Tuesday’s Wrap-Up
You now have a good handle on your audience and your business objectives. Keep this information in mind as you move forward this week.
Wednesday: Content Metrics
Now that your business objectives and audience behaviors are defined, it’s time to look at the metrics open to you. Over the next three days, you’ll work through the metrics that characterize conversations, the metrics that are indicators of interest and intent, and those that are directly associated with your purchase funnel. Each day as you finish, you’ll be adding one more set of metrics to your developing social media plan.
Wednesday’s One-Hour Exercise
Today you’re going to focus on conversational metrics: the things that define and indicate the intensity and polarity of what is being said about your brand, product, or service on the social web.
Today’s exercise consists of the following items:
- Look back at Figure 13-1 and the definition of your audience and your business objectives. Confirm that there is something for people to talk about and that the audience or audience segments you are focused on are themselves likely to be talking about it.
- List the specific features or unique attributes of your brand, product, or service.
- Create the same list, except do it for your competitors.
- Using Blog Search, BlogPulse, and Technorati, search for these items and write down (or summarize) what you find.
- Using Google, search for these same items on the Web and write down (or summarize) what you find.
- Trace the posts that you found back to their source. See if you can identify the type of audience member who contributed each item and ensure that you have accounted for this segment in yesterday’s exercise.
- Optional: If you have access to Radian6, Alterian SM2, NetBase, or similar, perform the same exercise using these tools.
When you have completed these items, integrate this data and its sources into the metrics section of your social media dashboard and report card that you created in Chapter 8. If you’d like to use this data to create your baselines for your selected measures, do so now. Otherwise, this should be your first action when you set up your metrics program and begin building your social media reporting tools.
Wednesday’s Wrap-Up
The point of today’s exercise is to create the beginnings of a baseline and to validate the existence of conversations that reference the products and services you sell or offer. Importantly, you may or may not find your brand name or your specific feature. Very likely, however, you will find information that is useful to someone who is considering your product or that of a competitor. If so, and you begin to track it over time, you can develop a solid understanding of the things that potential customers are encountering when they are doing their online research. This can be very helpful in identifying other marketing opportunities, finding competitive advantages or disadvantages, and gauging the perception of your industry.
Thursday: Relevance Metrics
Today you are after the connectors, the metrics that help you link the relevant conversations on the social web with your actual conversion process. What you are looking for, as an example, is evidence that site visits resulted from an interaction with an element of social media. Clearly, you cannot do this in all cases. Unlike online advertising, where you can generally (and as a best practice) use tracking tags and similar tools, you can’t always track directly the arrivals from a specific social media element and conclude that this visit was due to that exposure. What you can do, however, is tie the conversational metrics to your web analytics, for example, in cases where conversations are or should be driving people to your site. Similarly, you can track pass-alongs—both inbound (people arriving via a direct referral) and outbound (people sending referrals to someone. Of course, if you can employ third-party tracking, do it. More data is better.
Thursday’s One-Hour Exercise
To complete today’s exercise, do the following:
- Look back at the conversational data you collected yesterday. Does any of this reference your brand, product, or service? Is it positive or negative? Create a baseline that will help you establish a loyalty indicator.
- Look at your web analytics. Do the metrics such as time spent and bounce rate exist? If they do, collect them and establish a baseline. If they do not, talk with your IT or Web team and see if you can get them. Using the metrics you have, create a baseline for time spent and bounce rate so that you can track changes. These measures are surrogates for attributes like loyalty.
- To evaluate engagement and its contribution to connecting people to your offer, look at any metrics available to you that indicate a strong sense of participation or attachment: the number of send-to-a-friend referrals (pass-alongs), for example. If you maintain a blog, look at the ratio of posts to comments. Are people participating in the way you’d like them to? The same holds true for a particular blog that is important to you as a source of interest or traffic.
When you have completed these items, integrate this data and its sources into the metrics section of your social media dashboard and report card that you created in Chapter 8. If you’d like to use this data to create your baselines for your selected measures, do so now. Otherwise, this should be your first action when you set up your metrics program and begin building your social media reporting tools.
Thursday’s Wrap-Up
By connecting the general social conversations with your purchase process, the measure of both the content and the content source relevance helps you prioritize your spending. Many of the dashboard products referenced include this data so that you can quickly see where it is that you should be spending your time.
Friday: Impact Metrics
Today you’ll focus on the metrics that show the actual impact of social media where it counts: the conversion process. Whether you are asking people to try, buy, or simply sign up for your newsletter, understanding the differences in behaviors between those who are exposed to social media versus those who are not is critical in tuning and maintaining your social media campaign.
Friday’s One-Hour Exercise
Today you’re going to do the following:
- Looking at your web analytics, review your referrer data. Add to this any applicable internal data you may have that helps you identify the arrival of specific audience segments.
- Again, look at the average time spent on your site and the bounce rate, but limit it to the commerce portions of the site and the informational pages that directly support commerce.
- Look at actual conversions, the number of reviews created, and recommendations. In short, look at anything that helps support the difference in people visiting your site with and without exposure to social media.
When you have completed these items, integrate this data and its sources into the metrics section of your social media dashboard and report card. If you’d like to use this data to create your baselines for your selected measures, do so now. Otherwise, this should be your first action when you set up your metrics program and begin building your social media reporting tools.
Tip: The change in impact you observe can be positive or negative. If you are building a case for fixing something, then one of the potential justifications for this effort is that the current conversion rates for those who have been exposed to social media is lower than for those who have not.
Friday’s Wrap-Up
You’ve set your objectives, defined some basic behavioral parameters on your audience and its use of social media, and identified a core set of starting metrics. You are in the home stretch.
Chapter 13 built metrics into your developing plan. Don’t be fooled (or lulled) into thinking that you cannot measure social media. You can, and you should. Chapter 13 covered the following points:
- It is essential that you identify and clearly state your business objectives before deciding on specific elements of a social media program.
- The behaviors of your target audience are key both in setting the strategy and in identifying the metrics that will support your campaign.
- Conversational content can be measured, with the metrics leading to an understanding of who is talking about you and what they are saying.
- Metrics collected near and within your purchase process link the conversations to the actual impact on conversions. This is the data that can help you establish an ROI for your social media programs.