
13
Stress Testing
We now come to the final form of testing considered in this book: stress testing. These are some of the hardest tests to run and the most stringent checks on your application. Stress testing is a combination of testing load and error cases, as you push your system beyond its limits.
In the last chapter, we considered load testing, which ensured an application could perform up to its required performance. If a website can handle 10,000 simultaneous users, testing must reach that number without seeing a degraded performance. The pass mark for these tests isn’t just completion, but also the time taken for each action. Stress testing comes next, going beyond system limits.
How does your application cope when the 10,001st user attempts to join, a user tries to extend their connection beyond the maximum time limit, or the system runs short of memory? As with both load testing and error testing, these are rare events but are also those most likely to cause invalid behavior and encounter critical issues.
Like error case testing, these are tests that are designed to fail. The pass mark is that the user experience should be understandable and that the system recovers correctly afterward. This is another area that is often underspecified, so if you didn’t cover it in your specification review, your first task is to determine precisely what should happen in these cases.
It’s time to be really cruel to your system, to twist the screws and turn it up to eleven. Spare no mercy! It’s time to be as evil as possible with no holds barred. Your system will fail; the question is, can it pick itself back up again?
In this chapter, you will learn about the following:
- How to test excessive transaction rates
- Checking policed and unpoliced limits
- Identifying positive feedback loops
- Testing graceful degradation
- How limiting resources affect your system
- Soak testing and spikes of load
- Checking for successes and errors
As ever, first, we will consider the advantages and disadvantages of stress testing.
The advantages and disadvantages of stress testing
As one of the most extreme forms of verification, stress testing has a unique set of strengths and weaknesses:
|
Advantages |
Disadvantages |
|
The only way to find this class of issue |
Requires dedicated tools |
|
Discovers the limits of your system |
Requires high-quality tools |
|
Uncovers hard-to-find issues |
Harder to debug |
|
Finds software inefficiencies |
Less realistic scenarios |
|
Prepares you for overload scenarios |
Expensive |
|
Difficult to tell the ideal behavior in a failure mode |
Table 13.1 – The advantages and disadvantages of stress testing
Stress testing is the only class of tests where you push your system beyond its limits and check the application’s behavior when dealing with excess failures. It’s the only way to find the errors under load and uncover the real limits of its capacity. Your requirements might state a number you should reach, and your design might have a theoretical limit, but the only way to tell for sure is to push your system until it breaks. Now’s the time to run those tests.
Like load testing, stress testing finds issues that will not appear in any other tests and requires dedicated tools and time to run. It uncovers coding inefficiencies that might not arise in any other condition. Most of all, stress testing gives you peace of mind. Once complete, you definitively know what your application can handle, and you’re ready for the day the load becomes too much.
On the downside, stress testing suffers from all the disadvantages of both load testing and error case testing. It requires dedicated tools of high-enough quality that the system under load will fail before they do. Failures are difficult to debug because so much happens simultaneously, and like testing error cases, it’s hard to tell what the correct behavior is when failing. It’s also expensive to run and tries rare cases of loading that would only occur in your marketing team’s wildest dreams. Just in case your company’s next tweet goes viral or a celebrity mentions they’re addicted to your product, you’d better make sure you know what to expect if half the internet suddenly decides to use your application. We start by considering that case: breaching your specified transaction rates.
Stress test architecture
As with load testing, the architecture of a stress test involves identifying the inputs to the various interfaces of your system and sending high data rates in terms of the number of messages and message sizes. For client-server applications, that means having many mock client interfaces.
Many third-party applications can provide this functionality, such as LoadNinja and WebLOAD, or the basic commands can be written in simple scripts. However, full functionality, including control and reporting results, is a significant task, which is why third-party tools are so useful. See Chapter 12, Load Testing, for more details.
Breaching transaction rates
What if your application grew to 10 times the size? 100? 1,000? This might be a problem your company would love to have, but on that day, a vast numbers of users will get a first impression of your product. You only get one chance to give them a good experience, and stress testing is your chance to ensure that you achieve this.
For all the transaction rates that you can load test, you should also stress test beyond those limits to see your system’s performance. In practice, you should run these tests together: load your system within its specification to check for successful behavior, then keep turning up the rate to check what happens when it’s overloaded. In the same way that testing error cases is an extension of functional testing, stress testing is an extension of load testing.
You will need to produce a list of transactions relevant to your application, but consider the following examples:
- The rate of web page requests
- The rate of client connections
- The rate of client requests
- The rate of user signup
- The rate of user sign in
For stress tests, you must decide what acceptable behavior is. The following graphs show the number of transactions requested versus the number your application can process. A steady gradient indicates success – you receive 5,000 requests and send 5,000 successful responses.
Let’s say that your application is required to handle 10,000 requests per second (rps), and you test up to 20,000 rps. Eventually, all applications will fail under Denial-of-Service (DoS)-style attacks, where they are so busy handling incoming requests that they cannot process them correctly. The question is, what are your system’s limits, and how well does it behave beyond them?
In this first possible result, the application handles the load with ease:

Figure 13.1 – Handling additional load successfully
The gradient is steady past 10,000 rps all the way to 20,000 rps. In this test, your application can successfully process twice the specified load. Ideally, you need to keep testing to see where it fails, and you can let the product owner know they can specify a higher transaction rate, if they’d like.
The following case is more realistic, where the application fails to process additional transactions beyond its specified limit of 10,000 rps:

Figure 13.2 – Handling additional load with gradual degradation
The gradient is steady past 10,000 rps indicating the product can successfully meet its required performance, but beyond that, it spends so much time rejecting excess requests that it’s unable to handle the new load. Queries start failing between 10,000 and 11,000 rps, so you have no headroom. Your application can only just handle its specified load, so if live usage reaches that limit, then you imminently need to find ways to improve its performance. However, that is not the worst possible outcome, as shown in the following graph:

Figure 13.3 – Handling additional load with catastrophic failure
In this final example of output from a stress testing graph, the gradient is again steady past 10,000 rps but then enters a chaotic phase where the success rate varies wildly before settling at a permanently low rate. If you see this pattern, don’t trust the chaotic section of this graph, as it is likely to change every time you run the test. It indicates that the application cannot maintain that workload and is hitting internal limitations. Beyond a certain point, in this case, around 13,000 rps, the performance crashes, and only a tiny proportion of requests complete successfully.
Stress testing is designed to find these kinds of drop-offs in performance because they can be a source of major outages if they happen in live use. The product owner then needs to judge how likely that rate of transactions is in practice. Possibly the limit of 10,000 rps is way above your usual load, and you’d be delighted to have that much traffic. Or maybe you’re already approaching that limit, and the next successful promotion or viral advert could push you over. By being aware of these problems, you can prioritize their fixes.
In the next section, we will consider limits that are policed and which should reject excessive usage.
Policed and unpoliced limits
Rate limits are usually unpoliced – if you go over the specified rate, the application will do its best to service requests or perform the requested action. As we saw in Chapter 7, Testing of Error Cases, there are also policed limits, such as the number of configured users, which are designed to reject requests after a specified limit.
That might be a configured number of some entity, the maximum simultaneous connections, or the maximum number of operations your system can perform in parallel. Whatever the limits are in your system, identify them all and test what happens when you go beyond them. These tests are designed to fail, so the only question is, does the application fail gracefully, letting users know why their request can’t succeed?
You can also stress test these limits, repeatedly attempting to add more entities or connections beyond the maximum to ensure that an attack of that kind can’t degrade your system. This checks to ensure there isn’t excessive logging, memory leaks, or any other problems that only occur when you try an invalid operation at scale.
Identifying positive feedback loops
Positive feedback loops can cause chaotic behavior and catastrophic reductions in performance, where adding load increases failures, which adds even more load:
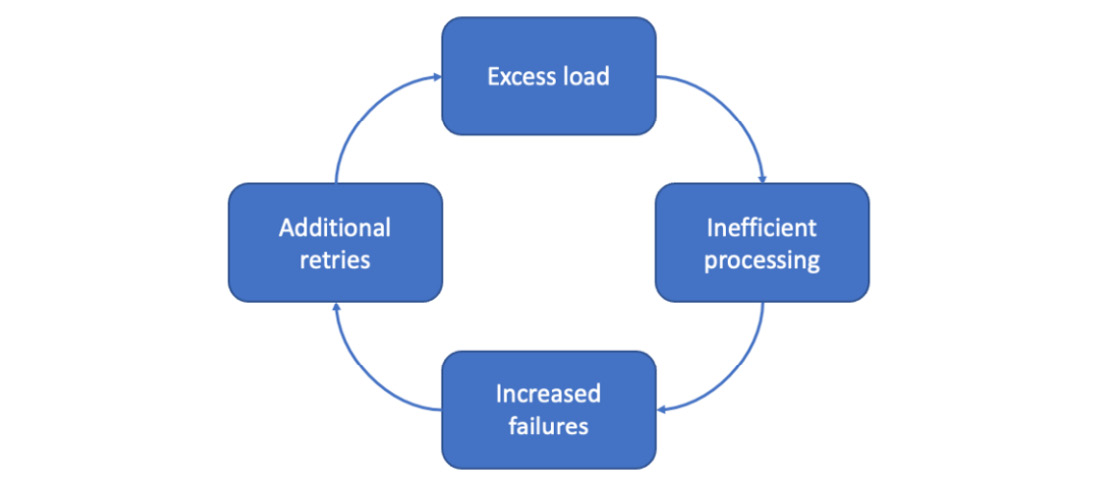
Figure 13.4 – A positive feedback loop of loading failures producing even more load
Inefficient processing can be due to failures requiring more system resources, for instance, due to writing large error logs or remote calls to indicate a problem. Additional retries can be caused by faults in the client logic, such that some failures lead to even more requests and even more failures.
Recall the example of self-inflicted DDoS from Chapter 7, Testing of Error Cases. There, positive feedback resulted in more load and even more failures. We saw an example when we read conference details from Outlook for all our users: the system was overwhelmed, and writing the logs for all the failures only slowed it down further.
Often these failures are emergent behavior, complex interactions that aren’t predictable from any single part of the system in isolation. This is the strength of system testing – it’s the only way to identify these interactions.
The solution for this class of issues is back-offs and prioritization to ensure critical work is done to resolve the situation. Logs don’t matter if your service is down; if you have to choose between logging or a live service, keep your application serving your users until the situation improves. As we saw in Chapter 10, Maintainability, maintaining service in overloaded conditions requires concise logs, even during error handling, and carefully set priorities so other processes have access to resources.
When systems are down, retries should gradually take longer. Exponential back-offs work well, sending messages at 1, 2, 4, 8 seconds, and so on, as the chance of a rapid recovery dwindles the longer the problem lasts. This prevents your clients from causing your servers issues, especially if they are shut down while heavily loaded, and many clients try to connect simultaneously on their return.
Whenever you find a case like that, it’s a bug that urgently needs fixing as it is likely to cause outages. In that case, the developer hasn’t considered what will happen when there’s a failure. At the other end of the spectrum are problems you deliberately plan for: handling the overload with graceful degradation, as described next.
Graceful degradation
Mainly, stress testing involves taking already present functions and using them excessively, but there is one aspect with dedicated code: graceful degradation. For functions that you expect to be overloaded but you still want to provide some service, your system can detect that state and adjust.
Possibly that doesn’t apply to your system, in which case you can skip this section. However, keep it in mind for specification reviews: if you don’t deliberately handle the case of overload, what do you want to do? Sometimes you can police a limit and prevent additional load by rejecting excess requests. In other situations, you have more subtle options.
Real-world example – Counting the frames
In a video conferencing company I worked for, we implemented graceful degradation in case the load on our system got too high. Our first line of defense was the best: if we couldn’t handle the video processing load, we would leave everyone connected at the same video resolution but reduce the frame rate.
It’s very hard to see the difference between 30 frames per second, which we usually sent, and 20 frames per second, but making that reduction reduced our video encoding load by a third. It was a neat way to protect our system with minimal user impact. The challenge was testing it: we had to rely on the statistics for the video stream because the difference was imperceptible.
The primary method of graceful degradation is to slow requests down. Whether internal processing or responding to external queries, taking more time allows your system to handle a spike in load. Where you have queues or buffers in place, you’ll need to check that they work up to their configured limits without losing messages. When you go beyond their configured limits, are rejections sent correctly?
Behavior under load can be tough to test, so you will need excellent instrumentation to log the rate of messages arriving, being rejected, queued, and processed. It should be possible to tally totals and plot graphs so you can see what is happening because if there is an issue, it can be challenging to spot and debug issues when the system is so busy. You’ll need to both generate the load and closely measure system behavior before you can successfully run these tests.
An alternative form of stress testing is to use the same load but reduce your system’s capabilities. How well does your system cope with constrained resources?
Limited resources
As we saw in the Identifying positive feedback loops section, resource constraints often form an essential step in exacerbating overload conditions. Some coding inefficiencies can be flushed out by realistically loading common operations, such as memory leaks or excessive disk usage. Others are more subtle and are best revealed by restricting resources.
Real-world example – 32 times 2 or 8 times 8?
One video conferencing company I worked for used standard servers that they owned and ran. I looked after procuring new blades, each of which ran with 64 GB of memory. We usually installed 8 lots of 8 GB memory sticks, but for one order, I bought two lots of 32 GB instead. That meant there were fewer components to go wrong, gave us more room for expansion in the future, and saved us some money.
The new blades came online and ran for several weeks before we got reports of higher packet loss rates. These were initially dismissed as poor networks (recall the challenges of filtering alerts from Chapter 10, Maintainability); however, it soon became apparent that we were the source of the loss. Buying a quarter of the number of memory sticks had advantages, but it also meant we had a quarter of the memory bandwidth, which relied on communication with eight different slots. The effects were subtle but, under load, our processing couldn’t handle the restriction and dropped video packets.
To perform this form of testing, you need to limit one of the core processing limits in your system, such as one of the following:
- CPU
- Memory
- Memory I/O rate
- Disk space
- Disk I/O rate
The aim is to find how close to these limits your system currently runs. If you only have to reduce these metrics by a few percent before you start seeing failures, you are running dangerously close to your threshold. Conversely, this test might indicate that you are paying for more resources than your application needs to meet its performance requirements. It’s important to run comprehensive checks while in this state. For more information, see the What to check when stress testing section.
Real-world example – Sharing with the monitoring system
On the same system that ran standard servers, we used virtual machines to run various applications on the same hardware. One day we saw slowdowns and crashes on two of our core servers. There was nothing special about them until we realized they ran on the same physical blade; servers on other blades weren’t affected.
Those servers also shared a physical blade with our monitoring system. It turned out that the disk I/O for monitoring had reached sufficient rates and there was not enough left to run our core servers. We needed to separate that machine and buy more performant disks to ensure our core servers could maintain their function.
Another way to limit resources is by restricting the machines used within the system. If you usually work with four edge servers, can you handle the required capacity with only two? Again, this will only be needed rarely but can happen in the event of an outage. As mentioned in Chapter 11, Destructive Testing, you need to check that your system can successfully failover onto backups and still process the required load. Wherever you have redundant machines within your system, stress test the failover scenario.
Restricted system resources might seem like a problem low on the priority list, but the condition can arise from surprising causes. We’ve seen examples of incorrect hardware, positive feedback loops in the software, failovers, or sharing resources with problematic applications. It’s essential to know how close you are to those limits and what problems you might suffer when you breach them.
In the next section, we turn to stress testing over long periods, known as soak testing.
Soak testing
What if someone decides to play your game for 24 hours straight, host a meeting that long, or leave an operation running for weeks at a time? The next type of stress you can apply to your system is to perform valid and invalid actions over extended periods beyond their design limitations. Some of these limits will be policed with checks to ensure nothing takes longer than a specified time, while others will be open-ended. Some actions will change your system’s state, and others are individual operations you can apply repeatedly. That gives a matrix of possible cases, with examples here:
|
Policed operation |
Unpoliced operation | ||
|
Valid operations |
Ongoing state |
Game length Call length Processing time |
Web session length |
|
Separate operations |
Transactions per day Operations available on a free plan |
Signing up Logging in | |
|
Invalid operations |
Ongoing state |
Detecting heartbeat timeouts Killing long-running transactions/processes |
System degradation |
|
Separate operations |
Incorrect password attempts |
Signing up too many users Creating too many entities Accessing invalid URLs |
Table 13.2 – Different classes of soak testing tests
Some valid, ongoing states have time limits applied to them. You should have checked these as part of functional testing to ensure that users are kicked out of calls or games when they reach the maximum time. At a lower level, tasks and processes should have a time-to-live value to shut down infinite loops or stuck operations. Do these protections work correctly?
Some valid states don’t have time limits, for instance, a web session with constant activity. If that’s the case, you’ll need to pick a value to test up to, so you can sign off on its performance. That can be a large value, say a week, so any session shorter than that should also work.
When stress testing individual and repeating operations, you should check for policed limits. Maybe only so many transactions are allowed per day, or users on a free plan might be limited in how many entities they can create. Stress test these rejections – do large numbers of them cause any issues? Extend the stress testing we’ve already described, for instance, logging in or signing up over hours or days, to ensure your system doesn’t have any subtle problems such as memory leaks when processing them.
Examples of invalid ongoing states are those we considered in Chapter 11, Destructive Testing. You can test your system’s response by disabling or degrading part of it. Some of these connections will have heartbeats, so check that their absence is detected and acted on correctly. Killing long-running or struck transactions is another example. Other degraded states won’t, and can’t, be policed. In terms of soak testing, how does your system respond to subsystems being offline for an extended period? A dual redundant system might failover and work correctly, but does it still work an hour or a week later?
Invalid individual operations can be policed, such as logging in with incorrect passwords. After too many failures, this should be locked and fail even if the user does attempt the right combination.
Real-world example – Invalid password attempts
In one company, we assigned the task of updating our root server passwords to a junior member of the team. A little while later, he returned, distressed that he was now locked out. Privately cursing his incompetence, I smiled and went to help. Sure enough, neither the old nor the new password worked. He must have changed it to something else, and we were now locked out. Then we tried one more time, and it worked – the new password was correct. We logged out and tried to log back in, and it failed again. How could a password work intermittently?
We had forgotten about a monitoring system that ran in the background, checking login. It attempted regular logins with the old password and repeatedly locked us out. After the timeout, we had a brief window where the server accepted our password before the incorrect logins blocked us again.
Finally, many invalid, separate operations aren’t policed, such as signing in too many users, creating too many entities, or attempting to access invalid URLs. You can check that these are rejected, then stress that operation over long periods to check for excessive logging, resource leakages, or other subtle problems.
Next, we consider the opposite case – brief spikes of high load.
Spikes in load
A more typical case than constant load is a short peak of high load. That might be due to people simultaneously dialing into their 9 o’clock meetings, a new update that users are eager to see, or a promotion starting. Your marketing team’s job is to generate this traffic, and it’s often very bursty. Can your system cope?
Testing queues
As mentioned in the Graceful degradation section, this is a test of your system’s buffers and queues. Are they the right size, and do they fill up and empty correctly? You’ll need to identify all the queues designed to spread the load in your system to check their behavior and the locations which should have a queue but don’t.
Queues are particularly important for varied workloads where long, resource-intensive jobs compete with fast, little tasks. You have to ensure small tasks can still be processed quickly, even if large jobs are taking up resources. For instance, if you have multiple clients making requests to a central server, it may be able to handle light loads, as shown on the left in Figure 13.5, but not keep up if all clients want to use your service simultaneously. That’s illustrated on the right, where the server drops some requests:

Figure 13.5 – A server fails under a heavy load
Implementing a queue provides protection against this issue:
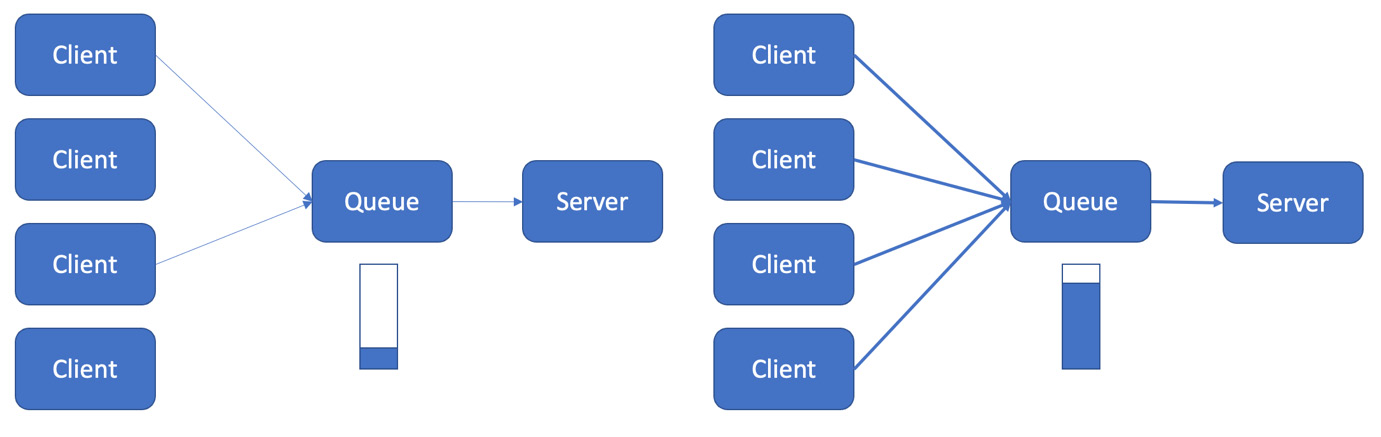
Figure 13.6 – A queue handles a spike in load
During periods of light loading, the queue is empty and just forwards requests, as shown on the left of Figure 13.6. During high loading, on the right, the queue successfully accepts all the Client traffic but limits the tasks sent to the server. It stores the excess, and the Queue function fills up. When the traffic becomes lighter, the queue sends stored requests to the server, keeping it busy even though the clients are now quiet:

Figure 13.7 – A queue empties after a spike in load
With little traffic arriving, the queue empties its contents, sending them on to the server at a steady low rate, ready for the next burst. For example, if a server has a limit of 2,000 rps, without a queue, a 2-second peak of 5,000 rps will result in failures:

Figure 13.8 – Peaks of traffic overwhelm the server
A queue would smooth that traffic. It would still send a total of 10,000 requests to the server, but instead of 2 seconds of 5,000 rps, it would send 5 seconds of 2,000 rps, staying within the server’s capabilities:

Figure 13.9 – A queue spreads out the load
The queue would smooth this traffic to keep it under 2,000 rps for an extended period.
Queues are a vital part of large systems, but they have limits and add complexity that (you guessed it!) needs testing. What is the maximum rate the queue can accept? What is the maximum backlog it can store? Your specification should state the number of transactions per second that the system should support, how that is averaged over time, and what peaks should be possible. If you have a peak of five times your average in 1 second, then no traffic for 4 seconds, on average, your system should handle that if it can buffer the peak and process it gradually. Check precisely what your system can support, or let the team know the reality if no one is sure.
When one queue is insufficient, several may be necessary to handle the spikes in load. Again, that is possible at the cost of increasing the complexity further. Queues also add a delay to the processing of tasks. Usually, this is brief, but that can’t be guaranteed. You’ll need to test that any requests traversing the queue are resilient to those delays. If the queue doesn’t guarantee requests are delivered in order, First-In-First-Out (FIFO), then you will need to consider out-of-order execution. If requests interact and depend on one another, that may cause major problems.
What is the client’s behavior when the queue’s limits are breached? What visibility do you have of the queue’s performance? Does the queue forward requests at the right level to the server? If the queue sends too many tasks, the server will still be overloaded; if it sends too few, it reduces the system’s capacity. If your system includes queues, all those questions should be steps in your test plan. If the queue receives invalid requests, it must report those back to the client and flag an error instead of the main server doing it.
Where you have a distributed system with multiple servers ready to handle traffic, you’ll need a system to direct the traffic to those locations. Load balancers also need to be tested – they’ll have an algorithm to select destinations, from something as simple as a round-robin to complex load-based choices. Stress testing is your chance to check its routing during regular operation and when the system is overloaded.
The final test we consider in this chapter is also the toughest: stress testing the system while deliberately adding errors.
Stress testing with errors
Despite the harshness of tests that push your system beyond its limits, lab testing still misses conditions that will be present in real-life usage. The day your advert goes viral and loading jumps, you will still have all the packet loss, latency, and even the chance of internal failures of a typical day. For a complete test, remember to include these low-level issues in your testing.
As with load testing, to apply controlled errors, you must start with an error-free system (see the Technical requirements section in Chapter 12, Load Testing). To perform any of the tests in this chapter, you need a reliable setup with all the resources and equipment of the live system on controlled networks without packet loss or other issues. From that start point, you can apply loading and degradation combinations. Recall the sources of network degradation from Chapter 7, Testing of Error Cases:
- Packet loss
- Latency
- Jitter
- Re-ordering
- Duplication
Then add a realistic background level of everyday tasks:
- Sign up
- Sign in
- Data access
- Configuration changes
- Application updates
- Requests for invalid URLs
Include anything else that happens on a typical day. On top of that, apply your stress scripts to probe the behavior you want to test.
Real-world example – Too hot to handle
In one company, we supplied a custom-designed hardware appliance and started experiencing rare crashes on some customer sites. We’d never hit this problem internally, and on an investigation, the crashes were impossible – the code couldn’t fail in the way the logs showed.
It’s always tempting to blame a crash on cosmic rays flipping a bit, but in this case, that really looked like a possibility until we noticed the environments that these units ran in. They were all in hot countries, with crashes during the summer months. They were running inside the temperature range we stated, but after retesting our chips at high temperatures over an extended period, we hit the same issue. For once, it wasn’t a software issue at all.
Once all that testing is running, monitor its output, as described next.
What to check when stress testing
As with load testing, you need to constantly check your system during stress tests. First, carefully review your monitoring as described in Chapter 10, Maintainability. Track any errors or alarms generated during your tests and errors in the logs. That should be a given during any testing but is especially true here.
Stress testing is an external pressure you put on your service – an expected problem. As such, even stress testing shouldn’t show any errors. In my experience, that won’t be the case, so one of your first tasks will be to raise those alerts with the development team to either fix or downgrade to a warning.
Recall the list of system metrics from Chapter 12, Load Testing. All those measures are also important when running stress tests:
- CPU:
- High sustained levels
- Spikes of usage
- Disk:
- High usage
- High rates of increase
- Memory:
- High usage
- High rates of increase
- System resources:
- Handles
- Addresses
- Database connections
- Rate of errors
- Packet loss
- Latency on operations
The same metrics of load performance also apply:
- How many operations were performed
- Inbound and outbound data rates
- How many successes and failures there were
- The minimum, maximum, average, and standard deviation of operation times
- Summaries of failures and excessive latency
- Any errors and warnings that were generated
What you should see during stress tests are many warnings about failed operations. Count those as carefully as possible – do they match the number of failed operations in your stress tests? Does the number of successful operations, plus the number of failure warnings, equal the total number of actions you attempted? Check for any discrepancies.
A particularly pernicious bug is dropped log messages. This can easily happen in a distributed system when one source of logs produces them faster than their destination can process. It’s so damaging because the failure is often silent. By definition, it’s the logs and alarms that warn you about problems, and those are missing, so you have no warning. Missing logs can delay and disrupt the diagnosis of many other issues, leaving you with unsolvable puzzles and impossible events. If one log line should always follow another but in this case it’s absent, you can waste time investigating why that code didn’t run correctly before realizing the code was fine, and the log line was missing.
Stress testing is an excellent way to verify your logging system under the highest load it needs to sustain and to check that you see the correct logs, warnings, and errors.
Then you need to check the results of each load operation. As described in Chapter 5, Black-Box Functional Testing – don’t just read API return codes, but perform a second check, ideally from another interface, to ensure each operation has its intended effect.
As with load testing, the trick is to aggregate the results and see your percentage of failures. That’s the measure to test against the requirements. Stress testing is more complex than load testing because you will expect some rate of errors, so you will need to add both and compare the totals.
To diagnose errors, you’ll also need to use the same techniques as when load testing, as described in the Identifying bottlenecks section. This time you’ll have to filter out the expected errors to isolate the genuine problems, but you should use the approach of starting with the logs and examining the system resources for machines under load.
There will likely be many transient issues, and you must prioritize which you investigate. Problems in stress testing often aren’t clear-cut, so you’ll have to choose where to spend your time. Be disciplined and try not to get side-tracked by checking unimportant problems. Only check those that happen most often, or have the worst effects. The others can wait until they become a bigger issue.
Summary
Stress testing puts all your skills as a tester to use: you need to identify all your system’s functions: black-box and white-box testing and all the error cases that can occur, as well as using all the visibility you put in place from monitoring and logging, the degradations from destructive testing, and all the tools from load testing.
With all those tools in place, you can perform tests specific to stress testing. We saw how tests could breach transaction rates with policed and unpoliced limits. We considered the performance of the code, either deliberately handling excessive operations with graceful degradation or suffering from stress-related failures, such as positive feedback loops.
Loading on your system can take different forms – with soak testing over long periods or spikes of load, which can be mitigated with queues. Excess loading can also be caused by limiting system resources, which introduces its own class of issues, as does introducing realistic errors, such as network delays, into your testing.
Finally, we looked at what to check during load testing, ensuring you saw warnings for failures but no errors, and that the logging worked correctly.
If you can marshal all of your skills, stress testing probes your system to its limits, letting you thoroughly understand its behavior during any realistic scenarios it will face while running live. If it passes these tests, you have genuinely put your system through its paces and gained the highest confidence in its performance. Congratulations!