
2 Hearing and the nature of sound
Part 1
The mechanism by which sound waves are converted into a perception by the brain is extremely complicated and parts of it are still not fully understood. This book is not the place for even a limited account of the subject. It is, however, a fascinating topic and the reader who wishes to find out more should refer to the list of books for further reading at the end. There are, nevertheless, various aspects of the hearing process which are important in the context of audio technology and these will be outlined here.
The response of the ear
To begin with, we are dealing with a frequency range from about 16 Hz to around 16 kHz. These figures are not precise. At the low end it is not easy to say when sound ceases to have an identifiable pitch and starts to become a sort of flutter. Values of 16–20 Hz are quoted by different authorities. The upper end depends on the individual and also upon the person's age. Twenty kilohertz may be detected by a person in their late teens; some 60-year-olds may have difficulty in hearing anything above 8 or 10 kHz. The effects of exposure to loud noises can also have a very significant effect. Sixteen kilohertz is, though, a fairly good figure to quote as the upper limit of hearing for the average adult.
It is assumed, or at least hoped, that devices such as microphones, tape machines and loudspeakers have what is known as a flat frequency response. That is, they respond equally well to all sounds regardless of the frequency. The human ear is not like this. Figure 2.1 shows a graph of one aspect of the normal ear's response to the full range of sound wave frequencies.
The solid curve in Figure 2.1 is called The Threshold of Hearing. It shows the minimum sound pressure needed just to create a sensation in the ear. Incidentally, it is a curiosity of the ear that at higher levels the response curve is much flatter.
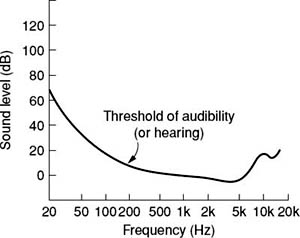
Figure 2.1 The response of the ear to low-level sounds
The horizontal axis represents frequency. The vertical axis is in dB relative to a sound pressure of 0.00002 Pa, which we referred to in Chapter 1. (0.00002 Pa is sometimes written as 20 μPa. A pencil and the back of an envelope can confirm that the two are the same!) This figure represents the sound pressure which can just be detected when the ear is at its most sensitive, which for the normal ear is a frequency of about 3 kHz. An important point to notice about the threshold of the hearing curve is that a very much higher sound pressure is needed to produce a sensation in the ear at low frequencies than at around 3 kHz. In other words, at low sound levels the ear is very insensitive to low frequencies. It is also insensitive to very high frequencies but this is usually less obvious in practice.
The ear's insensitivity to low frequencies can easily be demonstrated by listening to a piece of music with a wide frequency range and turning the volume down to a low setting. It will be found that the music becomes ‘toppy’. The high frequency loss which occurs at the same time is less apparent because with most music there is relatively less energy in the high frequencies than in the low ones.
Many domestic audio systems have a ‘loudness’ control which, when switched in, boosts the low frequencies as the volume is turned down. (Personally I have some doubts as to how useful this really is!)
Loudness. The dB(A)
Loudness is a subjective effect: in other words the loudness of a sound depends upon the individual experiencing it. It cannot therefore be measured. It is possible, however, to make measurements which agree reasonably closely with most people's assessments of loudness.
We implied in Chapter 1 that the decibel might be the basis of a unit of measurement, but a straightforward measurement of sound pressure in decibels is obviously not good enough as it would take no account of the uneven frequency response of the normal ear. If, though, the measurement device incorporates an electrical correction circuit which gives it a frequency response similar to that of the ear, then reasonable approximations to loudness can be made.
Such a circuit was devised many years ago and is incorporated in devices called Sound Level Meters. These have a microphone, amplifier, meter and the appropriate circuitry to match approximately the ear's characteristics. Such measurements are quoted with the unit dB(A), meaning decibels with the ‘A’ circuit incorporated. They are often termed weighted measurements. (B and C characteristics have also been devised, but it has been found that the A circuit most nearly matches subjective assessments of loudness.) Table 2.1 lists a few typical sounds with their ‘loudnesses’ in dB(A).
It may be worth noting that current noise regulations in the UK require ear defenders to be made available in an industrial workplace where the noise levels reach 85 dB(A). Above 90 dB(A) their use is mandatory and also noise levels from machinery should be reduced if at all possible.
DEFINITION
The dB(A) is a reasonably good approximation to most people's assessment of loudness.
Musical pitch
By this we mean the position of a note in the musical scale. Pitch can be a very complicated subject – like so much else in sound! It must be enough here to give the outlines of a few basic facts:
1. Pitch is basically related to frequency, but the perceived pitch of a note can be affected by the loudness.
2. The standard of pitch is taken to be a sound having a frequency of 440 Hz. This is known as ‘International A’. It is the note blown, usually by an oboe, as a tuning signal before an orchestral performance. (Oboes have a stable note and also a very penetrating sound which can be heard reasonably clearly by the other members of the orchestra.)
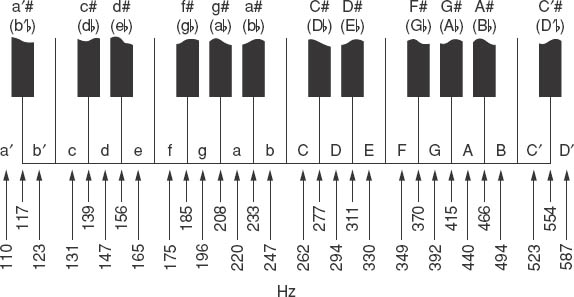
3. Despite what has been said in 1 above it is possible to make up a table relating pitch and frequency. The note designated C is the one called ‘Middle C’ on a keyboard instrument. Table 2.2 lists the frequencies for different pitch notes.
Table 2.1 Some typical ‘loudnesses’ in dB(A)
Source |
dB(A) |
Orchestra, fortissimo at 5 m |
100* |
Busy street, workshop |
95 |
Orchestra, average at 5 m |
80 |
Domestic TV, at 3 m |
70 |
Speech at 1 m |
60–65 |
Inside quiet car |
50 |
Inside quiet house |
30 |
Inside quiet country church |
25 |
*An orchestra may reach momentary peaks of 120 dB.
4. A musical octave represents a doubling or halving of the frequency. Thus, in Table 2.2, a is an octave below A and its frequency is half of 440 Hz. The octave above middle C has a frequency of approximately 523 Hz.
5. Adjacent semitones (e.g. from one note on a keyboard to the adjacent one above or below, which may mean going from a white note to a black one, or vice versa) have frequencies in the ratio of about 1.06:1. In other words, there is a 6% frequency difference. A note raised by a semitone is indicated by the ‘sharp’ sign #. A note lowered by a semitone is marked ‘![]() ’.
’.
The subject of pitch is a complicated one. Table 2.2 shows what is called an equal tempered scale, the standard scale for keyboards, and on it C# is the same as D![]() . However, to a good musical ear these should not really be the same note. Keyboards have compromise tuning!
. However, to a good musical ear these should not really be the same note. Keyboards have compromise tuning!
Musical quality (‘timbre’)
By timbre (pronounced ‘tarmbre’), we mean the factors which enable the ear to distinguish one instrument from another. A trumpet and a saxophone produce clearly different sounds even if they are playing the same pitch note.
There are two important factors in determining the timbre:
1. Harmonics. These are tones having frequencies which are exact multiples of the base frequency (called the fundamental). An instrument playing the note a = 220 Hz will be likely to be producing not only 220 Hz but also many multiples of that frequency, such as 440, 660, 880, 1100, 1320, and so on. Generally, the various harmonics diminish in amplitude as they go up in frequency. Musicians often refer to harmonics as overtones but then the first overtone is the second harmonic, and so on.
2. Starting transients. For a brief period at the start of a note – and this may be as little as a hundredth of a second, and rarely more than about one fifth of a second – there are additional frequencies present which are not numerically related to the fundamental as the harmonics are. These frequencies die away quickly, hence the name ‘transient’. They depend, possibly amongst other things, on the way and rate at which vibrations build up in an instrument. They are a kind of fingerprint.
DEFINITIONS
The fundamental frequency in a musical sound is the lowest frequency.
Harmonic frequencies are multiples of the fundamental frequency.
For some reason, the ear and brain attach great importance to the starting transients. If they are removed or distorted it is possible for the perceived quality of the instrumental sound to be radically changed, even though only a fraction of a second has been changed at the start of a note lasting several seconds. For example, it can be almost impossible to tell the difference between the sound of a flute and a trumpet, playing the same pitch steady note, if the first few seconds of the sounds are in some way suppressed.
Table 2.2 Frequencies of musical notes
Note |
Frequency to nearest Hz |
A |
440 |
G# |
415 |
G |
392 |
F# |
370 |
F |
349 |
D# |
330 |
D |
294 |
C# |
277 |
C |
262* |
b |
247 |
a# |
233 |
a |
220 |
*Also known as ‘Middle C’.
It is important to realize that the frequencies required to reproduce properly the sound of a musical instrument or the human voice extend, because of the harmonics, well beyond the apparent musical range. For example, the highest note on a piano has a fundamental frequency of a little over 4 kHz. However, the harmonics extend over most of the audio range. For example, taking a note only two octaves above middle C, and using approximate frequencies for simplicity:
Middle C = |
262 Hz |
one octave above = |
523 Hz |
two octaves above = |
1046 Hz |
The tenth harmonic of Middle C (which may or may not in practice be very significant, depending on the instrument) is 10 × 1046, which is 10 460 Hz. The top notes of a violin have fundamental frequencies around 3 kHz. The fifth harmonic of such notes is about 15 kHz.
A fuller list of musical instrument ranges is given in Part 2 of this chapter.
The brain's perception of sound
Optical illusions, in which the brain superimposes its own interpretation on what the eyes receive as light, are well known. People involved with sound need to be aware that there are aural equivalents.
1. To begin with it is important to realize that the brain's really accurate memory for sounds is very short – around 1–2 seconds. For example, if two good quality but slightly different loudspeakers are to be compared then this must be done by switching directly from one to the other – a process sometimes known as ‘making A–B comparisons’. It is impossible to make reliable judgements by listening to one and then the other with a day in between! Comparisons between one good and one mediocre loudspeaker can be made with a time gap, but here we are talking of accurate comparisons between similar quality devices. This is such an important topic that we shall return it to later.
2. It is very easy for the ear/brain system to hear what it thinks it ought to hear! Most professional sound operators know of instances when they have adjusted a control on a piece of equipment and been well satisfied with the result, only to discover later that the control had been switched out of circuit and was therefore doing nothing!
3. Curious effects can sometimes occur in stereo. As an instance, many people listening to stereo recordings of aircraft, in which the image of the aircraft sound goes from one loudspeaker to the other, find that the sound image appears to rise above the level of the loudspeakers and may indeed even seem to be overhead. The explanation is clearly that the brain associates aircraft noise with height and then imagines a height effect even when the real sound sources are at ear level.
4. The ear/brain system has an uncanny ability to discriminate against sounds it regards as unimportant. It can do this because, by having two ears, the brain can locate the direction of the wanted sounds. This effect is sometimes referred to as the cocktail party effect. (You can guess why!) Microphones, even when there are two as for stereo, cannot provide this discrimination, or at least to only a slight degree, so that what may seem to be acceptable acoustic conditions when an environment is listened to ‘live’ may prove to be quite unacceptable, for reasons of background noise or excessive reverberation, when a recording is played back.
5. The remaining item in this short list is known as the Haas Effect. Stated briefly, if similar sounds arrive at a listener's ears then the sounds that arrive first determine the apparent direction of the sound source, even though the later-arriving sound may be as much as 10 dB higher in level. The reader can verify this by feeding a pair of stereo loudspeakers with a mono source and then moving towards one of the loudspeakers so that the sound from it arrives first at the ears. This will cause the mono sound image to move to that loudspeaker. Adjustment of the balance control to raise the level in the other loudspeaker is unlikely to shift the image until there is a very appreciable loudness difference between them.