
9.2 Motivation and details
As mentioned above, the scheme for joint-coding of audio source signals, shown in Figure 9.2, is based on transmission of the sum of the audio source signals,
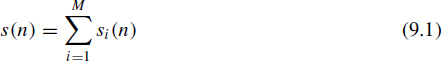
where M is the number of source signals and si(n) are the individual source signals.
Similar to spatial audio coding techniques, this method relies on the assumption that the perceived auditory spatial image is largely determined by the inter-channel time difference (ICTD), inter-channel level difference (ICLD), and inter-channel coherence (ICC) between the rendered audio channels. Therefore, as opposed to requiring ‘clean’ source signals si(n) as mixer input in Figure 9.1, only signals ŝi(n) are required that result in similar ICTD, ICLD, and ICC at the mixer output as for the case of supplying the real source signals si(n) to the mixer. There are three goals for the generation of ŝi(n):
- If ŝi(n) are supplied to a mixer, the mixer output channels will have approximately the same spatial cues (ICLD, ICTD, ICC) as if si(n) were supplied to the mixer.
- ŝi(n) are to be generated with as little as possible information about the original source signals si(n) (because the goal is to have low bitrate side information).
- ŝi(n) are generated from the transmitted sum signal s(n) such that a minimum amount of signal distortion is introduced.
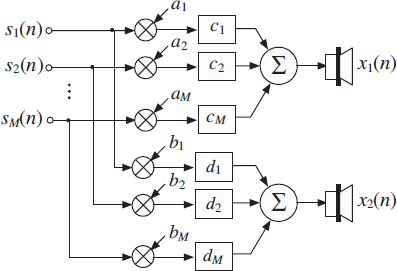
Figure 9.3 A mixer for generating stereo signals given a number of source signals.
Without loss of generality for deriving the scheme for an arbitrary number of rendered output channels, a stereo mixer is considered. A further simplification over the general case is that only amplitude and delay modifications are applied for mixing. (Equalization of objects is also provided by frequency-dependent amplitude changes.) If the discrete source signals were available at the decoder, a stereo signal would be mixed, as shown in Figure 9.3, i.e.
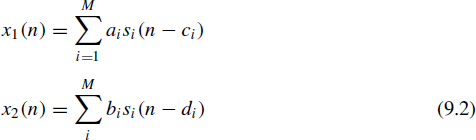
where ai and bi represent level mixing parameters, while ci, and di represent time delay mixing parameters.
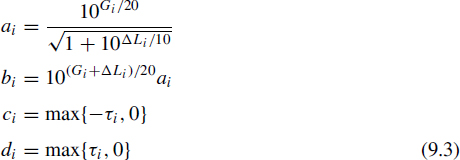
Given, for each source with index i, the gain Gi (in dB), pan pot position ΔLi (expressed as level difference in dB), and the delay pan pot position τi in samples, the mixing parameters (9.2) can be computed:
In the following, ICTD, ICLD, and ICC of the stereo mixer output x1(n), x2(n) are computed as a function of (statistical properties of) the input source signals si(n) and the mixing parameters ai, bi, ci, and di. The expressions obtained will give an indication of which source signal properties determine the mixer output ICTD, ICLD, and ICC (together with the mixing parameters).
9.2.1 ICTD, ICLD and ICC of the mixer output
The ICTD, ICLD and ICC parameters of the mixer output are estimated in sub-bands (critical bands) and as a function of time. It is assumed that the source signals si(n) are zero mean and mutually independent. A pair of sub-band signals of the mixer output (Equation 9.2) is denoted ![]() 1(n) and
1(n) and ![]() 2(n). Note that for simplicity of notation we are using the same time index n for time-domain and sub-band-domain signals. Also, no sub-band index is used and the analysis/processing described is applied to subbands at each frequency independently. The subband powers of the two mixer output signals are:
2(n). Note that for simplicity of notation we are using the same time index n for time-domain and sub-band-domain signals. Also, no sub-band index is used and the analysis/processing described is applied to subbands at each frequency independently. The subband powers of the two mixer output signals are:
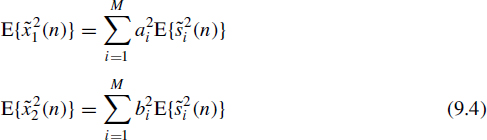
where ![]() i(n) is one sub-band signal of source si(n) and E{.} denotes short-time mean, e.g. i
i(n) is one sub-band signal of source si(n) and E{.} denotes short-time mean, e.g. i
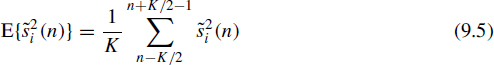
where K determines the length of the moving average. (The solutions provided are based on an assumption of incoherent source signals. For partially coherent signals, the reader is referred to Chapter 8, Section 8.3.3.) Note that the sub-band power values E {![]() 2i(n)} represent for each source signal the spectral envelope as a function of time. The time span considered for the averaging (9.5) determines the time resolution at which the interchannel cues are considered.
2i(n)} represent for each source signal the spectral envelope as a function of time. The time span considered for the averaging (9.5) determines the time resolution at which the interchannel cues are considered.
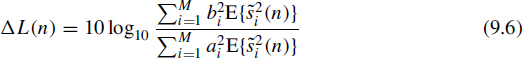
The ICLD, ΔL(n), between signals ![]() 1(n)
1(n) ![]() 2(n) is given by:
2(n) is given by:
For estimating ICTD and ICC the normalized cross-correlation function [181]
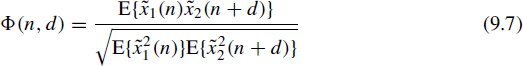
is computed. The ICC, c(n), is obtained according to
![]()
For the computation of the ICTD, τ(n), the location of the highest peak of the crosscorrelation function along the delay axis is computed,
![]()
The normalized cross-correlation function can be computed as a function of the mixing parameters. Together with Equation (9.2), Equation (9.7) can be written as
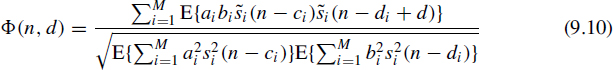
which is equivalent to
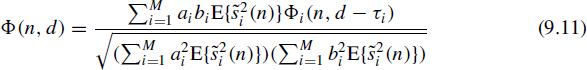
where the normalized autocorrelation function Φi(n, e) is

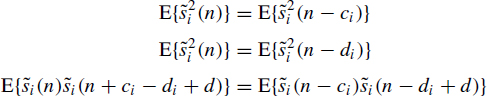
and τi = di − ci. Note that for computing Equation (9.11), given Equation (9.10), it has been assumed that the signals are wide sense stationary within the range of delays considered, i.e.
A numerical example for two source signals, illustrating the dependence between ICTD, ICLD, and ICC and the source sub-band power, is shown in Figure 9.4. The top, middle, and bottom panel of Figure 9.4 show ΔL(n),τ(n), and c(n), respectively, as a function of the ratio of the sub-band power of the two sources, a = E{![]() s21(n)}/(E{
s21(n)}/(E{![]() s22(n)}), + {
s22(n)}), + {![]() s22(n)}) for different mixing parameters (9.3) ΔL1, L2, τ1, and τ2 (with Gi = 1).
s22(n)}) for different mixing parameters (9.3) ΔL1, L2, τ1, and τ2 (with Gi = 1).
The top panel of Figure 9.4 indicates that when only one source has power in the sub-band (a = 0 or a = 1), then the mixer ICLD, ΔL(n) (9.6), is equal to the amplitude panning parameter ΔLi (Equation 9.3) of the dominant source. When the power in the sub-bands fades from one source to the other, i.e. when a changes from zero to one, the mixer output level difference fades from the amplitude panning parameter of one source to the amplitude panning parameter of the other source.
The middle panel of Figure 9.4 indicates that when only one source has power in the sub-band (a = 0 or a = 1), then the mixer ICTD, τ(n) (Equation 9.9), is equal to the delay panning parameter τi (Equation 9.3) of the dominant source. As opposed to the mixer output level difference, the mixer output time difference is determined by the delay panning parameter of the source which has more power in the sub-band, as indicated by the hard switch of τ(n) at a = 0.5.
The bottom panel of Figure 9.4 indicates that when only one source has power in the sub-band (a = 0 or a = 1), then the mixer output coherence, c(n) (9.8), is equal to one. Mixer output coherence decreases when more than one source has power in the sub-band.
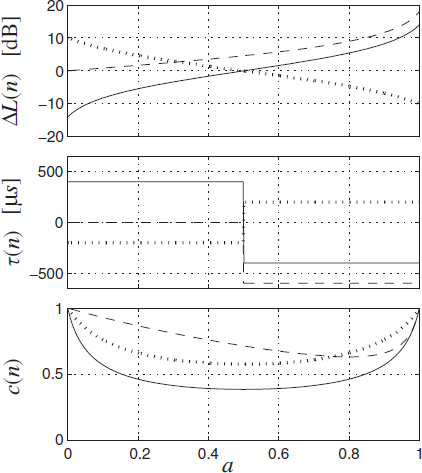
Figure 9.4 ΔL(n) (top), τ(n) (middle), and c(n) (bottom) for a critical band as a function of a = E{![]() 21(n)}/(E{
21(n)}/(E{![]() s21(n)}+ E{
s21(n)}+ E{![]() s21(n)}). The mixer parameters (Equation 9.3) are: ΔL1 = 14 dB, ΔL2 = −14 dB, τ1 = −400 μs, τ2 = 400 μs (solid); ΔL1 = 18 dB, ΔL2 = 0 dB, τ1 = −600 μs, τ2 = 0 μs (dashed); L1 = −10 dB, ΔL2 = 10 dB, τ1 = 200 μs, τ2 = −200 μs (dotted). The source gain has always been chosen to be Gi = 0 dB.
s21(n)}). The mixer parameters (Equation 9.3) are: ΔL1 = 14 dB, ΔL2 = −14 dB, τ1 = −400 μs, τ2 = 400 μs (solid); ΔL1 = 18 dB, ΔL2 = 0 dB, τ1 = −600 μs, τ2 = 0 μs (dashed); L1 = −10 dB, ΔL2 = 10 dB, τ1 = 200 μs, τ2 = −200 μs (dotted). The source gain has always been chosen to be Gi = 0 dB.