CHAPTER 10
Sustainability
OVERVIEW
How can I write about investing in 2022 and not discuss sustainability? This chapter discusses the measurement of sustainability for the fixed income asset class, with a primary focus on credit‐sensitive assets. Systematic investment approaches are naturally suited to the joint challenge of fulfilling the fiduciary obligation to deliver attractive risk‐adjusted returns and simultaneously deliver on sustainability objectives. Although the direct investor relevance of measures of sustainability is modest (i.e., measures of sustainability only exhibit weak correlations with measures of credit‐excess returns or risk), a systematic investment approach can deliver economically meaningful improvements in sustainability without sacrificing risk‐adjusted returns. The reader should note that this chapter is an introduction to sustainable fixed income investing. Sustainable investing can be a book, and course, unto itself.
10.1 INTEREST IN ESG/SUSTAINABILITY
Interest from investors, asset owners, regulators, and the public generally on responsible/sustainable investing has increased enormously over the last decade. Because there is no clear, generally accepted definition of what qualifies as “responsible” or “sustainable” investing, it can be hard to quantify precisely what fraction of assets are managed in a responsible or sustainable manner. One could argue that an asset manager is responsible simply by attempting to generate the highest risk‐adjusted returns possible for their asset owners, responsible in the sense of fulfilling their fiduciary duty to the asset owner. But that is not what people generally mean when they talk about “sustainable” or “responsible” investing. As we work through this chapter, measures of sustainability that are potentially relevant from an investor perspective will be covered. Note to reader: for the rest of this chapter I will use the term sustainable to span responsible investing and ESG (environmental/social/governance) investing approaches. Before we get into precise measures let's discuss the breadth of interest in this space.
One data point consistent with the drastic increase in sustainable investing is the rising prominence of the United Nations Principles for Responsible Investing (PRI). The PRI was launched in 2006 and was designed to be a proponent for sustainable investing. The PRI has a set of principles that signatories (investors) commit to follow in their investment processes. These commitments (paraphrased) include: (i) incorporating sustainability issues directly into the investment process, (ii) incorporating sustainability issues into ownership policies and decisions, (iii) seeking improved disclosure on sustainability issues from investee entities, and (iv) promoting sustainable investing practices generally. From 2006 to 2020 the signatory base has grown significantly, and as of 2020 around $100 trillion USD of assets are committed to PRI. Sustainable investing is here to stay.
Originally, the focus on sustainable investing was public equity markets, but there are now thousands of sustainable indices tracking public equity and public fixed income markets. The Global Sustainable Investment Alliance (http://www.gsi-alliance.org/) collects data on assets under management that follow sustainable investing practices (covering everything from simple exclusions to fully integrated sustainable investment processes), and as of 2020 they note that $35.3 trillion USD was invested in a sustainable manner representing 35.9 percent of the total assets managed. The interest in sustainability has even led to the development of index futures contracts (across developed equity markets) that are linked to ESG equity indices, and these now have open interest of more than $10 billion USD (as of September, 2021). Although these numbers are very small relative to trading volumes and open interest for regular equity (or fixed income) index futures, the direction of travel from asset owners is increasing demand for broad market exposures that are sustainable.
Let's explore how sustainability is influencing active investment management for fixed income. Given the historical emphasis of sustainable investing on public equity markets, the most natural extension in fixed income is the senior claims in the corporate capital structure (our credit‐sensitive assets). Although we will spend most of this chapter discussing sustainable investing for corporates, it is useful to remember the growing interest in sustainable investing at the macro level. This is still very much a nascent area with no agreed upon solutions at present. But we will cover, at least conceptually, the choices that would need to be made and thought through to have a successful sustainable investment process at the country level (e.g., sustainable developed or emerging market country selection).
10.2 SUSTAINABLE INVESTING WITH CREDIT‐SENSITIVE ASSETS
This section draws heavily on analysis in Diep, Pomorski, and Richardson (DPR; 2021). DPR conduct two primary sets of empirical analyses. First, they assess the direct investment relevance of sustainability measures for corporate bonds. Second, they examine how sustainability measures can be incorporated in an investment process to help achieve the joint objective of maximizing risk‐adjusted returns and a sustainability target.
DPR use data across four distinct categories of corporate bonds: (i) US IG includes all CAD and USD denominated bonds issued by corporate issuers domiciled in developed markets within the ICE/BAML G0BC index, (ii) US HY bonds (ICE/BAML H0A0 index), (iii) European (EU) IG includes all GBP and EUR denominated bonds issued by corporate issuers domiciled in developed markets within the ICE/BAML G0BC index, and (iv) EU HY bonds (ICE/BAML HP00 index). All the bonds they examine are issued by corporations domiciled in developed markets.
For sustainability measures, they use MSCI ESG data, who measure each issuer's ESG score relative to industry peers, from 0 (worst) to 10 (best in class). MSCI ESG data is designed to give users a holistic assessment of companies' ESG risks, leveraging a range of company disclosures (e.g., corporate filings, corporate social responsibility [CSR] reports, etc.) and information from sources not controlled by the company (e.g., news media, government data, etc.). The scores reflect ESG risk exposures based on issuers' business and geographic segments, and reflect if, and how, the issuer manages such underlying ESG risks. There are many third‐party data providers of sustainability measures including Sustainalytics, Refinitiv, Reprisk, Truvalue Labs, Vigeo‐Eiris, Standard & Poor's, ISS, and MSCI (see e.g., Berg, Koelbel, Pavlova, and Rigobon 2021 for a discussion of consistency in sustainability measurement across these providers). For measures of an issuer's greenhouse gas emissions, expressed in terms of carbon dioxide (CO2) equivalents, DPR use data from Trucost, focusing on Scope 1 plus Scope 2 emissions. Scope 3 data, while very important in principle, is not currently measured precisely enough for many asset owners to rely upon (see e.g., Callan 2020). The time period examined by DPR is limited to 2012–2020 due to the limited cross‐sectional coverage of sustainability measures further back in time.
One important consideration for sustainable investing in corporate bonds is the issue of missing data. Data vendors like MSCI have traditionally serviced equity investors, and naturally their data coverage is better for corporate issuers who also have publicly traded equity. For example, DPR notes that the typical coverage of MSCI ESG data for their US (EU) IG corporate bond universe is about 85 (75) percent on average. This coverage is less than 100 percent for two reasons: (i) MSCI does not compute ESG scores for all public issuers (coverage is excellent for constituents of large cap indices like SP500 or R1000), and (ii) private issuers tend to be less well covered (especially historically). The coverage is lower in the EU, where there is a higher concentration of private issuers. Explicit decisions need to be made for issuers with missing data. For the academic analysis linking measures of sustainability to credit spreads and credit excess returns discussed in the next section, DPR limits the sample to corporate issuers (and their bonds) with nonmissing MSCI ESG data. In practice, active fixed income investors cannot simply ignore issuers with missing data, so an explicit decision needs to be made for these cases of missing data. Treatment of missing sustainability data for portfolio construction is a little more involved and we will discuss that later in this chapter.
10.2.1 Direct Investment Relevance
Let's first explore the ways in which representative measures of sustainability may be useful from an investment perspective. There are two broad ways by which sustainability measures might improve investment performance: (i) improved modeling of expected returns, and (ii) improved modeling of risk. We can assess this investment relevance from an ex ante (i.e., how useful are sustainability measures in explaining cross‐sectional variation in credit spreads, which can be viewed as a measure of expected returns but also risk) and an ex post perspective (i.e., how useful are sustainability measures in explaining cross‐sectional variation in future credit excess returns and/or the volatility of future credit excess returns). Let's look at the evidence.
DPR start their analysis by exploring whether measures of sustainability help explain cross‐sectional variation in (option‐adjusted) credit spreads across their four corporate bond universes. They estimate regression equation (10.1) using their full panel of data (the ![]() subscript reflects each bond, and the
subscript reflects each bond, and the ![]() subscript reflects each month).
subscript reflects each month).
![]() is the MSCI industry adjusted sustainability score, and
is the MSCI industry adjusted sustainability score, and ![]() is a default probability forecast based on a combination of linear, structural, and machine learning models discussed in Chapter 6 (see e.g., Correia, Richardson, and Tuna 2012 and Correia, Kang, and Richardson 2018 for full details). Exhibit 10.1 is a visualization of the regression results allowing an assessment of both the statistical significance (color of bars) and economic significance (height of bars). There are eight bars corresponding to two sets of four regressions. For each of the four corporate bond universes (US IG, US HY, EU IG, and EU HY), Equation (10.1) is estimated with and without
is a default probability forecast based on a combination of linear, structural, and machine learning models discussed in Chapter 6 (see e.g., Correia, Richardson, and Tuna 2012 and Correia, Kang, and Richardson 2018 for full details). Exhibit 10.1 is a visualization of the regression results allowing an assessment of both the statistical significance (color of bars) and economic significance (height of bars). There are eight bars corresponding to two sets of four regressions. For each of the four corporate bond universes (US IG, US HY, EU IG, and EU HY), Equation (10.1) is estimated with and without ![]() . The specifications without
. The specifications without ![]() give the greatest chance for measures of sustainability to explain credit spreads, but they are naïve specifications, because any active fixed income investor will already have their own internal measure of credit risk (e.g., ratings, default forecasts, etc.). It is more natural to see how measures of sustainability provide incremental explanatory power for credit spreads.
give the greatest chance for measures of sustainability to explain credit spreads, but they are naïve specifications, because any active fixed income investor will already have their own internal measure of credit risk (e.g., ratings, default forecasts, etc.). It is more natural to see how measures of sustainability provide incremental explanatory power for credit spreads.
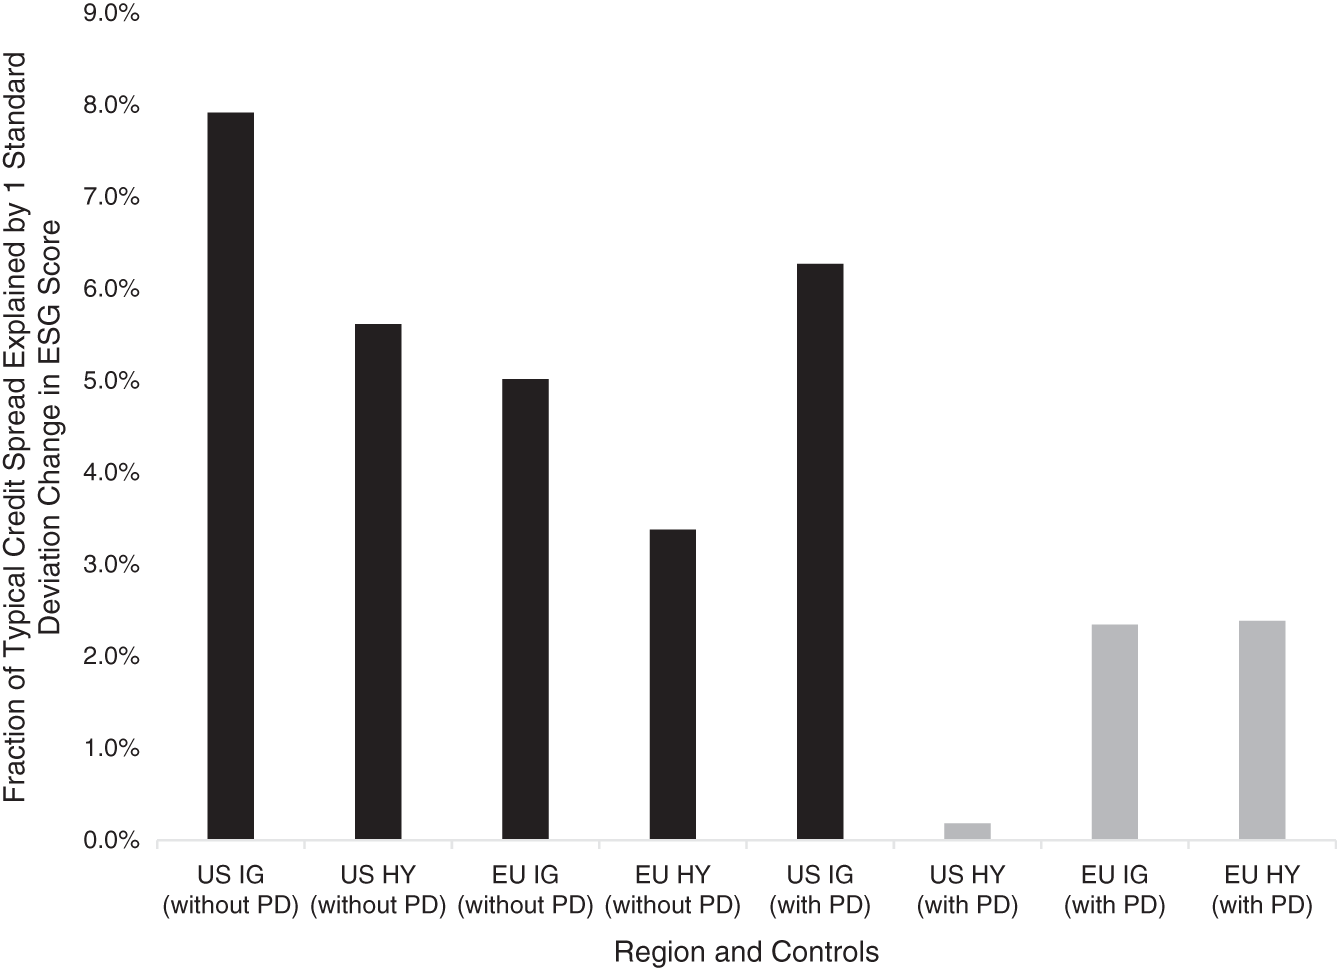
EXHIBIT 10.1 Histogram showing the fraction of variation in credit spreads explained by a one standard deviation change in measures of sustainability. Dark (gray) bars indicate statistical significance (insignificance) at conventional thresholds. The four corporate bond universes are US IG, US HY, EU IG, and EU HY.
Source: Diep, Pomorski, and Richardson (2021).
When there is no control for measures of credit risk, measures of sustainability are significantly associated with credit spreads (and in the expected direction where corporate issuers with higher sustainability scores have lower credit spreads). The first five bars in Exhibit 10.1 are dark, indicating statistical significance. The height of the bars is, however, small in economic terms. A one standard deviation change in sustainability scores is associated with a 3–8 percent change in credit spreads. Once fundamental measures of credit risk are included (the second set of four bars), the statistical and economic strength of the relation between measures of sustainability and credit spreads is considerably weaker. Only the US IG bar is dark in the last four bars.
A common question that I have heard raised from asset owners is whether the relation between measures of sustainability and credit spreads has become stronger in recent years as investor attention to sustainability has increased. The panel regressions in DPR utilize the full sample of data and mask any temporal patterns. DPR note that across all four universes, with or without controlling for default forecasts, they do not find reliable evidence of a temporal trend in the relation between measures of sustainability and credit spreads. Exhibit 10.2 summarizes these results. Instead of estimating Equation (10.1) over the full sample, it is estimated each month and the monthly ![]() regression coefficient is volatility scaled to allow for comparability through time. There is not a strong temporal trend, but there was a large increase in the negative association between measures of sustainability and credit spreads at the start of the global pandemic (March 2020) for US IG and EU IG. Outside of that spike, there is little to suggest a trend consistent with increasing importance given to sustainability considerations in the determination of credit risk.
regression coefficient is volatility scaled to allow for comparability through time. There is not a strong temporal trend, but there was a large increase in the negative association between measures of sustainability and credit spreads at the start of the global pandemic (March 2020) for US IG and EU IG. Outside of that spike, there is little to suggest a trend consistent with increasing importance given to sustainability considerations in the determination of credit risk.
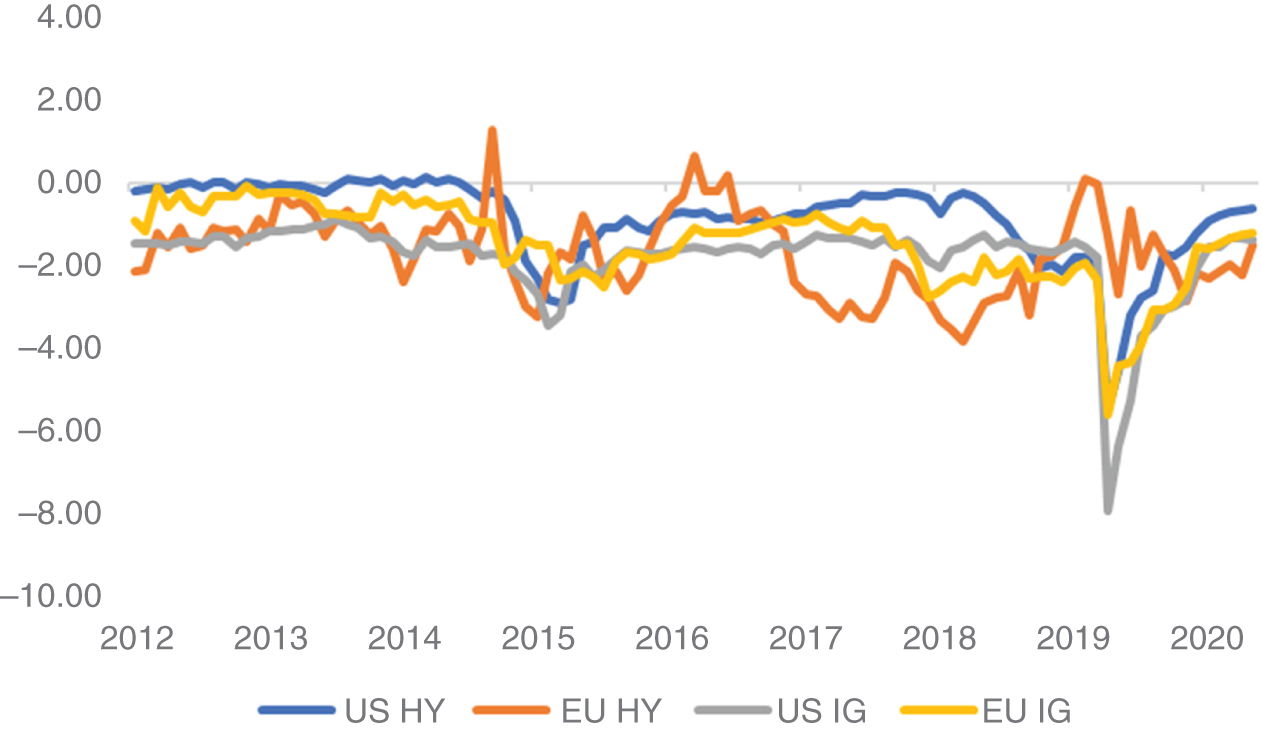
EXHIBIT 10.2 Temporal variation in the relation between measures of sustainability and credit spreads. The lines capture the volatility scaled  regression coefficient from estimating Equation (10.1) across the four corporate bond universes (US IG, US HY, EU IG, and EU HY).
Source: Diep, Pomorski, and Richardson (2021).
Another limitation of Equation (10.1) is that it is agnostic to the maturity dimension of credit risk. It is possible that any issues related to sustainability may take considerable time to manifest and impact corporate issuers. Specifically, the relation between measures of sustainability and credit spreads might be more muted for corporate bonds that mature in the near term, but that relation may be stronger for bonds that mature in the longer term. The fact that we have multiple bonds issued by the same corporate issuers provides a powerful setting to examine whether measures of sustainability impact credit spreads differentially based on the duration of that credit risk. DPR discuss unreported results where they estimate Equation (10.2) across their four corporate bond universes (subscripts omitted here for brevity).

For each corporate issuer that has at least two bonds outstanding, DPR select the bond with the longest remaining time to maturity (call that the ![]() bond). DPR then select another bond with the same seniority as the
bond). DPR then select another bond with the same seniority as the ![]() bond but with the shortest remaining time to maturity (call that the
bond but with the shortest remaining time to maturity (call that the ![]() bond). You can then compute the difference in spreads across the two bonds (
bond). You can then compute the difference in spreads across the two bonds (![]() ). To ensure comparability in pairs of bonds across issuers, this spread difference needs to be scaled by the difference in remaining time to maturity across the two bonds (
). To ensure comparability in pairs of bonds across issuers, this spread difference needs to be scaled by the difference in remaining time to maturity across the two bonds (![]() ). The dependent variable in Equation (10.2) captures the slope of the corporate issuer's credit curve. If measures of sustainability matter more for longer‐dated corporate bonds, you would expect to see
). The dependent variable in Equation (10.2) captures the slope of the corporate issuer's credit curve. If measures of sustainability matter more for longer‐dated corporate bonds, you would expect to see ![]() (i.e., corporate issuers with higher sustainability scores should have lower longer‐term credit spreads and hence flatter credit‐term structure). DPR estimate Equation (10.2) for each of their four corporate bond universes and only find a significant negative relation for the US IG universe, suggesting there is some evidence that the relation between measures of ESG and credit risk is attributable to longer‐term risks.
(i.e., corporate issuers with higher sustainability scores should have lower longer‐term credit spreads and hence flatter credit‐term structure). DPR estimate Equation (10.2) for each of their four corporate bond universes and only find a significant negative relation for the US IG universe, suggesting there is some evidence that the relation between measures of ESG and credit risk is attributable to longer‐term risks.
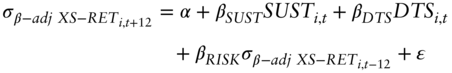
The empirical relation between measures of sustainability and future credit excess returns can be estimated by Equation (10.3).

The dependent variable in Equation (10.3) is beta adjusted ![]() scaled 1‐month ahead of credit‐excess returns. Yes, a bit of a tongue twister. The dependent variable is a measure of risk‐adjusted idiosyncratic returns. The beta is estimated using historical returns between the issuer and the respective corporate bond universe. The
scaled 1‐month ahead of credit‐excess returns. Yes, a bit of a tongue twister. The dependent variable is a measure of risk‐adjusted idiosyncratic returns. The beta is estimated using historical returns between the issuer and the respective corporate bond universe. The ![]() deflation is to mitigate issues of heteroskedasticity and facilitates better comparison across issuers that vary in risk terms (as discussed in Chapter 6, the product of spread duration and spread,
deflation is to mitigate issues of heteroskedasticity and facilitates better comparison across issuers that vary in risk terms (as discussed in Chapter 6, the product of spread duration and spread, ![]() , is a useful heuristic for risk, Ben Dor et al. 2007). DPR estimate Equation (10.3) separately for each of their four corporate bond universes with and without controlling for expected returns,
, is a useful heuristic for risk, Ben Dor et al. 2007). DPR estimate Equation (10.3) separately for each of their four corporate bond universes with and without controlling for expected returns, ![]() . The
. The ![]() is based on the full set of systematic signals described in Chapter 6.
is based on the full set of systematic signals described in Chapter 6.
Exhibit 10.3 shows the test statistics for the ![]() regression coefficient across the eight regression specifications (four corporate bond universes, with and without
regression coefficient across the eight regression specifications (four corporate bond universes, with and without ![]() ). The relation between credit‐excess returns and sustainability measures is virtually nonexistent (all bars are gray scaled, and test statistics are far from conventional thresholds of significance). This inference is true whether we include ex ante forecasts of expected returns or not.
). The relation between credit‐excess returns and sustainability measures is virtually nonexistent (all bars are gray scaled, and test statistics are far from conventional thresholds of significance). This inference is true whether we include ex ante forecasts of expected returns or not.

EXHIBIT 10.3 Histogram showing the statistical significance of measures of sustainability in explaining future beta adjusted credit‐excess returns. Dark (gray) bars indicate statistical significance (insignificance) at conventional thresholds. The four corporate bond universes are US IG, US HY, EU IG, and EU HY.
Source: Diep, Pomorski, and Richardson (2021).
The final empirical assessment of the direct investment relevance of sustainability measures for credit investors in DPR is the assessment of return volatility (ex post risk). Equation (10.4) is estimated for each of the four corporate bond universes.
The dependent variable in Equation (10.4) is the volatility of beta adjusted credit‐excess returns (estimated at the issuer level by averaging credit‐excess returns across bonds linked to the issuer). These returns are not ![]() scaled, because that would be using future information (i.e., the return for each month is scaled by
scaled, because that would be using future information (i.e., the return for each month is scaled by ![]() at the start of that month). Instead, DPR add
at the start of that month). Instead, DPR add ![]() as an explanatory variable (which is measured at the start of the 12‐month period over which volatility is estimated, so there is no look‐ahead bias). Except for EU HY, measures of sustainability are consistently negatively associated with the volatility of future idiosyncratic credit‐excess returns. Even after controlling for lagged volatility and
as an explanatory variable (which is measured at the start of the 12‐month period over which volatility is estimated, so there is no look‐ahead bias). Except for EU HY, measures of sustainability are consistently negatively associated with the volatility of future idiosyncratic credit‐excess returns. Even after controlling for lagged volatility and ![]() , there is still reliable evidence of measures of sustainability helping to explain variation in the volatility of future idiosyncratic credit excess returns. Exhibit 10.5 provides an assessment of both the statistical significance (color of bars) and economic significance (height of bars).
, there is still reliable evidence of measures of sustainability helping to explain variation in the volatility of future idiosyncratic credit excess returns. Exhibit 10.5 provides an assessment of both the statistical significance (color of bars) and economic significance (height of bars).
Although most of the bars are black (statistically significant as per Exhibit 10.4), the height of the bars is, however, small in economic terms. A one‐standard‐deviation change in sustainability scores is associated with a 7 to 15 percent change in future idiosyncratic credit excess return volatility (relative to the average level of volatility in the respective corporate bond universe). Once measures of credit risk are also included (the rightmost set of four bars), the economic strength of the relation between measures of sustainability and credit spreads is considerably weaker. A one‐standard‐deviation change in sustainability scores is associated with a 2 to 5 percent change in future idiosyncratic credit excess return volatility (again, relative to the average level of volatility in the respective corporate bond universe).
EXHIBIT 10.4 Regression results of Equation (10.4). The four corporate bond universes are US IG, US HY, EU IG, and EU HY. Regression coefficients are reported above italicized test statistics.
| US IG | US HY | EU IG | EU HY | |||||
|---|---|---|---|---|---|---|---|---|
| I | II | I | II | I | II | I | II | |
| 0.0294 | 0.0069 | 0.0994 | −0.0076 | 0.0232 | 0.0071 | 0.0665 | 0.0071 | |
| 23.27 | 6.07 | 15.63 | −1.23 | 15.29 | 5.58 | 7.16 | 1.14 | |
| −0.0008 | −0.0003 | −0.0059 | −0.0019 | −0.0009 | −0.0003 | −0.0021 | −0.0006 | |
| −3.69 | −2.08 | −4.49 | −2.47 | −4.19 | −2.26 | −1.48 | −0.59 | |
| 0.1151 | 0.4620 | 0.0726 | 0.1948 | |||||
| 14.40 | 10.49 | 8.80 | 4.72 | |||||
| 0.4086 | 0.3396 | 0.4038 | 0.5290 | |||||
| 7.34 | 5.05 | 7.80 | 4.66 | |||||
| 30.0% | 48.7% | 11.2% | 38.1% | 14.9% | 37.3% | 11.7% | 36.8% | |
Source: Diep, Pomorski, and Richardson (2021).
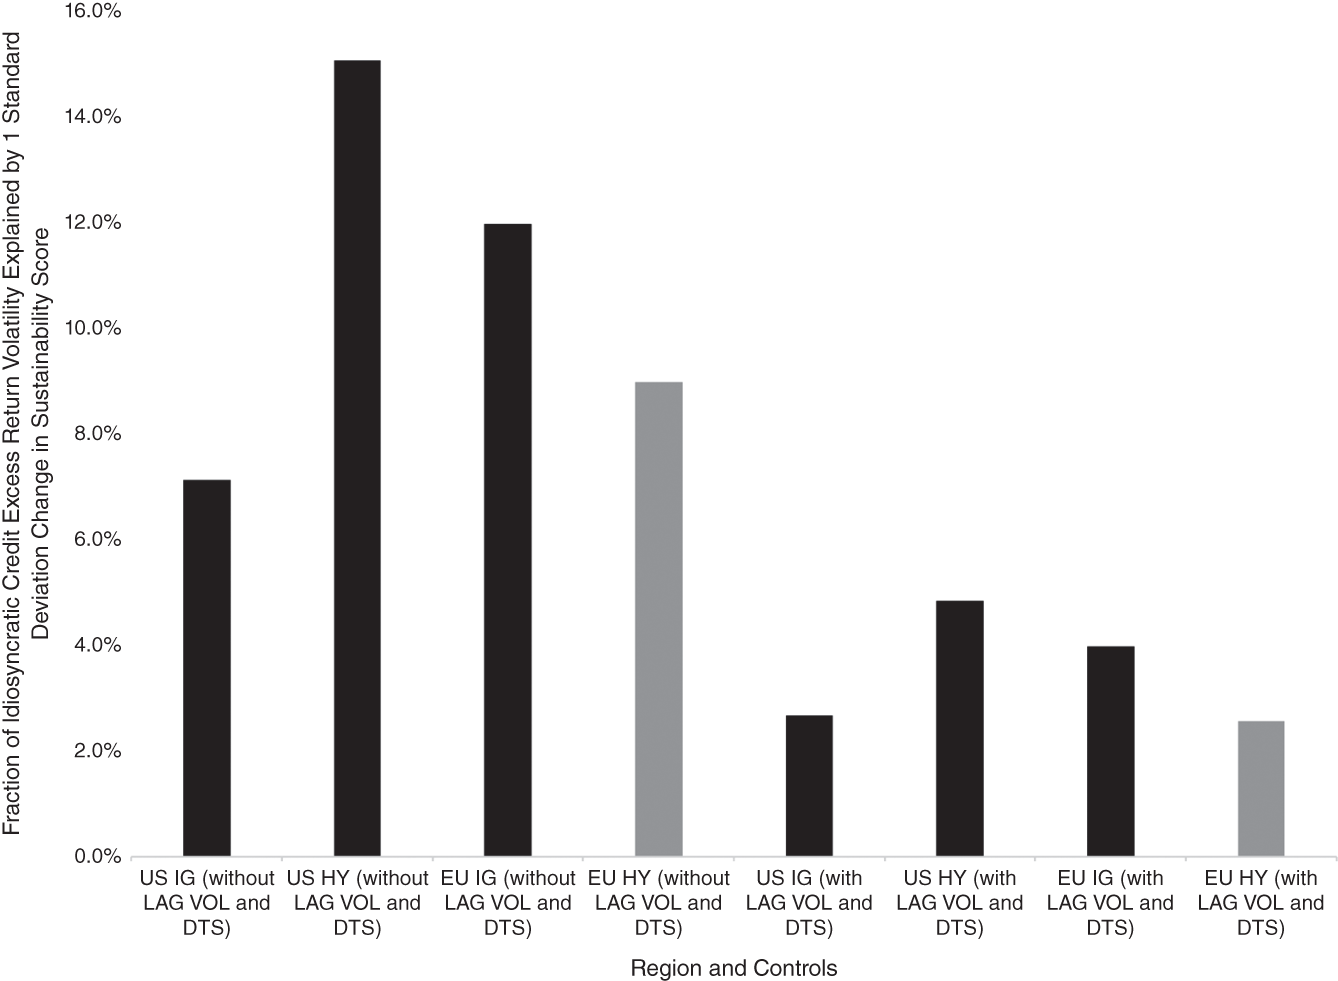
EXHIBIT 10.5 Histogram showing the fraction of variation in credit spreads explained by a one standard deviation change in measures of sustainability. Dark (gray) bars indicate statistical significance (insignificance) at conventional thresholds. The four corporate bond universes are US IG, US HY, EU IG, and EU HY.
Source: Diep, Pomorski, and Richardson (2021).
It is important to emphasize the optimistic take‐away in DPR. Although the set of empirical evidence linking measures of sustainability to (i) credit spreads, (ii) credit spread term structure, (iii) future credit excess returns, and (iv) future idiosyncratic credit excess return volatility, was generally modest, this does not necessarily mean that sustainability is not of direct use to investors and asset owners. The empirical analysis is limited by (i) sample period (2012–2020), (ii) breadth of measures (only one third‐party commercial provider was examined), and (iii) context (aggregate measures of sustainability were examined across all corporate issuers). It is possible with different time periods, different data sets, and more tailored measures of sustainability relevant for each corporate issuer that the inferences might be different. But caution is needed; do not exhaust all possible measures and samples looking for a result and then claim victory. For the true systematic investor, that is called in‐sample data mining, and such behavior is a cardinal sin.
10.2.2 Incorporating Sustainability Awareness into the Portfolio
The second, and more commercially relevant, part of DPR is the analysis of how awareness of sustainability can be incorporated into a systematic investment process. Think of the scale of the investment challenge here. The investor is still trying to achieve the best risk‐adjusted returns possible utilizing the full breadth and depth of signals discussed in Chapter 6 and all the portfolio construction choices discussed in Chapters 8 and 9. Now you are asking the investor to also consider multiple aspects of sustainability when building the portfolio. How an individual following a traditional discretionary process can adequately handle the various trade‐offs here is beyond my understanding. I think systematic investment processes generally are uniquely suited to solving the joint challenge of maximizing risk‐adjusted returns in a liquidity challenged asset class while achieving multiple sustainability targets. Also note that the original portfolio that maximizes risk‐adjusted returns should already include any measure of sustainability that the investor is convinced, both conceptually and empirically, improves the portfolio (e.g., Fitzgibbons, Pedersen, and Pomorski 2021).
What are the dimensions of sustainability that could be incorporated into a systematic investment process? DPR examine the following dimensions. First, DPR incorporate static screens to remove issuers whose business models cover controversial weapons, fossil fuels, and tobacco. Second, they incorporate tactical/dynamic screens that exclude the worst corporate issuers from a sustainability perspective (defined as belonging to the bottom 10 percent of MSCI scores). Third, they explicitly tilt the portfolio to achieve an overall sustainability score that is 10 percent better than the benchmark. Fourth, they ensure that the final portfolio always has a carbon intensity that is at least 25 percent below that of the benchmark. Their analysis looks at a global high‐yield benchmark (ICE/BAML Developed Markets High Yield Index, ticker: HYDM). The approach has equal efficacy in IG corporate bond markets as well.
There are two sets of exclusions (static in the case of business models and tactical in terms of relative sustainability scores) in this sustainable portfolio. The static exclusions remove corporate issuers in (i) tobacco (defined as corporations with more than 5 percent of revenue generated from tobacco), (ii) controversial weapons (defined as corporations involved in the production of, or key components to, or generating revenue from controversial weapons including cluster munitions, landmines, chemical and biological weapons), and (iii) fossil fuels (defined as corporations with any fossil fuel reserves or deriving more than 10 percent of their revenue from either thermal coal or oil sands). The tactical exclusion removes corporate issuers who have industry‐adjusted sustainability scores in the bottom 10 percent of the region (i.e., US and EU separately). This exclusion requires a nonmissing sustainability score to be available from MSCI. They retain issuers that do not have a sustainability score from MSCI. This is equivalent to assuming the issuer is “average” relative to its peer group. In the absence of issuer‐specific sustainability information, it is difficult to justify any alternative treatment.
Both the static and tactical exclusions reduce investment breadth. DPR note that the combined impact on breadth for the US (EU) HY universe is a loss of 18.1 (12.8) percent of market capitalization and a loss of 11 (7) percent of corporate issuers. The exclusions do not make a portfolio solution unfeasible; there are still enough liquid issuers across sectors to engage in security selection.
The tilting of the portfolio toward a higher sustainability score relative to the benchmark also involves a choice for missing data. In this case, DPR do not reward corporate issuers with missing sustainability scores. So, the tilting can only be operationalized for those corporate issuers with available sustainability scores.
The carbon awareness screen involves many choices. DPR consider only Scope 1 and Scope 2 carbon emissions. These emissions are measured relative to the revenue of the corporate issuer (what is called carbon intensity). An imputation method is used for corporate issuers with missing data from TruCost; DPR use the average carbon intensity for all companies with available data in the same industry group. Alternative choices could be made here including (i) approaches to estimate Scope 3 carbon emission from knowledge of the customers and suppliers of each corporate entity, and (ii) scaling carbon emissions by a measure of enterprise value rather than sales to ensure a complete allocation of carbon emissions across all capital providers to the corporation (this measure is not widely used but is starting to gain traction in Europe).
What is the impact of the tactical sustainability exclusions, sustainability tilts, and carbon reduction? How should the thresholds be set for each of these portfolio constraints? Given all of these sustainability constraints move the portfolio away from the original optimal solution (remember the original portfolio already includes any measure of sustainability the investor has both conceptual and empirical support for improved risk‐adjusted returns), the rational expectation for adding these constraints is a reduction in expected returns. Exhibit 10.6 illustrates the extent of this expected return reduction. This analysis is all ex ante (i.e., the portfolio level expected return is the sum‐product of portfolio weights and expected returns for each corporate issuer in the portfolio). It is not based on realized returns (that may lead to deficient portfolio choices if flows or investor attention to sustainability distort returns in this sample period). The expected returns include the full breadth and depth of systematic measures for credit‐sensitive assets covered in Chapter 6.
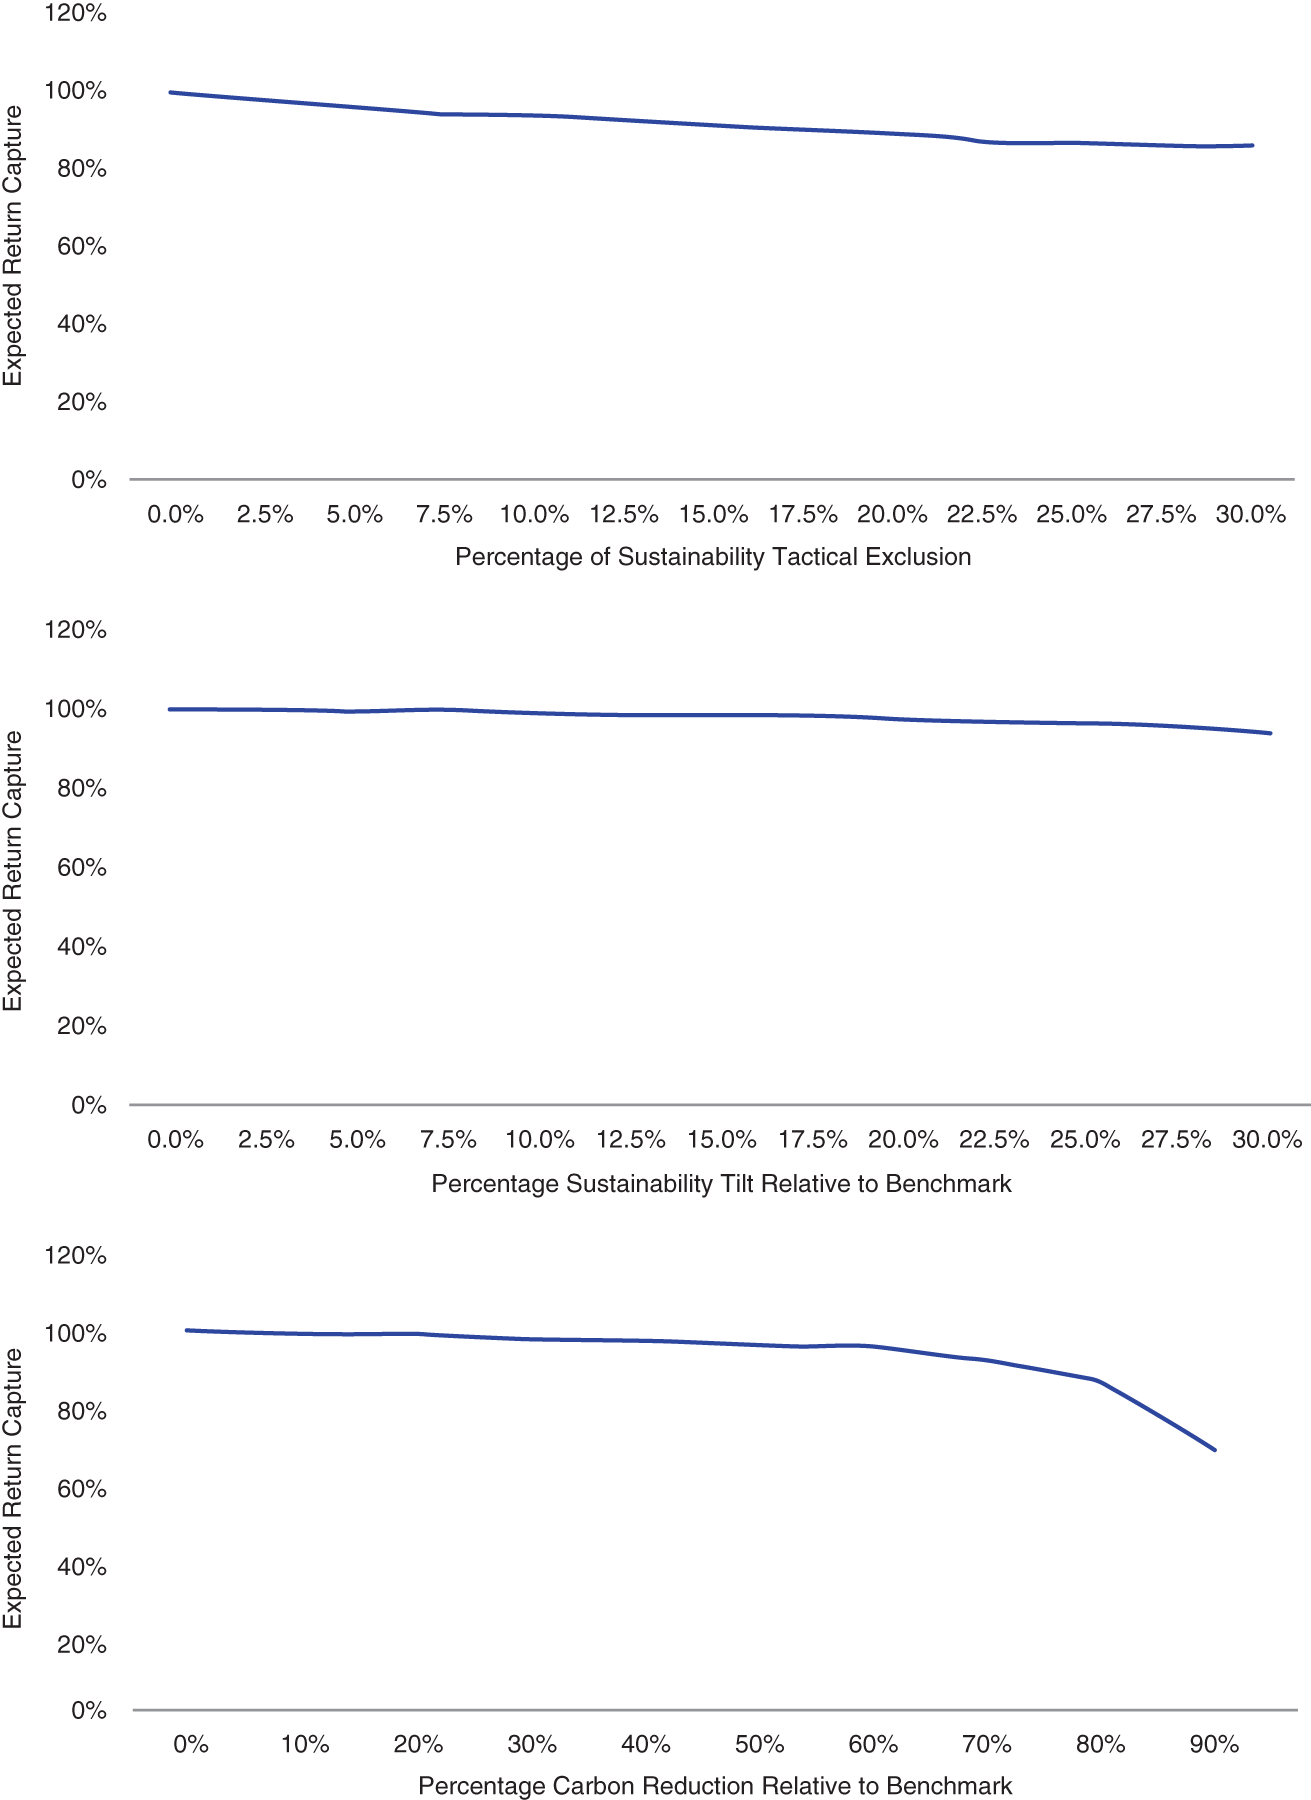
EXHIBIT 10.6 Reduction in portfolio level expected returns from increasing sustainability awareness across (i) tactical exclusions, (ii) sustainability tilts, and (iii) carbon intensity reduction. Zero percent corresponds to the base case systematic global HY portfolio that ignores these sustainability considerations. A frontier of portfolio‐level expected returns is shown for different levels of sustainability awareness.
Source: Diep, Pomorski, and Richardson (2021).
For both the sustainable tactical exclusion and sustainability tilts, the expected return frontier is downward sloping but relatively flat. That means a meaningful amount of tactical exclusions and tilts is possible. At first glance, this seems too good to be true. It is possible because (i) there are still enough nonexcluded corporate issuers to engage in security selection (and maintain beta exposure across sector, rating, and maturity categories as was discussed in Chapter 8), and (ii) the original portfolio is not seeking out exposure to corporate issuers that score poorly on sustainability measures. The return frontier is not guaranteed to be flat; it will be steeply declining for a portfolio that targeted exposure to those issuers with the lowest sustainability scores or those that operated in controversial lines of business.
The expected return frontier for carbon intensity reduction is initially flat and then quickly declines beyond a 70 percent reduction. It is possible to have significant improvements in the carbon emissions profile without meaningfully impacting portfolio returns because carbon intensity (at least measured using Scope 1 and Scope 2 emissions) is currently concentrated in a small number of industries. This inference is not generally true. With a broader measure of carbon emissions and as technology evolves to be less carbon intensive, it may become very difficult to have such large reductions in carbon intensity relative to the benchmark. For this reason, many institutional investor guidelines commit to carbon reduction relative to a fixed level of carbon emissions (e.g., as of 2019 or 2020) rather than the prevailing carbon intensity in the benchmark.
What does a sustainable systematic global HY corporate bond portfolio look like relative to a standard systematic global HY corporate bond portfolio? Exhibit 10.7 shows the cumulative returns for both portfolios relative to the global HY benchmark. Yes, there are three lines in Exhibit 10.7. The return profile (realized not ex ante here) for the regular systematic portfolio and the sustainable systematic portfolio are just very similar to each other. This is not too surprising, as the thresholds for sustainability awareness were selected such that there was not much of an ex ante reduction in portfolio returns. This is no guarantee that integrating sustainability would not affect portfolio returns for different time periods, different sustainability measures, or different thresholds for sustainability awareness.
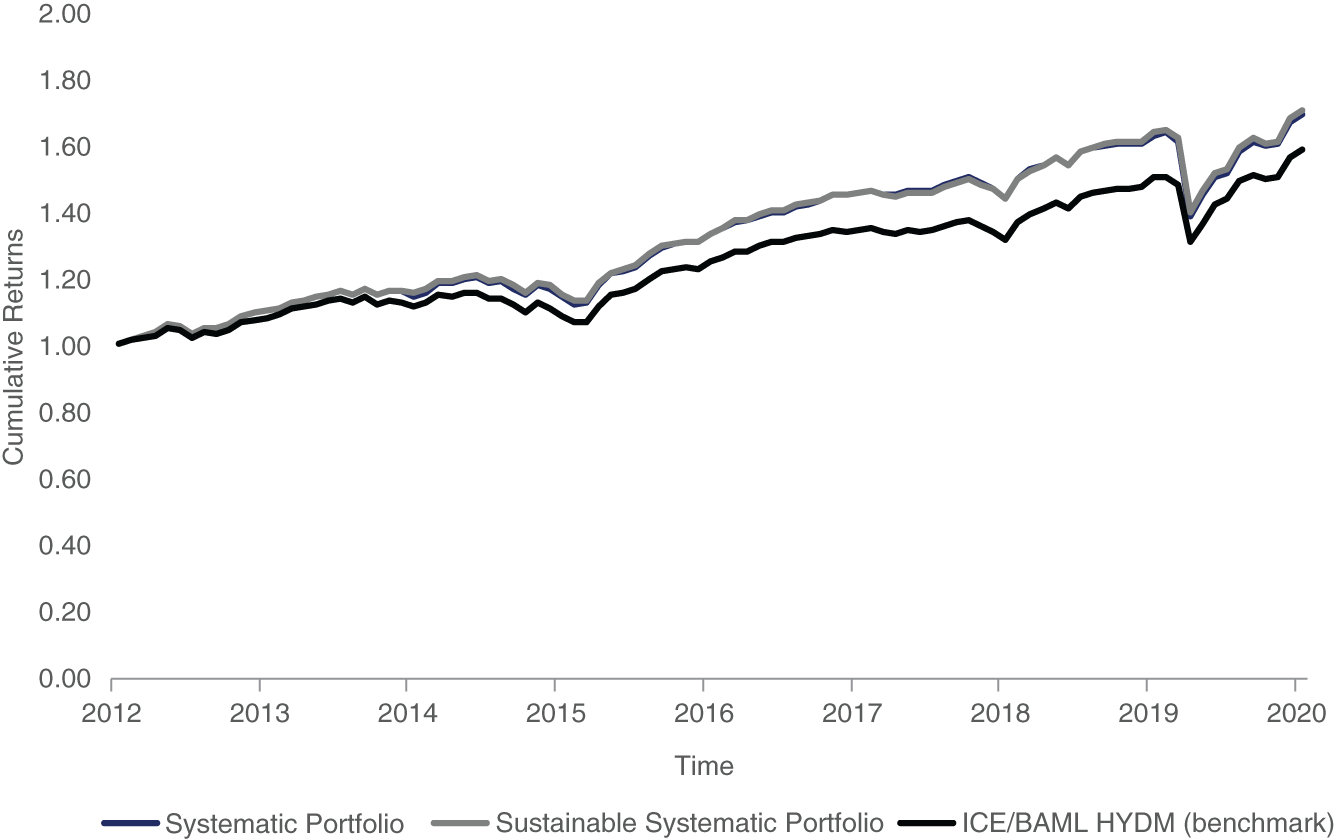
EXHIBIT 10.7 Cumulative performance of sustainable systematic global high yield portfolio, regular systematic global high yield portfolio, and global high yield benchmark (ICE/BAML Global High Yield Developed Markets, ticker: HYDM).
Source: Diep, Pomorski, and Richardson (2021).
DPR also note that the characteristics of the two portfolios (number of bonds, rating breakdown, sector breakdown, maturity breakdown) are all very similar. Overall, the results suggest that the static sustainability exclusions, tactical sustainability exclusions, sustainability tilts, and economically meaningful reductions in carbon intensity can be achieved without sacrificing return potential. This leaves the asset owner with a favorable outcome: although pursuing sustainability objectives in and of themselves may not improve performance, incorporating sustainability awareness, up to a point, may not be detrimental to risk‐adjusted returns.
10.2.3 Other Topics
- Are there measures of sustainability that are relevant from an investment perspective?
There are credible measures of “sustainability” that have both conceptual and empirical evidence supporting their inclusion into an active investment process. These measures tend to fall within the “governance” component of ESG/sustainability. For example, reduced‐form measures like aggregate accruals reflect the quality of the senior management team of a company and their strategic use of discretion within the financial reporting system. Corporate issuers with higher levels of aggregate accruals have been shown to experience lower levels of future profitability, more negative analyst revisions, higher risk of earnings restatements and class action lawsuits, and lower future stock returns (see e.g., Sloan 1996; Bradshaw, Richardson, and Sloan 2001; Richardson, Sloan, Soliman, and Tuna 2006). Bhojraj and Swaminathan (2009) demonstrated that corporate‐bond credit‐excess returns are negatively associated with measures of accruals (i.e., corporate issuers with higher levels of accruals, as a proxy for poorer governance, experience lower future credit‐excess returns). Exhibit 10.8 shows this result using a more recent dataset for a combined US and EU IG universe. Corporate issuers with poor governance, as measured by high level of accruals, do experience lower future credit‐excess returns. There will be other measures of governance that may improve risk‐adjusted returns for active fixed income investors.
- Distinguishing flows from expected returns.
As discussed in Pedersen, Fitzgibbons, and Pomorski, (2021), the relation between measures of sustainability and expected returns is nuanced. If investors shun securities with poor sustainability attributes, these securities will experience low returns while investors remove these securities from their portfolios. However, going forward those securities may earn a high return as compensation for the relative investor neglect. The dynamics depend on the mix of investor types and their trading decisions. Unfortunately, this can greatly complicate empirical analysis on the relation between sustainability measures and future returns due to the impact of in‐sample flows into or out of securities with high or low sustainability scores. Specifically, it may be the case that flows into securities with favorable sustainability scores experience positive returns while that net flow is occurring, but once a new equilibrium of holdings has been reached, those same securities will experience a lower future return. Indeed, this is the exact point made in Pastor, Stambaugh, and Taylor (2021). This is important as it directly affects the potential usefulness of recent empirical studies attempting to show how sustainability measures affect future security returns. This is a challenge for all investors, not just fixed income investors and not just systematic investors.

EXHIBIT 10.8 Measures of governance and their relation to corporate bond returns. Governance measure is aggregate accruals from Richardson, Sloan, Soliman, and Tuna (2005).
Sources: AQR (2019), ICE/BAML indices.
- Role of labeled bonds
A discussion of labeled bonds can be found at the end of Chapter 9. In the context of building sustainable corporate bond portfolios the role of labeled bonds is likely to increase going forward. The supply of labeled bonds is growing, and although these bonds are typically not included in the standard corporate bond indices, this may change in the future, and security selection choices within the corporate issuer (labeled vs nonlabeled bonds) may become an additional investment consideration.
10.3 SUSTAINABLE INVESTING WITH RATE‐SENSITIVE ASSETS
I close this chapter with a conceptual discussion of integrating sustainability awareness into a government bond portfolio. Why? To date, there is not yet general acceptance on how to (i) operationalize measurement of sustainability at the country level, and (ii) think about trade‐offs of tracking error from exclusions and tilts in a very concentrated asset class. As we have discussed in earlier chapters, the universe of corporate bonds contains thousands of issuers, and excluding a small set of corporate issuers based on sustainability considerations does not greatly reduce the effective breadth of the investment opportunity set. However, for government bond portfolios (both developed and emerging markets) there is a far greater concentration in market capitalization and number of bonds among a very small number of sovereign entities. This makes integrating sustainability into government bond portfolios more challenging and more limiting (i.e., it is often not possible to exclude issuers).
10.3.1 What Might Some Measures of Sustainability Be at the Country Level?
Robeco (2021) provides an excellent summary of one approach to incorporate country‐level sustainability into macroportfolios. Exhibit 10.9 is taken from the Appendix of Robeco (2021) and describes how Robeco thinks of the multiple dimensions of sustainability (environmental, social, and governance). Within each category they have multiple measures with a highly diversified overall country sustainability score. I'm not suggesting the Robeco approach is the best or only approach, but it is a very useful illustration of the breadth of dimensions that may need to be considered (many other asset managers publish white papers describing how they think about sustainability at the country level including PIMCO, AQR, Acadian, JP Morgan, Bridgewater Associates, Schroders, and GMO). There are many differences in the types of data utilized across asset managers and the weights assigned to different dimensions of sustainability across countries. Berg, Koelbel, and Rigobon (2019) have commented on the divergence of sustainability scores across third‐party data providers for corporate issuers; the divergence in scores across countries is also likely to be considerable. Exhibit 10.10 shows a global map with a breakdown of current country sustainability scores using the Robeco framework.

EXHIBIT 10.9 A framework for measuring country‐level sustainability.
Source: Robeco (2021).
Although I am personally happy to see Australia score highly on broad measures of sustainability, it is useful to contrast this with narrower measures of carbon intensity/emissions. How to measure carbon emissions at the country level? Like corporate bonds there is considerable choice here. Most measures will look something like ![]() , where
, where ![]() could reflect (i) emissions from what is produced in that country (export perspective), (ii) emissions from what is consumed in that country (import perspective), or (iii) a combination of what is produced and what is used in that country (territorial perspective). This latter approach is like the Scope 3 idea for corporates. As with all attempts to measure carbon emission at this aggregate level, there will be double counting. The scalar is designed to adjust for the size of the country (like the carbon intensity measure used for corporates) and could include (i) country level GDP, (ii) population, or (iii) total amount of sovereign debt outstanding. Depending on the scalar chosen (e.g., debt outstanding), Australia can look very poor on country emission criteria. Choices on sustainability measurement can have a very large influence on the final portfolio weights.
could reflect (i) emissions from what is produced in that country (export perspective), (ii) emissions from what is consumed in that country (import perspective), or (iii) a combination of what is produced and what is used in that country (territorial perspective). This latter approach is like the Scope 3 idea for corporates. As with all attempts to measure carbon emission at this aggregate level, there will be double counting. The scalar is designed to adjust for the size of the country (like the carbon intensity measure used for corporates) and could include (i) country level GDP, (ii) population, or (iii) total amount of sovereign debt outstanding. Depending on the scalar chosen (e.g., debt outstanding), Australia can look very poor on country emission criteria. Choices on sustainability measurement can have a very large influence on the final portfolio weights.
10.3.2 What Portfolio Approaches Have Been Adopted for Government Bonds?
There are many approaches taken by asset managers to incorporate sustainability at the country level. In this section, I will discuss one approach used by Bridgewater Associates because it makes use of a different approach to incorporate sustainability. Bridgewater Associates is an investment management company located in Westport, Connecticut, that manages about $140 billion USD. They have a well‐known strategy called “All Weather” that is designed to harvest risk premium across multiple asset classes, and they have recently launched a sustainable version of All Weather. At the core of this sustainable strategy are the United Nations sustainable development goals. Exhibit 10.11 illustrates the set of 17 sustainable development goals (SDGs).1
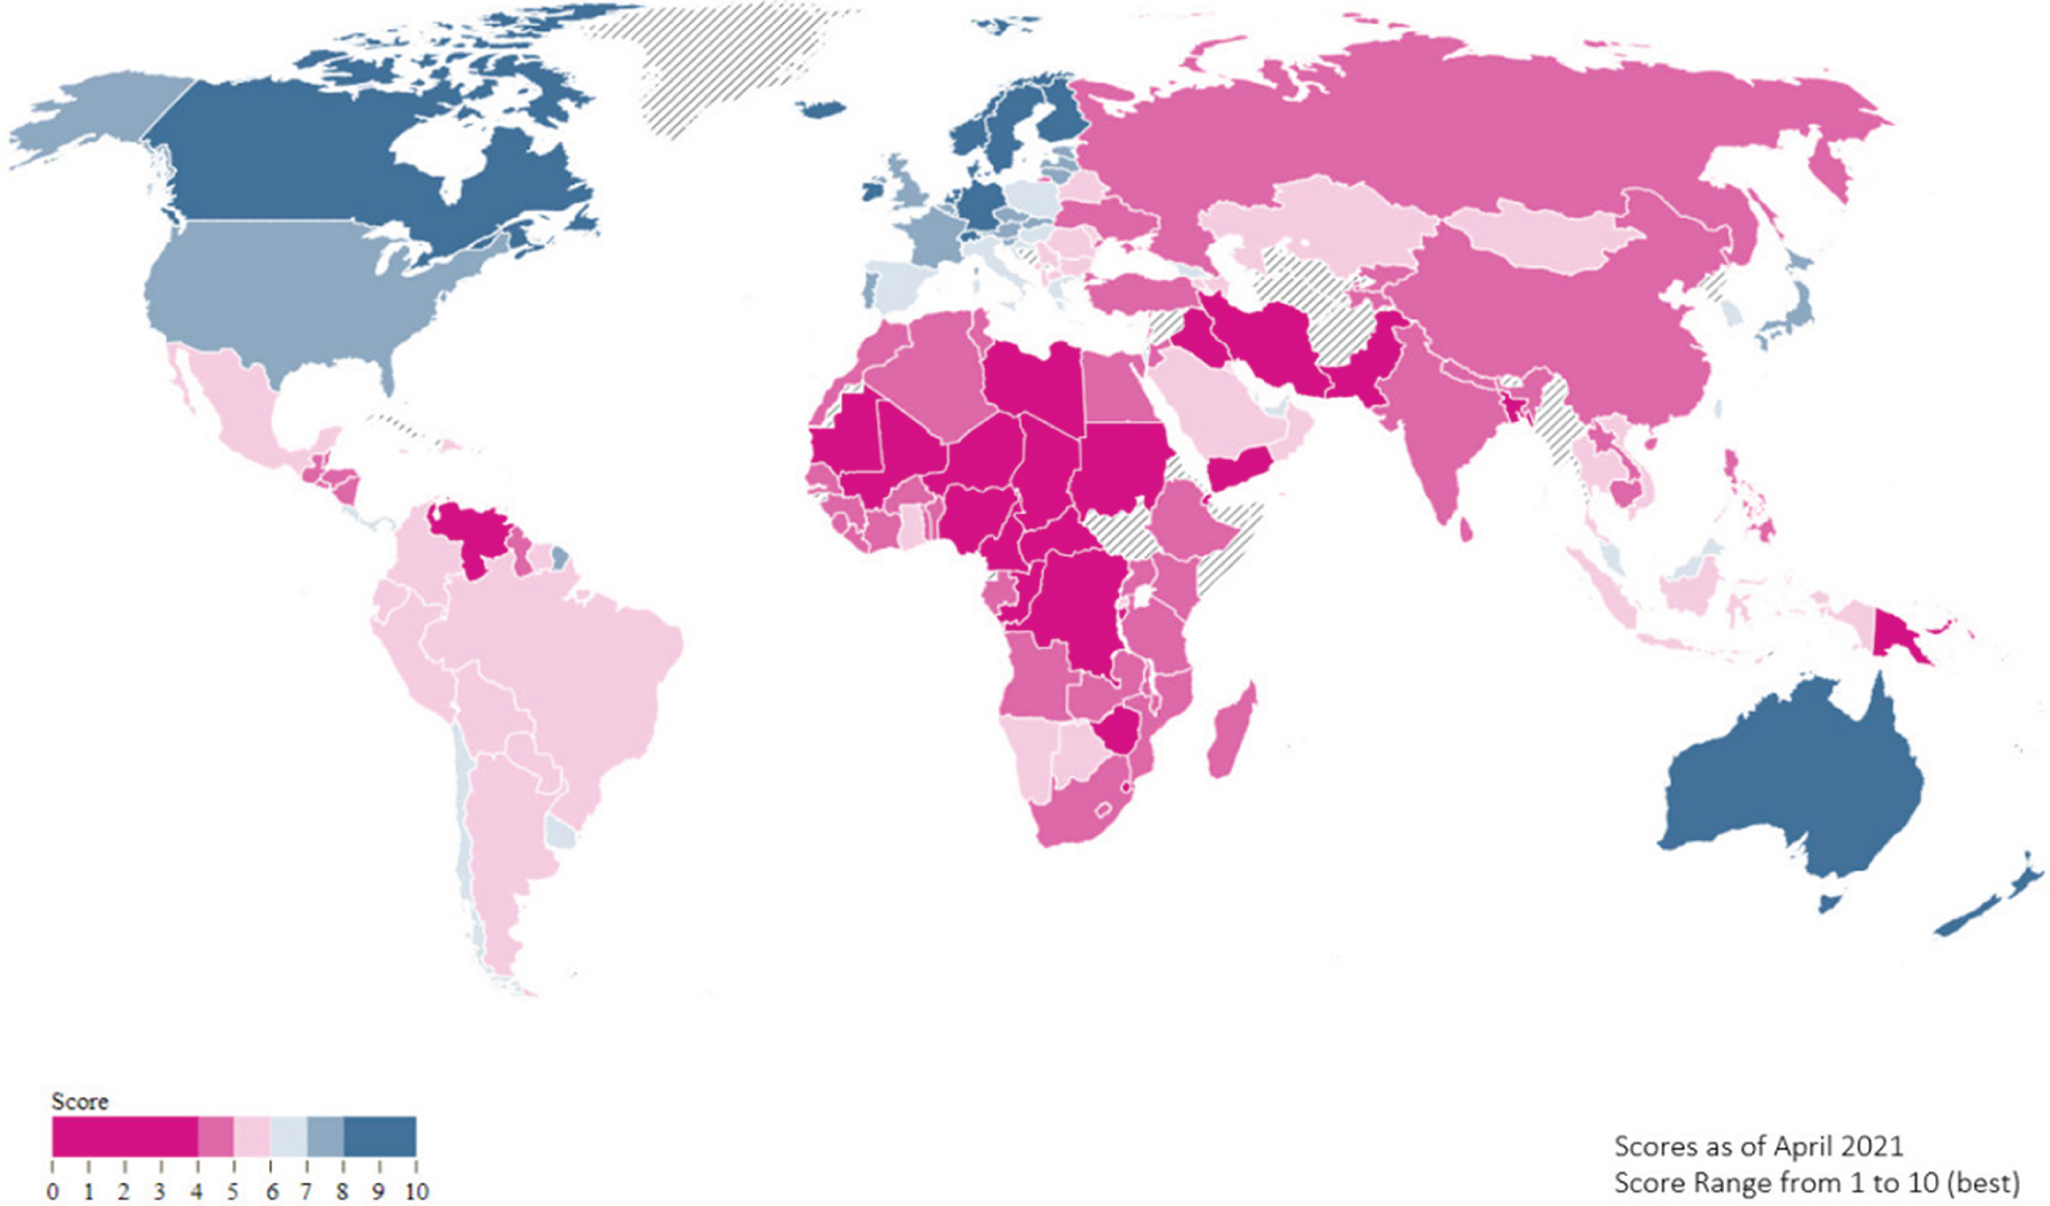
EXHIBIT 10.10 Global map showing country‐level sustainability scores.
Source: Robeco (2021).
Integrating sustainability in this way requires (i) identification of SDGs that are relevant for your investment objective (asset owners will have different views on which of the 17 SDGs matter most for them), and (ii) estimating country level sensitivity to those SDGs. This sensitivity needs to be estimated and there is no generally agreed way to do this (examples might include text analysis of company business models rolled up to the country level for country equity investment decisions, or analysis of some of the data sources mentioned in Robeco (2021)).
APG Asset Management, a Dutch entity, responsible for the pension assets of 4.5 million participants covering over €575 billion in assets, are also strong advocates of integrating SDGs into the investment process. As of the start of 2021, APG had around €80 billion of their assets invested consistent with SDGs, with a large focus on SDG7 (clean and affordable energy). Why do I single out APG? They have been developing a rich taxonomy of company‐level alignment with investment‐relevant SDGs, and this matrix of company‐SDG alignment is starting to be utilized in equity portfolios. Going forward, there may be an adoption of common SDG alignment scores both at the corporate and sovereign level. Such movements would help provide structure to the discussion of sustainability. Of course, it may prove too difficult to get general agreement on sustainability, because asset‐owner views on which dimensions are important and how they should be weighted might simply be too heterogenous for any common solution to emerge.
10.3.3 Other Topics
- Screening versus tilting
Although exclusions were feasible in the large corporate bond universes, they are not typically used for government bond portfolios. A typical developed‐market bond portfolio (e.g., W0G1 from ICE/BAML) might contain over 1,000 bonds, but those bonds are issued by a small number of sovereigns. As of December 31, 2020, the 10 largest sovereign issuers in W0G1 accounted for 95 percent of the total market capitalization of W0G1, and of that the United States and Japan accounted for 63 percent. If your measure of sustainability excluded the United States or Japan, that would greatly affect your tracking error relative to a standard developed‐market government‐bond index. Concentration is also high in emerging‐market bond portfolios (e.g., although the JP Morgan EMBIGD index that we covered in Chapter 7 contained 861 bonds as of December 31, 2020, across 87 distinct sovereign issuers, a small number of issuers account for a large share of this index notably Brazil, Mexico, Indonesia, and Turkey). Again, a sustainability criterion that excluded Brazil or Mexico would have an outsized impact on tracking error relative to a standard emerging market government bond index. For this reason, tilting is far more common for sustainable government bond portfolios.

EXHIBIT 10.11 United Nations sustainable development goals.
Source: United Nations (https://sdgs.un.org/goals).
- Developed‐market versus emerging‐market tilts
A related consideration is how to deal with portfolios that have allocations to both developed and emerging market sovereign bonds. Although typical long‐only fixed income allocations separate developed‐ and emerging‐market government bonds, other macrostrategies will typically include allocations to both developed‐ and emerging‐market rate‐sensitive assets. In these portfolios, choices need to be made about how to score on the sustainability dimension. There can be drastic differences in sustainability across developed and emerging markets, and comparing across these groups may cause heavy tilts away from emerging markets. At a conceptual level, this may be the correct response if absolute standards of sustainability are important. However, in practice, to moderate the tracking‐error impact of screens and tilts, developed‐ and emerging‐market sovereigns are typically evaluated within their respective universes.
- What measures might work?
There are credible measures of “sustainability” that have both conceptual and empirical evidence supporting their inclusion into an active investment process for government bonds. These measures tend to fall within the “quality” or “governance” component of sustainability. For example, Brooks, Richardson, and Xu (2020) note that a credible reduced‐form measure of quality for emerging governments is their ability to achieve low and stable levels of inflation. This is a reduced‐form measure reflecting the quality of macroeconomic policy of the sovereign entity (a lower level of forecasted inflation is an indicator of higher‐quality macroeconomic risk management by the sovereign). Exhibit 10.12 shows the relation between inflation level and future emerging‐government bond credit‐excess returns. Emerging sovereigns with higher governance scores (lower levels of inflation) have higher excess returns.
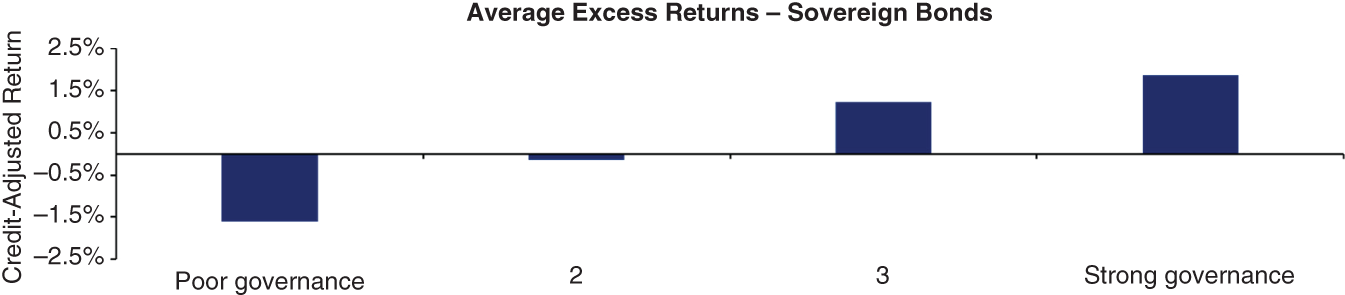
EXHIBIT 10.12 Measures of governance and their relation to government bond returns. The governance measure is the level of inflation and expected level of inflation as used in Brooks, Richardson, and Xu (2020).
Sources: AQR (2019), JP Morgan Indices, Consensus Economics.
REFERENCES
- AQR. (2019). Responsible asset selection: ESG in portfolio decisions. White paper.
- Ben Dor, A., Dynkin, L., Hyman, J., Houweling, P., Van Leeuwen, E., and Penniga, O. (2007). DTS (Duration Times Spread). Journal of Portfolio Management, 33, 77–100.
- Berg, F., J. Koelbel, and R. Rigobon. (2019). Aggregate confusion: The divergence of EGS ratings. Working paper, MIT.
- Berg, F., J. Koelbel, A. Pavlova, and R. Rigobon. (2021). ESG confusion and stock returns: Tackling the problem of noise. Working paper, MIT.
- Bhojraj, S., and B. Swaminathan. (2009). How does the corporate bond market value capital investment and accruals? Review of Accounting Studies, 14, 31–62.
- Bradshaw, M., S. Richardson, and R. Sloan. (2001). Do analysts and auditors use information in accruals? Journal of Accounting Research, 39, 45–74.
- Brooks, J., S. Richardson, and Z. Xu. (2020). (Systematic) investing in emerging market debt. Journal of Fixed Income, 30, 44–61.
- Callan (2020). Callan 2020 ESG Survey.
- Correia, M., S. Richardson, and İ. Tuna. (2012). Value investing in credit markets. Review of Accounting Studies, 17, 572–609.
- Correia, M., J. Kang, and S. Richardson. (2018) Asset volatility. Review of Accounting Studies, 23, 37–94.
- Diep, P., L. Pomorski, and S. Richardson. (2021). Sustainable systematic credit. Working paper, AQR.
- Pastor, L., R. Stambaugh and L. Taylor. (2021). Dissecting green returns. Working paper, University of Pennsylvania.
- Pedersen, L., Fitzgibbons, S., and L. Pomorski. (2021). Responsible investing: The ESG‐efficient frontier. Journal of Financial Economics, 142, 572–597.
- Richardson, S., Sloan, R., Soliman, M., & Tuna, İ. (2005). Accrual reliability, earnings persistence, and stock prices. Journal of Accounting and Economics, 39, 437–485.
- Richardson, S., Sloan, R., Soliman, M., & Tuna, İ. (2006). The implications of accounting distortions and growth for accruals and profitability. The Accounting Review, 81, 713–743.
- Robeco. (2021). Country sustainability ranking – summer 2021 update. White paper.
- Sloan, R. (1996). Do stock prices fully reflect information in accruals and cash flows about future earnings? The Accounting Review, 71, 289–316.