Chapter 12
Managing Tableau Server
All good-to-great companies began the process of finding a path to greatness by confronting the brutal facts.
—James Collins1
Tableau Server facilitates information sharing and team collaboration by making interactive dashboards and views accessible to authorized individuals via any of the popular web browsers available today. Reports can be directly consumed via iOS (Apple) or Android devices. Beginning with Tableau Server Version 8, authorized staff can edit existing reports or create new analysis using Tableau Server.
Users can also share metadata including joins, groupings, sets, name aliases, and other customized data by publishing Tableau Data Source files to Server. You will learn how to take advantage of these features and more in this chapter.
Managing Published Dashboards in Tableau Server
After Tableau Server is installed, those creating reports and analysis must be provided publishing rights. Staff who will be consuming reports must be granted access rights. Once you’ve created a workbook containing at least one worksheet, you can publish that information to Tableau Server. Workbooks containing many different worksheets and dashboards can be published in full, or by selecting any combination of worksheets and dashboards, you can publish a subset of what is contained in your workbook. Figure 12-1 shows the Tableau Desktop menus used for publishing to Tableau Server.

Figure 12-1: Publishing from Tableau Desktop to Server
Publishing a workbook requires three steps:
- Open the workbook you wish to publish.
- Select the Server menu and click Publish Workbook.
- Enter the server URL, your username, and your password, and click OK.
The Publish Workbook to Tableau Server dialog box will appear, as you see in Figure 12-2.
Using this menu, you define when, how, and what details will be published to the server. If your workbook’s data source is a Tableau Data Extract (.tde) file, you can also schedule regular data update using the Scheduling and Authentication button at the bottom left of Figure 12-2.
You can tell Tableau to organize published workbooks in a variety of ways:
- Project: Folders for grouping workbooks
- Name: Naming workbooks
- Description: Providing descriptive details workbooks
- Tags: User-defined tagging of workbooks
- Permissions: Controlling what users are permitted to do and who can access the workbook
- View: Hiding or sharing specific views

Figure 12-2: Publishing dialog box
Combining these different folders and views gives you the capability to provide access to your work to the appropriate level for individuals, teams, work groups, and projects. The specific purpose of each of these is explained in more detail in the material that follows.
Project
Projects are folders for organizing your reports and controlling access to those reports. Server comes with one Default project folder. Those with administrative rights can create additional projects. Figure 12-2 shows a workbook called Ch12 Fig 01 to Fig 30 being published to project Default.
Name
You can accept the name assigned to the workbook when it was created in Tableau Desktop or choose to define a new name that will appear in Tableau Server when the workbook is published. You define new workbook names using the Name field shown in Figure 12-2.
Tags
Tagging published workbooks is optional but provides another way to search for reports. These can be helpful if you publish a large number of reports. Enter each tag separated by a comma or space. If the tag you are entering contains a space, surround the tag with quotation marks (for example, “Production Benchmarks”). In my example, the Add Tags field includes a tag called tyd2.
Views to Share
The Views to Share option allows you to select specific sheets or dashboards that you wish to include in what you publish to Tableau Server. Notice that all of the worksheets in Figure 12-2 are being published. Any sheets that are not selected are hidden on Tableau Server, but these are still available within the workbook if it is downloaded from Tableau Server.
Options
Appearing at the bottom of the publishing dialog box are more optional selections that control the appearance of what is published.
Selecting the Shows Sheets as Tabs option will generate tabs when the report is published to Tableau Server—facilitating navigation between worksheets and dashboards in the published workbook. The Show Selections option allows selections you’ve made on a worksheet or dashboard to persist when the workbook is published to Server and will be displayed to users consuming the workbook.
If the data source that you are using for the report being published comes from an external database or file, you will also see a check box for the inclusion of external files; selecting that option generates a copy of the source file on Tableau Server. Custom image files used in any view will also be saved. If you have a live database or an extract file being utilized by the workbook, you should also see a button in the lower left for Scheduling and Authentication. Selecting that button allows you to set the refresh schedule for data extract sources or to change how a live database connection is authenticated on Tableau Server. Details regarding scheduling updates and authentication are covered in-depth later in this chapter.
Select the Publish button shown at the bottom of Figure 12-2 to initiate the upload to Tableau Server. Upon completion, a pop-up will appear displaying the newly published workbook.
If your Tableau Server instance is configured for multiple sites, you will also see a Select Site dialog box to define on which server site the workbook will be published. Tableau’s default is a single site. Multiple sites are partitions of the same physical server.
Edit
Those authorized to do so can optionally add, edit, or remove permissions for all users, groups, or individual users by selecting the Edit button and using the View Permissions tool, as shown in Figure 12-3. This menu allows you to see and edit permission types for different roles (viewer, interactor, editor, or custom).

Figure 12-3: Adding and editing roles and permissions
The menu window exposed in Figure 12-3 shows the role definition details. Clicking the arrow to the left of All Users will expose different user types. Clicking the blue drop-down for the Role field displays other role security and access options. In this case, you see the defined permissions for the Interactor role.
Navigating Tableau Server
When logging into Tableau Server, the user interface will vary depending on the user’s administrative rights. As you would expect, administrators have access to views for reviewing metadata related to different published workbooks, the number of views, data sources, who owns the material, and when the material was created. Normal users (interactors) have search tools that facilitate access to content. Figure 12-4 shows an administrative Site view of Content.

Figure 12-4: Site Content view
Administrators can create new projects, filter for owners, and filter before or after dates of interest. Across the top of the view, you see counts of projects, workbooks, views, and data sources. Figure 12-5 shows an interactor (non-administrative) view of the site.
The non-administrative view provides access to data that the user has been authorized to view but doesn’t include access to functions reserved for users with administrative responsibilities. You can see the difference comparing the top menus shown in Figures 12-4 and 12-5. A normal user has access to published data and data sources. The administrator gets access to Content, Users, Groups, Schedules, Tasks, Status, and Settings.
Figure 12-6 shows you one way you can navigate from a global workbook view into the Tableau Samples content.
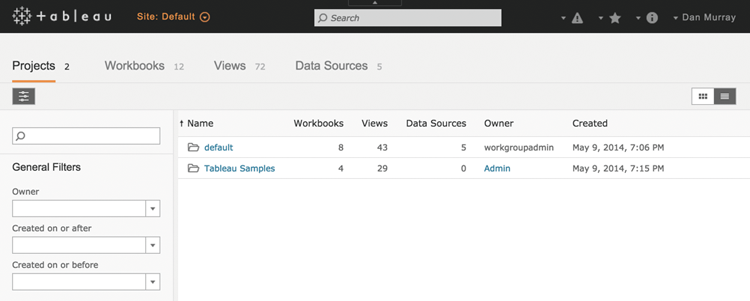
Figure 12-5: Non-administrator search view

Figure 12-6: Navigation breadcrumbs
Notice the navigation breadcrumb trail that Tableau Server provides. Figure 12-6 shows this in the upper-left side of the browser window. The initial view from Home ⇒ Tableau Samples ⇒ Finance is more detailed when the Tale of 100 Tech Start-ups workbook is selected. If you are looking for content but are unable to find it using the default navigation, there are other ways you can search by filtering. Figure 12-7 shows a filtering for “sales” workbooks.

Figure 12-7: Searching by filter
If you have a lot of content on Tableau Server, searching by using filters can get you quickly to relevant files, as you see in Figure 12-7. Filtering for “sales” while in a project folder restricts the filter search to the content of that folder.
Searching for “sales” using the global search at the top-right of the browser window will return any content in Tableau Server that contains the word “sales” in the title, caption, or other parts of the workbooks. Figure 12-8 shows the result of a global search.
If you have a lot of content on Tableau Server, using the search functions saves time, but having an organizational plan for your workbooks will help you control access and provide your users with easy ways to navigate to the content that they are interested in.

Figure 12-8: Using global search
Organizing Reports for Consumption
Publishing reports to the web is the first step in effectively sharing information on Tableau Server. As your user base grows and reports proliferate, finding reports you’re interested in requires organization. User security, group security, and site security were discussed in Chapter 11. Tableau Server provides additional ways to organize reports though projects and tags. Projects are virtual folders in which you publish workbooks and data sources. Tableau also provides built-in support for adding security to each project—allowing you to more easily manage security across multiple workbooks and data sources. Users can also tag particular workbooks or data source files with keywords. This provides you with a user-defined search term that is helpful for locating files when there are a lot of published workbooks. Defining a sensible framework for projects and tag recommendations might be helpful to your user base and provide some consistency across your enterprise. These could be defined in advance, but you may allow users to define additional tags that meet their specific needs as well.
For example, you may define projects by business unit or function—leveraging tags and adding context to each search. In a university setting, three different departments might be consuming reports:
- Admissions
- Financial Aid
- Career Services
The Admissions office might be concerned with tracking the number of students applying each year and whether they were accepted and enrolled. Financial Aid would like to track the amount of aid offered and accepted. Career Services might be interested in monitoring the progress of students that have graduated and are seeking employment. Setting up projects for each office could be advantageous because it will facilitate security while organizing the reports logically for the staff of each department.
Adding tags to each workbook could provide additional context regarding the details. Examples in a university might include the following:
- Admissions: Undergraduate admissions, “accepted vs. denied,” enrolled, declined, graduate
- Financial Aid: Aid, grants, loans, scholarships, transfer scholarships, undergraduate, graduate
- Career Services: Offers, accepted offers, max salaries, median salaries, undergraduate, graduate
Look closely at the admission tag example included in the list before “accepted vs. denied.” When tags include spaces, they must be wrapped in quotations. Notice the same tags are being used in different projects and workbooks. This allows a user to search for similar analysis performed across different departments.
For example, if the dean of a college wanted to quickly find all the reports available analyzing undergraduate students, the dean could search using the Undergraduate tag and quickly access reports related to admissions, financial aid, and career services.
Adding Tags to Workbooks
Users can add tags to any workbook they have the right to access. Figure 12-9 shows a tag being added to one workbook contained within a project.
On the left side of the window in Figure 12-9 you can see the view has been filtered for the Tableau Samples project. Selecting a workbook and clicking the tag menu option exposes existing tags that can be applied to the selected workbook. If none of the existing tags works, clicking the menu in the upper-right side of the workbook image opens a dialog box that can be used for entering a new tag. In Figure 12-9, you can see tag the tag option in the menu. Selecting that will expose another dialog box for entering the desired tag. The Change Tags dialog box includes an edit to add a tag for “sales.”

Figure 12-9: Adding a tag to a workbook
Tags can also be added directly when publishing a workbook. This option is located in the menu that is presented when you publish a workbook.
Creating a Favorite
Favorites are workbook views or dashboards that you use often and want to save for quick access. They are accessible via the star drop-down menu in the upper-right corner of the browser window or from the click box menu on the left side of the screen in the General Filters area. Figure 12-10 shows the favorite menu. It shows three different tagged workbooks including Sales, Science, and Variety. Favorites are indicated with a gold star in the view.
Figure 12-10 shows five workbooks. Three have been defined as favorites. Any workbook or worksheet can be made into a favorite from the thumbnail or list views by clicking the star below the view of the workbook. Figure 12-11 shows a list view of the workbook that has been filtered to display only favorites.
To make any workbook a favorite, select the star associated with it. This will toggle the star—coloring it yellow—and will add the item to the favorites menu in the upper right, as shown in Figure 12-10. You can also add a favorite from the thumbnail view. The most convenient way to access favorites is via the star drop-down menu that you see in the upper right of Figure 12-10. You can also filter for favorites by using the General Filters menu you see on the left side of Figure 12-11. The check mark in the Only my favorites option indicates that the view is displaying only favorited workbooks. If that view had not been filtered for favorites, you would see all of the workbooks, including ones that have not been favorited. Items not favorited are indicated with a clear star.

Figure 12-10: Favorites
By combining user and group security with projects, favorites, and tags, you can control access to sensitive information and allow users to set up their own means for facilitating easy access to the information that is most important to meet their particular needs.

Figure 12-11: List view filtered for favorites
Options for Securing Reports
Managing the security of data and reports is an important consideration. With the exception of a core-licensed server (with guest accounts enabled) all users must log in to Tableau Server before they have access to view any information. Applying permissions at the project level, you can efficiently manage access to a large number of workbooks and data sources while still providing the flexibility to alter security for a single group or user at any time. Securing reports is done using a combination of application layer and data layer controls.
- The Application Layer: Tableau Server credentials
- The Data Layer: Database security
The Application Layer
In Chapter 11, you learned about details related to managing security for users along with external security protocols that are supported by Tableau Server including External and Internal Secure Sockets Layer (SSL), Security Assertion Markup Language (SAML), and Symmetric key cryptography supported via Kerberos and smart cards. Please refer to Chapter 11 for more details on these external protocols.
Tableau Server provides application layer security through user credentials. Users can be managed in one of three ways:
- Local authentication
- Microsoft Active Director
- Trusted Ticket Authentication
Once a user has been authenticated to access the Tableau Server environment, you specify which projects, workbooks, and data sources that user is permitted to see. This is called object-level security. Tableau supports the assignment of object-level permissions for any user group or user by utilizing any of the following objects:
- Project
- Workbook
- Data source
In a top-down approach, permissions can be assigned at the project level—which may be inherited by any workbook or data source published to that project. Permissions assigned to a user group will automatically propagate to all users within the group unless a user has explicit permissions overriding the group settings. The publisher has ultimate control over whether to accept the default permissions or define customized permissions. Tableau Server comes with three standard permission levels already defined. These are called Roles and include Viewer, Interactor, and Editor. Figure 12-12 shows the interactor role permissions.
The permissions menu is accessed when your workbook is published by clicking the Add button below the View Permissions area, as shown in Figure 12-12. Other roles can be viewed by selecting the Role menu drop-down arrow. Custom roles can be defined by selecting a user or group and then choosing the Custom role option from the Role menu. You can also use the Edit button next to modify an existing role permission. This allows you to set customized permissions when assigning your custom role to a specific user or group. Tableau’s manual provides additional step-by-step instructions for defining permissions. Access the appropriate section of the manual from the Help menu in Tableau and search for “Setting Permissions.”
Defining Custom Roles
Customizing roles is done by defining the permissions for a new role type that you define or editing an existing role. Understanding the permissions that you allow is important. Depending on the selections made, you may grant the ability for people to republish reports, change filters, redesign the workbook views, build new views, export data, download the workbook, share custom views, or even set new permissions. For a detailed description of each capability, use Tableau’s Help menu and search for “Permissions.”

Figure 12-12: Add/edit user permission
Care should be taken when granting permission to prevent the unauthorized dissemination of data. The lists that follow categorize permissions by risk level. High-risk items provide the ability for the user to override permissions or disseminate data. Medium-risk items convey the ability to alter or export views. Low-risk permissions pertain to viewing and commenting capabilities.
High-Risk Permissions
- Write/Web Save
- Download/Web Save As
- Move
- Set Permissions
- Connect
Medium-Risk Permissions
- Web Edit
- View Summary Data
- View Underlying Data
- Export Image
Low-Risk Permissions
- View
- Delete
- Filter
- Add Comment
- View Comments
These risk assessments are meant to be guidelines only. If your data is highly sensitive, care should be taken to mask confidential information at the data source level to ensure that confidential information is not inappropriately exposed.
A Permission-Setting Example
Permissions can be defined so that it is possible to reuse a single workbook for groups with different access rights. For example, you may choose to group users by office. This was described in the university example mentioned earlier in this chapter (admissions, financial aid, and career services). Permissions for related projects could be set so that each office gains access only to the workbooks specifically related to their individual (office) groups.
At the same time, the university president’s office could access the workbook, but with different permission settings that permit access to all of the projects and all of the related data details.
As a result, financial aid users won’t see the admissions or career services reports. Instead, they will only see and have access to their financial aid reports. Yet the university president’s group will be able to view reports related to all three groups. Using this model, administrators can efficiently manage security for large and diverse entities.
Analyzing Existing Permissions
Because of the large number of possible permission scenarios driven by group permissions, object permissions, and roles, it is sometimes challenging to determine how to define permissions in large deployments. But, if you edit the permissions of any content type, the Permissions screen provides you with a visual and interactive visualization of the relevant permissions and how they apply to individual users. Tableau Server V9.0 improved the visualizations used for this activity considerably. Figure 12-13 shows the permissions screen for the workbook named Finance.

Figure 12-13: Permissions rules view
You can see there are three rules defined (All Users, Admins, and Interactors). All Users are able to save content, but the Interactors group has been denied this capability as denoted by the red box under Edit ⇒ Save that you see in Figure 12-13. In the Resulting Permission area below, you can see that most users are given the ability to save this workbook. One user included in the Interactors group (Mat Hughes) has been denied that ability. If you hover your mouse over the grayed box on Mat Hughes, as shown in Figure 12-14, Tableau displays the rule applied to deny access.
The group rule applied for Interactors (of which Mat is the only member) is the source of the permission denial. The highlighting in the User/Group area helps you see the specific role in play. This visual display and highlighting are helpful, especially when you have a large number of roles, groups, and users to manage.

Figure 12-14: Permissions denial details
The Data Layer
When employing a live database connection in Tableau Desktop, you must provide credentials to authenticate the database server. This data-level security is persisted on Tableau Server as well. When publishing a workbook or data source, you must choose what type of authentication you’ll associate with your live connection.
It’s important to understand the difference between application layer and data layer security. When a user logs into Tableau Server, the user is authenticated at the application layer but not the data layer. When accessing any report that utilizes a live connection, the user must also be authenticated by that data source. How the user is authenticated is predicated upon what settings you select when publishing the workbook or data source. Your choices boil down to four options:
- Prompting the user to enter credentials
- Using embedded credentials
- Using a Server Run-As account
- Using SQL Server Impersonation (available for SQL Server only)
Embedded Credentials
Tableau also offers administrators the option to permit users to save their data source credentials across multiple visits and browsers. This is enabled through the Embedded Credentials settings option in the Server ⇒ Setting ⇒ General screen in Tableau Server. Figure 12-15 shows the General settings screen with the appropriate selection checked. You also have the option to embed the connection username and password for the database from within Tableau Desktop.

Figure 12-15: Enabling embedded credentials
By using this option, all users who utilize the connection will have the same level of access as the publisher of the workbook. This is a convenient feature for users—relieving them from having to log in a second time. However, enabling embedded credentials removes the ability to manage data-level access on a per-user basis.
Server Run As Account Via Windows Active Directory
Tableau Server runs in Windows Server environments. Therefore, Tableau Server installations utilize an Active Directory service account to run. A beneficial consequence of this fact is that Windows Active Directory (AD) can be used to eliminate redundant logins for Tableau Server users.
When a report is viewed on Tableau Server using a data connection employing this method, the Server Run As Account will be used to authenticate against the database. Your database administrator will need to ensure the Server Run As Account has the proper access to connect to and query the tables and views used in your connection. Use Tableau Server’s online manual and search for Run As User to view the setup details for this feature.
SQL Server Impersonation
An option available only when connecting to a SQL Server database, impersonation is another way of eliminating the need for users to log in twice while still preserving the ability to manage data level access on a per-user basis. This also allows the SQL Server database administrator to control security policy from the database and propagate those policies to Tableau Server.
To use SQL Server Impersonation, each Tableau Server user will need individual accounts on SQL Server with credentials matching those on Tableau Server. For instance, if you have chosen to use Active Directory to manage your Tableau Server users, you must grant the same Active Directory accounts access to SQL Server. The user either will need to be the Server Run As account or have their credentials embedded in the workbook during the publishing step by selecting the Impersonate Via Embedded Password option in the authentication menu.
When a user views a workbook that has implemented SQL Server Impersonation, they are authenticated using the Server Run As account or via embedded SQL Server credentials. This account then impersonates the user connecting and accesses the database with their defined permissions. Search Tableau Server’s online manual for SQL Server Impersonation for more details regarding setup and configuration.
Tableau Server provides a variety of ways to manage security. There are external security protocols that Tableau supports as well, including Security Assertion Markup Language (SAML) and Symmetric Key Cryptography (Kerberos). To find out more about these protocols, go to the Help menu to access Tableau’s online manual.
The next section covers how Tableau Server provides more flexibility and efficiency through the Data Server.
Improve Efficiency with the Data Server
The Tableau Data Server provides a way to manage data sources that have been published to Tableau Server. These published sources can include direct connections to a database or Tableau Data Extract files. Authorized staff can set permissions associated with the connections and also set refresh schedules for data extract files. The metadata associated these published sources becomes available to any workbook that uses the data source. Metadata includes:
- Custom calculated fields
- Ad hoc groupings
- Ad hoc hierarchies
- Field name aliases
- Custom fonts and colors
The Data Server is efficient because it provides a flexible way to spread heavy workloads by enabling Tableau Server to absorb some of the demand normally handled by the primary database server.
While using data extract files is not a requirement, data extract files frequently perform better than the host database. The Data Server also saves time—enabling the work of a single individual to be shared by many. Data sources published to Tableau Server can be accessed by authorized Tableau Desktop users to create new analysis.
Next, you’ll learn how to publish a data source to Tableau Server and then use the Data Server to centrally host and share files, schedule automatic updates, and leverage incremental extract refreshing for near real-time data.
Publishing a Data Source
Publishing a data source file to the data server is done from Tableau Desktop by opening the workbook containing the data source you wish to make available for others to use. From the workbook, access the menu for publishing the data source by right-clicking in the Data window containing the data source in the upper-left section of the worksheet, as shown in Figure 12-16.
After right-clicking and selecting Publish to Server, a server login dialog box appears. You will be required to enter the server URL, your username, and password to access the server. If you have a multiple site deployment, you’ll also need to enter the site you want to publish to as well. Once the server login is completed, a dialog box will appear, as you see in Figure 12-17.

Figure 12-16: Publishing to the data server

Figure 12-17: Dialog box for publishing a data source
Define the parameters for publishing the data source by selecting the project, a data source name, the authentication method, tags, how and when you want server to refresh the extract, and finally what permissions you wish to assign to the extract. Most of these topics have already been covered in Chapter 11 or in earlier sections of this chapter. In the next two sections, you will learn more about the options for updating data source files and how to use incremental updates.
Manual vs. Automatic Updates
One potential benefit of using an extract—a portable copy of your original data set—can also be a drawback. The extract may not reflect the latest changes occurring in the data source until the extract is refreshed. Tableau provides two different methods for updating extract files—manual and automatic updates.
Manual Updates Using Tableau Desktop
Manually updating data extracts can be done via the data menu or by right-clicking the data menu. Follow these steps to refresh the data source file:
- Start Tableau Desktop if it is not already running.
- Open the workbook containing the extract you wish to refresh.
- Select the data menu and refresh all extracts (or add data from file to append new data).
- A dialog box will appear displaying the extracts that are available to update.
- Click the Refresh button to update the extract files.
If your workbook contains multiple extract files, they will all be updated using this method. You can also update individual extract files in the workbook by pointing at the data source in the data window, right-clicking, and then selecting Extract and then Refresh.
This manual process is one way you can append data from a separate source file or database—assuming the separate source contains the same fields as the original data source. To do so, follow the same steps as described, but in the last step choose Add Data From File instead of Refresh. In Chapter 13, you’ll see how Tableau Server’s command-line tools can be used to automate manual processes like this.
Automatic Updates Using Tableau Server
If you have many different data sources and workbooks using data source files published to Server, manually updating large numbers of files would be impractical. Tableau Server comes with a predefined update schedule and allows you to create your own custom update schedules.
To schedule updates, you’ll need to first publish your extract to Tableau Server directly using Data Server or indirectly by publishing the workbook that uses an extract as its data source. During the publishing process, you have the option to select a refresh schedule to have Tableau Server automatically update the extract.
Tableau Server includes predefined schedules or your server administrator can define custom schedules set to recur at a monthly, weekly, daily, or hourly time interval. Schedules can also be defined to allow jobs to run concurrently or sequentially, with an option to change the priority of the schedule relative to others that may occur at the same time. Figure 12-17, presented earlier, shows the schedule option in the Refresh Extract section. The drop-down box next to Full contains the available options. You can see in the example that the extract will be refreshed every Saturday at 11:00 p.m.
Defining a Custom Refresh Schedule
For those users granted administrative rights, you can create custom refresh schedules from the Tableau Server admin menu. You can see these schedules in Figure 12-18.

Figure 12-18: Admin schedule menu
The admin/schedules menu provides a list of what is available and summary information regarding the available schedules—their type, scope, the number of times run, how they run, as well as the next scheduled runtime. To define a new custom schedule, you must select the New menu option you can see above the check boxes in Figure 12-18. Selecting that exposes the custom schedule dialog box you see in Figure 12-19.

Figure 12-19: Creating a custom schedule
Give the schedule a clearly descriptive name and fill in the highlighted blanks. Then click the Create Schedule button. This makes the schedule available for use. As you can see, there is plenty of flexibility for controlling when data extracts are refreshed. In Figure 12-19, you see the minimum refresh cycle that Tableau provides is every 15 minutes.
Incremental Updates
What if you have a large or very active data source? These files can take time to update. You can reduce the time required for extracting data by using incremental updates. Typically, when refreshing extracts, the current rows are truncated and completely replaced by a new copy of the dataset. In contrast, incremental refreshes allow you to specify a date, a date-time, or an integer value field contained in your data, to specifically identify new records in the data source.
When an incremental refresh is used, Tableau will check for the maximum value of the field in your extract and compare that value to each row in the original data source—importing only the rows with a later or higher value. This approach will reduce the time required to update your extract. The larger the source file, the more significant will be your potential time savings.
You define this option in Tableau Desktop when you build the extract definition by selecting the incremental refresh option and then selecting the field that you want to use to identify the new data. The field options you see in Figure 12-20 include the dates, key records, and other fields.

Figure 12-20: Enabling incremental updates
If you choose to use incremental refreshes, you are not excluding the option for a full refresh. On the contrary, you are only allowing for the additional choice of an incremental refresh when performing either a manual or automatic update. It is advisable to run full refreshes of the data periodically because the incremental refresh may not capture all of the changes in the source data set if your data administrator allows users to modify old (previously refreshed) data.
Consuming Information in Tableau Server
As your Tableau deployment matures, you may have hundreds of reports and data sources being published, updated, and consumed. Facilitating access to information and encouraging collaboration is of primary importance and the principal value business information systems provide. Tableau Server provides tools for finding information, commenting on reports, sharing discoveries, or customizing views, Tableau Server even allows information consumers to create completely new visualizations from within Tableau Server.
Finding Information
Tableau’s security structure provides an initial level of categorization, but Tableau Server also allows information consumers to customize access further through tagging, marking favorites, and even altering existing workbooks without the need for a desktop license.
Tagging
You learned about tagging from the publishing perspective earlier in this chapter. Any user with security to access output published on Tableau Server can tag projects, workbooks, views, and data sources. While users can add and remove their own tags, administrators and publishers can see all of the tags applied to workbooks. Tags are applied from the content menus for projects, workbooks, views, or data sources. To apply the tag, select the Tag menu option at the top and either select an existing tag or enter a new tag. Figure 12-21 shows a tag being applied from within the content thumbnail view for workbooks.

Figure 12-21: Tagging workbooks
The thumbnail workbook view checked in Figure 12-21 will have the DGMfav tag applied to it. This tag provides a means for filtering based on that tag. Note that the new tag won’t appear in the Tag menu until the view is refreshed in your browser.
Removing Tags
If you want to delete a tag associated with a project, workbook, view, or data source, the process is similar to adding or changing a tag. In Figure 12-22, you see a list view of the same project folder and workbook as the last example. This time it’s being presented using a list view.

Figure 12-22: Deleting a tag
To delete a tag from the list view, select Actions ⇒ Tag ⇒ Change Tags, and then delete the tag. In Figure 12-22, you see the Stockinfo tag being deleted. Of course you could add more tags from this pop-up if desired. Tags are a great way for users to define search keys that specifically meet their needs without having to involve technical resources.
Favorites
Next to every workbook or view listing in Tableau Server is a star icon that allows your users to create a personal favorites list. If the icon is colored yellow, that item is a favorite. Grayed items are not. Clicking the star will add it to the favorites list. Clicking a second time toggles it off the list. The Favorites list is a bookmarking mechanism that provides fast access to your most frequently used items. Refer to Figures 12-10 and 12-11, presented earlier in the “Creating a Favorite” section of this chapter to review the details regarding how favorites are added.
Sharing Comments and Views
Comments can be added to any server view if the user has the proper permission and assuming the Post Comment save option has not been disabled through an embedded view. Comments are found at the bottom of the view in Server, giving users the opportunity to share ideas and ask questions. Figure 12-23 shows a comment being added to a workbook view.

Figure 12-23: Adding a comment or question
Views can be shared with anyone via the Share menu found at the top of the page, as you see in Figure 12-24.

Figure 12-24: Share or embed a view.
To share the view in Figure 12-24, copy the Email link. If you want to embed the view in a blog or website, copy the Embed link and paste it into your blog or website. Both of the options allow you to optionally set the pixel height and width of the view and to define whether or not the toolbar or tabs are displayed.
Customizing Views
Users can make mark selections, apply filters or highlights, and then save those settings in a customized view. Figure 12-25 shows a customized view of a workbook filtered to show a particular industry segment.
Saving any customized view requires three steps:
- Click the Remember my changes link.
- Provide a name for the customized view.
- Click the Remember button to save the view.
Your customized view is saved, and you are redirected to a unique URL that is generated for the view. The Remember My Changes link is also changed to the name of your customized view, as you see in Figure 12-25. If you click the link, you’ll see a list of all the customized views you have saved along with a link to the original view published. To rename or delete any of your customized views, click the Manage Custom Views link at the bottom of the listing.

Figure 12-25: Saving a custom view
Other users accessing the view on their own will still be presented the original view as first published unless they use the unique URL for your customized view. Customized views provide a good way for users to save frequently used filter combinations without the need to rely on the publisher.
A significant new feature that arrived with the release of Tableau Version 8 is web authoring. This goes beyond saving customized views by allowing users that lack a Tableau Desktop license to alter and create totally new visualizations within Tableau Server.
Authoring and Editing Reports via Server
Customized views work well for making small changes to existing files or parameters, but more robust editing is sometimes necessary. Tableau Server’s in-browser editing functionality provides a simplified version of the Desktop experience. It allows users to edit existing workbooks, create new visualizations, and then save the work to Tableau Server. This capability is great for middle-tier users who don’t typically need all of the features that Tableau Desktop offers but want the ability to probe data in ways that were not anticipated by the workbook creator. Web-Table authoring (see Chapter 9) gives these users the ability to self-serve information and analysis from any device capable of accessing Tableau Server via a web session without the need to install any additional software.
What Is Required to Author Reports on the Web?
In Chapter 9, you learned about mobile access to Tableau Server reports as well as mobile report authoring. You observed that a personal computer’s web-based interaction is very similar to the tablet-based interaction. This is also true when considering the web/tablet authoring functionality. This functionality, like all web-based interfaces to Tableau, is exclusively a function of the Tableau Server environment and cannot be done utilizing only the Desktop or Reader products. To author on the web you need the following:
- A site with web authoring enabled
- A live web connection
- A Tableau Server Interactor license
- A standard web browser with a live web connection
- A pre-existing workbook that must be published to Tableau Server
- Appropriate permissions to be able to Web Edit
If you want to author via a tablet, you must download Tableau’s iPad application from Apple, or the Android application from Google Play if you plan to use an Android tablet. While these elements are essential, they are not sufficient. The server permission for Web Edit must be allowed, as you see in Figure 12-26. This permission is also required to author via a desktop or laptop computer via the Internet.

Figure 12-26: Permitting web editing
As with all permissions on Tableau Server, web editing can be configured at multiple levels—user, group, workbook, project, or site. Tableau Server users can also access saved data sources via the Content tab and create a new workbook using that data source. One Desktop license is required to publish the original report template or data extract file to the server, but any number of Tableau Server Interactor licensees can edit the report or create new reports from published data sources. With the release of V9, Tableau has continued to add capabilities to web authoring—most notably, the ability to create formulas has been added along with the Show Me facility. Tableau does not impose additional licensing fees to access the Web/Tablet authoring tool.
Server Design and Usage Considerations Related to Web and Tablet Authoring
Tableau’s web-tablet authoring system is largely a client-side functionality provided through an HTML5 layer. This means that the Web/Tablet authoring system will have limited impact on the majority of Tableau Server processes.
The Tableau Server administrator should be aware that users editing views via this method will generate activity on the server’s VizQL process. And, if the workbook being edited is based on a data server extract-driven data source, those processes will also experience increased loads. This impact is identical to the effective impact of adding additional Tableau Desktop interactions—presuming a server-mediated data connection.
Should web/tablet authoring result in a high number of workbook saves or creates via the server Save As dialog box, Tableau Server will experience additional demand placed on its repository and storage systems in a manner similar to the load that would be expected via Tableau Desktop utilization.
These additional loads are a good thing. They mean that your user base is engaged and actively using the system.
Differences Between Desktop and Web or Tablet Authoring
The experienced Tableau Desktop user will immediately notice that the web-tablet editing interface closely mirrors the familiar desktop environment. Editing through the web or tablet is very similar to the Desktop tool, though it is simplified and limited in a few ways. This section will detail the functional differences between the two authoring experiences. While limitations in the web-tablet authoring environment are highlighted, you should not interpret this section as a negative critique. Web authoring is a significant innovation that will provide benefit to the majority of your user base.
The goal is to highlight the differences so that you are aware of what can be done via the web versus what must be done using the Desktop application. The Web-Tablet authoring environment is designed to provide a simplified version of the Desktop experience. It is not intended to replace the Desktop application.
Drop Areas for Rows and Columns but No Show Me! Drop Area
Many of the standard desktop options and layouts are available within the web-tablet authoring interface. The left side re-creates the data window, including any data source(s), measures, and dimensions. The Column and Row shelves, along with the Pages, Filters, and Marks cards, also exist in their standard positions. Users can create visualizations in the same drag/drop manner that is fundamental to Tableau’s Desktop authoring experience. One difference is that all fields must be dragged to the shelves and that the in-view drop areas for rows and columns do not exist. And, while Show Me is available, it can’t be moved around the screen. It is available only from the menu at the top of the view. Figure 12-27 shows the web editing interface.
You can see that the Data and Analytics windows, along with dimensions and measures, are available on the left just like Desktop. Pages, Filters, and the Marks cards are all there as well, along with the Columns and Rows shelves. Anything that would appear on the Data window in Desktop should also appear in the Data window within the web editing environment. The Analytics window does not include all of the tools available in Desktop. Figure 12-28 shows a side-by-side comparison.
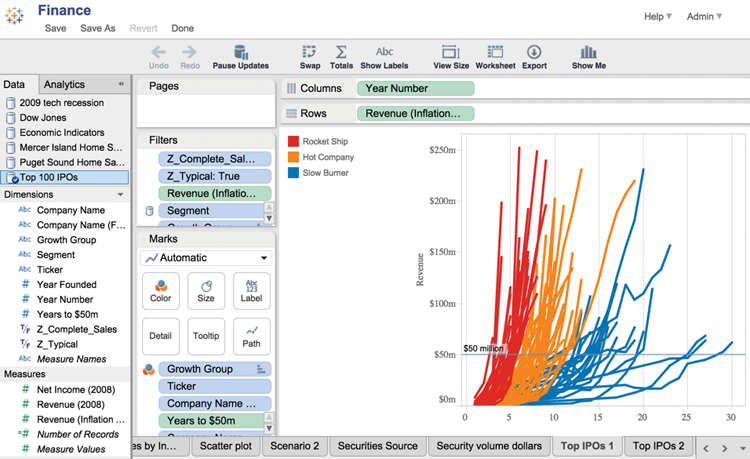
Figure 12-27: The web-tablet authoring view

Figure 12-28: Analytics pane in Desktop and Web
You can see that the web editing environment does not include forecast modeling and all of the Custom reference line and band options are not available in the web environment.
The menu across the top of Figure 12-27 does not include many of the desktop menu and icon bar options available in Tableau Desktop. But what is available provides a good set of tools for creating new views and analysis using published workbooks and data sources.
No Dashboard Support
There is no dashboard display in the server authoring environment. In fact, dashboard editing is not interpreted in the web-tablet editing experience. Any workbook that contains dashboards will display those views broken into their component parts (even if hidden) versus being displayed as the combined entity you see in the desktop application.
Data Source Manipulations Are Not Supported
All data sources needed for analysis must be included at the time of publishing from Tableau Desktop. The web authoring system does not allow for any manipulation of the metadata layer. You can’t add new data sources, remove unused data sources, create calculated fields or parameters, change default field properties, or edit relationships between data sources. In general, the web authoring environment doesn’t support metadata management. These capabilities exist exclusively in the desktop tool.
It is worth noting that as of Tableau Server V9.0, web users are now able to create calculated fields during web authoring.
Context Menu Functionality
Some, but not all, functionality accessed through right-clicking in Tableau Desktop is supported in web authoring either via right-clicking objects or clicking their menu-based controls. Field-specific controls are shown in Figure 12-29.
The dimension-specific control in Figure 12-29 was exposed by selecting the small drop-down arrow in the segment dimension pill. Similar measure-specific controls can be exposed by clicking the drop-down arrow in the measures pill shown in Figure 12-30.
Note that you can also invoke Quick Table Calculations from the same menu.

Figure 12-29: Field-specific controls
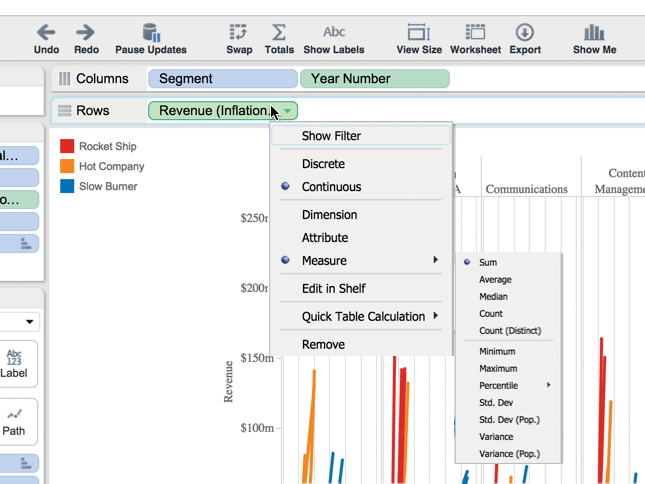
Figure 12-30: Measure-specific controls
Quick Filters Only: No Complex Filtering
Desktop users accustomed to creating “complex” filters like “Top 10” or utilizing specific conditions, will notice that these filters will persist in the web authoring session. However, web editors can’t add new versions of these complex filters. Web editors are able to add quick filters to views, and the full suite of quick filter types is available. In addition, complex filter behavior can be accomplished in web authoring mode by creating calculated fields that accomplish the desired filtering.
Cell Sizing Is Exclusively Menu-Based
Cell sizing is controlled exclusively through the cell size menus; users can’t drag elements of the visualization to resize those items, nor can they drag to resize the sheet as a whole. And web editors cannot drag to control the “fit” of the view within the design space. Figure 12-31 displays the web tools that are available for fitting and sizing the web view.

Figure 12-31: Web fit and cell-sizing controls
Even though Desktop dragging to resize elements isn’t available in the web environment, the View Size ⇒ Cell Size menu provides this facility.
Sorting Is Only Available Through Quick Sorts
Unlike Tableau Desktop, authors cannot set sorts based on specific fields, default sorts, or pre-sort information in a robust manner. Sorting is exclusively allowed through the in-visualization quick sorts that are omnipresent on headers in all Tableau visualizations.
Limited Control of Color, Size, Text, and Tooltips
Tableau Desktop allows nearly infinite control of color palettes, size ranges, shapes, and tooltip content. The web-tablet environment provides none of these fine-grain controls.
Adding Calculated Values in Tableau Server
The capability to create calculated values in Tableau Server was added in Version 9. Similar to Tableau Desktop, ad hoc calculations can be added by typing formulas into the Rows and Columns shelves or on the Marks card. Figure 12-32 shows an ad hoc calculation being added to the Columns shelf.

Figure 12-32: Adding an ad hoc calculation
Complete the calculation value just as you would on Desktop by hitting the enter key on your keyboard. You can also add a new field to the view by dragging the pill for the new calculated value to the Data shelf. And you can give that field a name by clicking the new field on the Data shelf and editing the name in the calculation dialog box you see in Figure 12-33.
You can also create a new calculation in Tableau Server by using the drop-down arrow you see at the top right of the data window in Figure 12-34.

Figure 12-33: Naming the new calculated value

Figure 12-34: Adding a calculation from the data window
Creating new fields in Tableau Server through calculated values is a useful capability. It enables users without access to Tableau Desktop to do deeper analysis of published data sources and workbooks. You can’t do everything that you can do with calculations on Server (number formatting is possible only on Desktop for now). But this new capability makes Server a more full-featured environment for creating new views.
Saving and Exporting via the Web-Tablet Environment
Tableau Server provides a number of ways to export or save visual images, data, and workbook views.
Export
All of the exporting features available to Desktop users are available on Server as well. Images, data, crosstabs, and PDF export formats are supported. You access these options from the Export menu shown in Figure 12-35.
These same options are available within Tableau’s tablet applications as well.

Figure 12-35: Server export functions
Save and Save As
Recall from the beginning of this chapter in Figure 12-3, the web/edit permission must be Allow for users to enter Server web editing mode. Similarly, the ability to overwrite an existing workbook is also permission-based. Tableau Server does not save a copy of the original workbook by default. Saving on Server is equivalent to republishing on Tableau Desktop. The Save As dialog box provides the ability to republish the workbook under a new name or into another project.
It is possible to set permissions these functions separately. In this way, you can give web authors Save As permissions without the Save facility so that they can save a version of the file for their personal consumption on Tableau Server. This prevents web users from accidentally over-writing the original content.
Recommendations for Implementing Web/Tablet Authoring
Tableau Server has not been designed to entirely replace the Desktop tool. Enterprises should view web-tablet authoring as a supplementary tool that enables a previously under-served cohort group access to Tableau’s ad hoc analysis and reporting capabilities.
Paired with relevant data source access and training, Server facilitates self-service business analysis in a controlled environment—providing users with the ability to ask questions that were not anticipated within the original design of the report. The following are key points to remember when designing reports that will be used as starting points for web-tablet authors:
- Give worksheets logical name(s) that will not be obscured by the standard Desktop practice of hiding sheets that have been added to dashboards.
- Design template workbooks and template data sources that can be readily approached by non-technical users who may not have data analysis experts or experience with Tableau Desktop.
- Provide transparent information about data sources including refresh dates, sources, assumptions, and contact information for the original publisher.
- Create a specific Sandbox project/area where new users can save work and gain confidence.
Sharing Connections, Data Models, and Data Extracts
Tableau’s data server lowers access barriers while providing data governance controls. Database administrators can define data connections once, publish them to the data server, and manage access by applying Tableau’s object level. Consequently, data analysts using Tableau require no knowledge of the underlying tables, joins, or related criteria driving the connections.
Offering a Common Data Library
It’s common for organizations to manage and use a variety of data sources. Transactional data may live in one database while historical data is maintained in a completely different database. Business users may maintain their own spreadsheets of forecasts and budgets. While Tableau can easily connect to each of these disparate data sources, Data Server offers the capability to host these connections in a central place. This reduces the potential for data misuse because Tableau users can simply connect to Tableau Server and the data they need access to, regardless of source system. Data Server simply acts as a proxy to databases while also serving as a host for items such as Excel and Access files, or even data extracts.
Sharing Data Models
Earlier in the chapter, in the section related to the Tableau Data Server, you learned how data sources can be published and used by many different users. The related metadata that comes with the shared data sources allows data administrators to manage inconsistencies through the following:
- Consistent field name aliasing
- Consistent field grouping
- Consistent application of field hierarchies
This permits the organization to tap into the best subject matter experts to create and validate calculations and publish the resulting data models for your entire organization to benefit from. These capabilities can reduce variations in how business rules are interpreted and applied, while giving analysts the ability to do their own ad hoc analysis by adding their own customizations on a per-workbook basis.
Inheritance of Updates
Once a data source has been published to Data Server, workbooks using the connection automatically inherit any future updates to the data source. This simplifies the process of data source maintenance while reducing the risk of outdated business rules persisting in production when an underlying change has been made.
Embedding Tableau Reports Securely on the Web
If your organization is accustomed to consuming information via a specific web portal, Tableau provides a variety of ways to embed your reports as interactive dashboards or static images—all while persisting the same licensing and security framework available to you on server.
When to Embed a Dashboard
When does it make sense to embed a dashboard rather than simply having your users access it directly from Tableau Server? If your user base is already familiar with a particular web portal, it makes sense to use that website as a repository for interactive Tableau visualizations and dashboards. In addition, there may be advantages to using existing security options that may already be defined on the web portal.
Going to Your Users
It can be frustrating for less technical users if they are asked to remember many different logins and websites to access information they need to do their job. Many people don’t enjoy the accelerating change fostered by advances in technology. Learning new tools reduces efficiency during the learning cycle.
By embedding Tableau into an existing web portal that your users are familiar with, you provide them with the benefits Tableau has to offer while minimizing the change they have to absorb.
When Your Reports Are a Piece of a Larger SaaS Offering
If you offer a service to your clients, you want to control the branding on the products they are using. Instead of providing them access to Tableau Server directly, you can embed the content (workbooks, dashboards, visualization) in a web portal that carries your unique branding. Planned properly, this access method provides seamless integration. Your customers don’t need to know the underlying technology is Tableau Server. Embedding workbooks into a website reporting portal provides a way for you to present a single cohesive product to your end users.
Providing a More Robust Environment
What happens when, over the years, multiple reporting environments have been created as the result of different initiatives spread over many teams? One part of the company may rely on Business Object reports that were created a decade ago. Other teams may depend on SSRS reports to make day-to-day decisions. Tableau can be a vehicle for consolidating disparate tools into a single, cohesive system.
What is worse than bad business intelligence? Good business intelligence that nobody can find. By creating a single seamless environment for your users, they no longer have to track down and find the reports that may be out there. The probability of redundancy is reduced.
While getting to this happy goal may require considerable effort, Tableau’s ability to connect to many different data sources reduces the time and complexity required to bring your data into a single integrated system.
How to Embed a Dashboard
Embedding dashboards usually boils down to one of these methods:
- Using Tableau’s JavaScript code
- Using the dashboard’s URL in an iFrame or Image tag
- Writing your own code using Tableau’s JavaScript API
No matter which method you choose, you can control your embedded view through the use of Passed Parameters. We’ll explore all three methods next while also diving into the details of the parameters you can use.
Note all the embedded solutions in this section require users to log in via the embedded view as they normally would when accessing Tableau Server directly. You’ll learn more about providing a single sign-on experience for your users later in this chapter in the section “Tips and Tricks for Embedding Dashboards.”
Using Tableau’s JavaScript Code
The easiest way to embed a dashboard in another web page is to use the JavaScript code provided by Tableau in its Share button. With the options for setting the width and height of your dashboard and the ability to turn on/off the toolbar and tabs, this provides a mechanism for quickly embedding your dashboards into another web page. The following is a quick example of the resulting code:
<script type=”text/javascript”
src=”https://yourtableauserver.com/javascripts/
api/viz_v1.js”></script><div class=”tableauPlaceholder” style=
“width:979px; height:662px;”><object class
=”tableauViz” width=”979” height=”662”
style=”display:none;”><param name=”host_url”
value=”https%3A%2F%2Fyourtableauserver.com%2F” /><param name=
“site_root” value=”/t/YourSite”
/><param name=”name”
value=”YourWorkbook/YourView” /><param name=”tabs”
value=”yes” /><param name=”toolbar” value=”yes” /></object></div>Notice the use of <param> tags to pass specific values to Tableau Server. Through the use of these tags, it is possible to pass additional parameters such as an initial filter. For example, the following entry will initially filter the embedded view by restricting the Region dimension to West only:
<param name=”filter” value=”Region=West”/>The name and site root parameters are the only ones required when embedding a view.
Using an iFrame or Image Tag
Another option is to use the URL for a dashboard or a view in an iFrame or image tag. Additional parameters can still be passed but must be included at the end of the URL. The embed parameter is required, but all others are optional. An example of an embedded view using an iFrame follows this paragraph. The dashboard is once again filtered to the West region only, while also restricting to the date June 1, 2012.
<iframe src=”https://yourtableauserver.com
/t/views/MyWorkbook/MyDashboard?:
embed=yes&Region=West&Date=
2012–06–01” width=”800” height=”600”></iframe>
Note the required embed parameter is set first. A value of Yes hides Tableau’s default navigation options and comments section below the view while also moving the toolbar and share options below the view.
Writing Your Own JavaScript API
You can also write your own code by leveraging Tableau’s JavaScript API. This is often the preferred choice by web developers looking to embed Tableau views into their existing web applications as it offers a deeper level of control.
Tableau provides developers with the ability to interact with embedded views in real time. By listening for events generated by Tableau views, developers can capture actions performed by a user and respond to them in rich, interactive ways. For instance, developers can respond to a user selecting marks on an embedded view and trigger a response in their web application. Developers can also interactively set filters and select marks within an embedded view in real time—no longer limited to simply setting initial values prior to a view loading. The best part is that each of these API functions is enacted as they would be if the user had performed the action in the view itself, meaning no page refreshes occur. The result is a completely seamless experience between your application and the embedded Tableau reports.
See Chapter 13 for more details on using Tableau Server’s APIs.
Further Control Using Passed Parameters
Whether you choose to use an iFrame or JavaScript, you can pass additional parameters to the view. Search Tableau’s website to find a complete list of supported parameters.
Tips and Tricks for Embedding Dashboards
Tableau has streamlined the embedding process over the last two years. The tips and tricks that follow provide some ideas.
Filter Formats for Dimensions, Measures, and Dates/Times
When passing dimension filter parameters, simply list each value in a comma-separated list. To filter on multiple dimensions, separate each with an ampersand. The general form is:
Field=Value1,Value2,Value3&Field2=Value1,Value2You can filter on measures in the same manner by passing explicit values. However, Tableau Server does not support filtering by a range of values or using greater than or less than logic.
To filter on a date or date/time field, use the following form:
DateField=yyyy-mm-dd hh:mm:ssWhen filtering a date/time field, the time component is considered optional.
Know Your Character Limits
Theoretically, there is no limit to the number of parameter values you may pass to an embedded view. However, you may ultimately run into a URL length restriction imposed by the end user’s browser.
While HTTP protocol does not impose a cap on URL length and many modern browsers can handle URLs with up to 80,000 characters, Internet Explorer 8 and 9 have a maximum character limit of only 2,083 characters.
As a result, you should strive to keep your URLs under this limit to ensure compatibility. Keep in mind the complete URL—not just the parameters and corresponding values—are included in this length.
Using Trusted Ticket Authentication as an Alternative Single Sign-on Method
When an embedded view is accessed, the same authentication mode enabled on Tableau Server is used to verify the user’s identity. For instance, if your server is configured to use local authentication, your users will be required to log in via a form provided by the embedded view. This can be cumbersome if the users have already authenticated in the web application. To work around this, Tableau provides a couple of options for single sign-on authentication, a process where your user is authenticated by your web application and is not required to further authenticate themselves by any embedded Tableau views.
If your server is configured to use Active Directory and SSPI, you can enable SSPI on your web server as a single sign-on solution given the user is in your Active Directory and is a licensed Tableau Server user. In all other situations, you will need to use Trusted Ticket Authentication as an alternative single sign-on method.
When using Trusted Ticket Authentication, the web server assumes all responsibility for authenticating users. Before embedding the view, the web server passes two POST parameters to Tableau Server:
- Username (must match a licensed Tableau server user)
Client_ip
The web server will receive a response in the form of a unique_id, which is used in the embedded view’s URL, as shown in this form:
https://yourtableauserver.com/
trusted/unique_id/t/views/MyWorkbook/MyDashboard?:embed=yes
If you are using JavaScript, the ticket parameter can be used:
<param name=”ticket” value=”unique_id”/>Once a unique_id has been issued, it must be redeemed within 15 seconds from a machine matching the client__ip specified or it is considered no longer valid. When Tableau Server receives the request, the user is logged in as they would be if using forms authentication and the trusted ticket URL is resolved to that of a standard request.
Before a web server can make a Trusted Ticket Authentication request, it must first be “white listed” on Tableau Server. This can be accomplished using the following TabAdmin command, where xxx.xxx.xxx.xxx represents IP addresses for any trusted web servers:
tabadmin set wgserver.trusted_hosts “xxx.xxx.xxx.xxx, xxx.xxx.xxx.xxx”Using Subscriptions to Deliver Reports via E-mail
Do you have dashboards or views that you want to look at every day? Tableau Server can send you notification e-mails with links to the desired contents using a defined schedule. Tableau enables this through subscriptions. Subscriptions are not enabled in Tableau Server by default. The feature must be enabled by an administrator. See Chapter 11 for details. In this chapter, you learn how to subscribe to views.
Creating Subscription Schedules
Once subscriptions are activated, you will be able to subscribe to your favorite views and receive regular e-mails. Figure 12-36 shows a list of schedules for Tableau Server.
The schedule list includes one custom schedule (Dan’s Hourly Update) that I added to Tableau Server. Notice that Tableau provides a useful list of schedules for different time increments. Note that these schedules also control Tableau Data Extract runs. Provided you have the access rights, you can view subscription run history. Figure 12-37 shows what a subscription history looks like.
Two subscriptions runs were completed: one containing a single view and another containing every worksheet within the source workbook.

Figure 12-36: Schedules

Figure 12-37: Subscription run history
Subscribing to a View
Creating a subscription requires a few steps:
- Navigate to the view you wish to subscribe to.
- Click the mail icon in the upper left of your browser window.
- Complete the Subscribe dialog box.
Figure 12-38 shows the Subscribe dialog box.

Figure 12-38: Creating a subscription
My e-mail address was added automatically by Server. This is defined by the administrator. Enter the subject as you want it to appear in your e-mail header, select the appropriate schedule from the drop-down list, and then decide if you want to receive a single view or all of the views available in the workbook. At the scheduled time, Tableau Server generates an e-mail containing an image of the view. Figure 12-39 shows the e-mail message generated by the subscription.
The resulting e-mail contains a dashboard view. Clicking that e-mail view will open the view in Tableau Server presuming you have access to the Internet. You can even access the subscription from a cell phone or tablet computer. Notice the “Manage my subscription settings” link at the bottom of Figure 12-39. This is another optional setting that your administrator must enable. Adding this to the subscription details provides access to the Settings screen where the Subscriptions checkbox is located. This enables the user to change the subscription settings.

Figure 12-39: A subscription e-mail
Subscriptions can be a convenient way to receive workbook views that are frequently used. In the next chapter, you learn about more sophisticated ways you can automate Tableau Server, such as through APIs and Tableau’s command-line tools.