
Chapter 8. Templates
This chapter and the next contain very specific templates that you can use directly in your work to help you advance your technology projects. The two primary vehicles for this are spreadsheets and slide decks.
Here you’ll get the following collection of eight practical tools that you can modify or use out of the box. They’re reusable rubrics to help you be sure you’ve covered the key aspects of strategy proposals and help you bring all of your technology project ideas into sharp focus. With these, you can usher the considerable raw material you’ve generated so far from the developmental concept realm into the material realm:
-
One-Slider
-
Use Case Map
-
Priority Map
-
Directional Costing
-
Technology Radar
-
Build/Buy/Partner
-
Due Diligence
-
Architecture Definition
These represent tools of my own device that I’ve used effectively. It’s not a project management collection; there are plenty of tools for that elsewhere. They’re most useful in the early stages of your project when you are trying to figure out what you’re doing, and what you want to propose to executives or share with the broader team.
One-Slider
Challenge: You need to pull together the huge and diverse volumes of analysis work into a simple summary that you can use to inform teams and executives of the strategy.
Solution: You need to create a single slide that forces you to crystallize and succinctly state your strategic goals, the initiatives or practices as propositions that follow from them, and the supporting culture you will develop and encourage.
Recall that early in the book, I stated that a strategy must work together hand in hand with execution and culture in order to succeed. This slide is a distillation of how you can keep those three ideas front of mind and communicate them to your teams.
The One-Slider, as I use it, pulls together in one place each of our three aspects of strategy, execution, and culture. It might look like Figure 8-1.
At the top you state your vision. This is an aspirational statement describing what you want your organization to look like in the mid-term or long-term future. This should be a one- to three-year time frame. Less than that won’t give you time to do anything advancing enough. More than that, and you’ll be befuddled by changing forces.
Next, all of your three or five strategic goals should follow as propositions that support and help realize that vision. This is where you will allocate resources, and your estimation of the best way to get to that desired vision.
Next you state the initiatives or practices. This is the execution part. These should be specific, and each will likely be defined as its own project or program and involve cross-discipline teams.

Figure 8-1. The One-Slider summary
The One-Slider does not include all the rich detail you have worked on throughout this book. That material should go in additional slides after this summary slide. Make one slide for each initiative you’ll execute, and show how that decomposes into more localized specific actions and deliverables. They should include specifics about the toolset, and meaningful metrics, as we saw in “Scalable Business Machines”.
Figure 8-2 shows what your initiatives spreadsheet should look like.

Figure 8-2. The initiatives
You have headers for initiative, actions, and deliverables along with the named accountable role that owns that deliverable. The initiatives come directly from your One-Slider, and this represents something at a high-enough level that you can crank it out quickly as a communication tool, but it doesn’t represent all the detail of, say, a Work Breakdown Structure.
Work Breakdown Structure
A Work Breakdown Structure is a standard project management tool that is defined in the Project Management Body of Knowledge, as a “deliverable-oriented hierarchical decomposition of the work to be executed by the project team.” This works well with the Logic Tree and logical proposition approach we’ve taken in this book. I encourage you to read more at https://www.workbreakdownstructure.com/ and apply this tool if your project is of sufficient size and complexity that you would realize the benefit. Doing it on smaller projects doesn’t make a lot of sense.
This isn’t yet a project plan, but is a transition toward it to ensure that you are not just talking about these things in your teams, but that you can do just enough to have a token document for executive buy-in. Then you can manage the creation of the work as a project. Of course, you can add a column for due dates and so forth. If you have had a kick-off meeting and everyone is ready to start working, and you find yourself wanting to add much more detail, it’s probably time to turn it over to the PMO, transfer it into whatever project management tool you use, and schedule regular meetings to get updates from those with deliverables.
Finally, along the bottom of the summary One-Slider, you have the culture piece. This is not separate for each initiative, because it’s all-encompassing and you can’t go creating distinct cultures for different cross-functional teams in the same world. There is the one culture, and you want to be explicit about what culture you want to form. I hope by now it’s obvious that if you find yourself stating empty platitudes here, such as “winning teams,” you are not digging deep enough. Make only statements as claims that someone else could reasonably argue against, put a stake in the ground, and be proud and go after it.
I hope it goes without saying by now too, but make sure that each section of the slide, and the comprehensive slide altogether, is MECE (see “MECE”).
Use Case Map
Challenge: You have a burgeoning, large system design that represents one of your strategic initiatives. You need to decompose the idea further into practical use cases of value to an end user. You need something to share with an extended team to ensure their alignment and buy-in with the initiative.
Solution: Make a set of Use Case Map slides, one for each major use case. You want to think through the use cases from a customer perspective to ensure it is outcome focused and not merely activity based.
Figure 8-3 shows an example.

Figure 8-3. The Use Case Map
This map has five components:
- Customer outcome
-
Here you state the business benefit that this use case aims to achieve for customers. This is stated in clear, measurable terms, reusing the outcome aspect of the SBM (see “Scalable Business Machines”).
- Features
-
Here you list one or more bullet points of the major features of the system. You will later use these to map to epics. It is something at the level an architect or tech lead can design further. Together, these describe a complete, usable, independent system as an output, as we saw in “Scalable Business Machines”.
- Data components
-
These are the sets of data that are required to realize the output of this use case or to measure the metrics. This is high level in terms of data types, third-party data, or major kinds of data you’ll need to purchase or siphon off the shopping system, gain access to from the data warehouse, or retrieve from third-party APIs.
- System components
-
These are critical, big components of the software or process system you’ll need to create. They may exist already as services, or you may need to refine or reuse some component. They’re the building blocks of the system that are differentiating, complex, necessary, and important.
- Customer success measure
-
These are the metrics, stated like SMART goals, with measurements you can aim for and later verify.
Note that this is particularly helpful in making sure you are thinking in a way that makes your use cases clear, measurable, and valuable as an outcome for customers.
From this stage, you or someone in Product can decompose your Use Case Map into a set of Agile epics or team features to begin transforming the strategy into architecture plans and executable project.
Directional Costing
In technology we get asked for estimates all the time. Everyone jokes about how bad we are at estimating when we will deliver some software module. That’s for a variety of reasons, but an important one is that estimating is hard because we typically think only of the main parts of delivering something, and not the many auxiliary aspects that can take as much time or more. We think of how long it might take us to write the code, and don’t think of how we’ll write it again a different way when we’re unhappy with the first time, handling errors gracefully, instrumenting, writing tests, writing documentation, doing deployments, clarifying requirements, executing builds, refactoring, profiling, browser checking, fixing some broken windows we discover along the way, coding for the six important alternate paths that weren’t accounted for in the stories, learning a new framework, performance improving, and then hooking it up to the bigger deliverable. Writing the code itself is probably 33% of the work, even for a developer. Never mind the time we spend doing a load of unrelated things.
Projects often take two or three times longer than what we say they will. When 80% of the cost of a software project is intellectual labor, that’s a serious financial problem for our leaders.
But the bad news is that as woefully poor as we are at estimating time, we’re worse at estimating costs. That’s because we’re further away from the money, we’re less used to talking about it, and we don’t understand the nuances or even many of the terms nearly as well as we do our software discipline.
The good news is that the best executives tend to understand that the world isn’t black-and-white, that estimates can be defined in stages and in ranges. An executive or salesperson asking for a single, definitive estimate early in the project is actually the sign of a clueless leader, and less the sign of a truly deficient architect who estimates badly. Put another way, a leader asking you for an estimate on the basis of a single-sentence description of a complex problem might deserve open contempt. A leader asking you how much this software project will cost to build can be met with, “I don’t know. How much does science cost?” Refuse such idiotic questions. Much of our problem is that we don’t refuse them—we throw out a number and shake the date tree until a fake deadline falls out—and the executive believes us (or pretends to for other motives), so all of a sudden we’ve chained a team of otherwise good people to a death march.
It’s easy for me to say that you should refuse such questions, but the fact is that this has happened to me countless times in my career. We get backed into a corner. Some executive has a board meeting or the salesperson has a customer meeting or there’s a quarterly review—there are always wonderful excuses—and like an addict, they just need one quick number, one little estimate; they promise this is the last time they ask for an estimate like this, and this time it will be different and they won’t hold us to it, but they just need an idea. This is a dysfunctional relationship that sets a lot of people up for failure. But you can improve it.
There are two things to do to improve this situation we somehow constantly find ourselves in: give a really good estimate or give a much worse estimate. Either of these is desirable, as long as you’ve set expectations properly.
Rough, Refined, Realistic Estimates
First let’s talk about how you can do a really good estimate, whether it’s wrong or not.
The first way you can give a better estimate is by realizing, and communicating, that the act of estimating itself is a project. Back in the day, I used to make money just to do the project of giving someone an estimate of how much their real software project would likely cost. Similarly, I’ve paid architects and builders to deliver nothing but a spreadsheet that is a really detailed, thoughtful, thorough, researched estimate that everyone could have a lot of confidence in.
Consider why estimating should be a little project. For the builder to make that spreadsheet took weeks. They made dozens of phone calls, got actual quotes from suppliers with current rates, had many conversations with crews and the architect, and spent hours with the blueprints figuring out the proper materials and how many square feet of everything they’d need, including overruns and thoughtful waste accounting. They included all the templated items that are the auxiliary parts we in software often miss, such as hauling costs, gas costs, site rentals, temporaries, and so forth. That all takes time, it requires thought and negotiation and research, and that’s worth money. It’s especially worth the cost because that really good estimate makes it clear that if the project is just too expensive to go forward with, you’ll have to go ask the boss for a special dispensation to get more money, and now everyone can plan more reliably how to allocate resources. Good estimates matter, and bad estimates can really screw up a business.
The point is this: the weeks of work the builder in this example did resulted in a quote you can really hang your hat on, but that requires many hours of work to put together by a variety of people. If you don’t charge for it, or don’t treat it like a project, you can’t set proper expectations.
So the first idea is that you need the time to treat the act of estimating itself as a project, if you’re paying millions of dollars over years to make a building or a software product, and you really want to have your best chance of being close to the true number.
Second, you need a form to act as the deliverable of this estimate: you need a template so that you don’t forget all those auxiliary things that constitute the majority of the product timeline. You can see the long math that went into the estimate and pick over the details and refine it.
The third thing you need is a funnel of time with stage gates. Instead of doing either a terrible, useless estimate off the top of your head or doing a perfectly refined and thorough estimate after six weeks of work, find a couple of stages in between. Here’s what I mean. You might define three stages of estimating:
- Rough
-
This takes only a few days to produce, and everyone knows it’s only within maybe 50%. If, say, your estimate is $10M, and it’s labeled “rough,” then you’re not committing to anything other than a range of $5M–$15M. Do this first, and see if that ballpark still allows enough interest from executives to move to the next stage in the funnel.
- Refined
-
This takes a couple of weeks to produce, and includes more discovery conversations, and a clear understanding of requirements. Maybe this range has more documentation behind it, and is within 25%. It has no bearing on the original “rough” estimate. That is, your new flip of the coin—your new refined estimate—might reveal that you think the price is now $17M. That’s fine that it’s outside the rough range. But your range is now smaller. If you started executing now, you’d need to be between $12.75M and $21.25M.
- Realistic
-
This has a lot of homework behind it, many customer conversations, and a clear understanding and a commitment on the functional and nonfunctional requirements: the epics and stories are written, and the Architecture Definition (see “Architecture Definition”) is done. This estimate might be within 5% or 10% range. Never go without a contingency.
These three labels (which I just made up, so use whatever suits you, of course) give an executive a good expectation, allow everyone to mete out the work with shoulder checks along the way to do only as much as is warranted, and mean that the executive has some more levers to control: if he’s comfortable with a wide range because it’s a smaller-risk project or he has more money than time, then he can start the project wherever he’s comfortable. And you’ve kept your credibility.
The fourth thing you need in providing good estimates is to use ranges instead of precise numbers. Remember the logical fallacy of false precision (see “Logical Fallacies”). If we tell some executive the project will cost $18,535,716.34, that’s wrong. We’re already wrong. We can’t possibly know the cost of a two-year project with 100 people working on it down to the penny. Of course people know this, but it sets up a bad expectation. What we can do is use ranges to instead say something like $18M–$20M. Then we’re acting in better faith.
The fifth thing that you want in your estimate is a statement of your assumptions. All too often we skip this step, and a year later we get burned for circumstances beyond our control. Say the CTO declares that we’re deploying everything in the cloud. Then that guy gets fired six months later, and along comes a new CTO declaring that we’ll be deploying everything in new on-premises data centers we’re building because as a paperclip company, running our own data centers is a competitive advantage. Such business regularly goes on, in which case you should state the sorts of things that could change but that a big part of your estimate depends on. Write them out as assumptions as you add up server costs and provisioning efforts.
Estimate Template
You’ll be estimating things a lot. Remember that you don’t want to solve only the local problem, but to do just a little bit extra to help scale yourself and the overall organization as well. That means that when we get asked for an estimate, we do it, and then we also want to create a template we can reuse.
To create a good estimation template in software projects, consider these factors: the labor and the data centers.
There are two kinds of labor: the development teams and the supporting cast. Let’s start with the development team. Make a list of who is on your typical development team. I like to use the Margarita Mix team as a standard atomic unit: it’s 4 parts developer, 2 parts testers, and 1 part analysts. So you can say a development team is seven full-time employees (FTEs). Find out the blended rate you use from your PMO or business operations folks. Let’s say it’s $70 per hour. Here’s some third-grade math that will get us a long way: 7 people × $70 per hour × 40 hours per work week × 2 work weeks in a sprint = $39,200 per sprint. Let’s round that up to $40K. That’s the cost of a sprint.
Figure 8-4 gets more refined about the internal rate for the different roles. Your company may use some value that’s fully loaded or not or the same blended rate, or Finance may have a rate sheet they use for doing these kinds of calculations. Use whatever is easy and close at hand for directional costing—it’s more important to be quick at this point than it is to be perfect.

Figure 8-4. Labor costs
Now we can turn our attention to what we know about the work itself. We look at the entire body of work as we understand it at this stage. You’re looking for two things: what must be done in serial, and what can possibly be done in parallel.
Front-load the big blocks that are likely to be “showstoppers”—things that could sink the project if they don’t go well. You want to short-circuit the spending if you can, and don’t put off finding out that something critical is impossible or delayed or different than anticipated. You’re designing the project just enough to be able to determine how many teams you can run in parallel. That will give you the number of sprints you need, the number of teams, and the anticipated duration. Let’s say you can keep 10 teams busy, working on different aspects of the project so as to not interfere with each other. And if you had those 10 teams, the project would take 30 sprints. So you do some more math like this: 30 sprints × 10 teams × $40K per sprint = $12M.
Next you’ll need to account for those auxiliary players, which is a bit trickier to do, since we usually have them only part time, their work is not divided up so neatly into sprints, and it’s hard to see their direction relative to the work and therefore how much of their time we’ll need. We’ll have to consider these roles: Architect, Database Administrator, Networker, Scrum Master, and Project Manager. Put these in your spreadsheet and provide a simple calculator. Let’s say that we’ll need 25% of each of their time for the duration of the project. That would be 5 people × .25 × $70 per hour × 60 weeks × 40 hours per week = $210,000.
So our labor cost is around $14.2M. Figure 8-5 an example of how you might view those in a spreadsheet template on a summary page that you can pop into a deck quickly. This gives you the best of both worlds by showing the details and sets of assumptions as to how you got here, as well as recalculating when those assumptions change and giving you the quick answers that executives will ask about. You can get more sophisticated later and divide the world into capex and opex, but for directional costing, this is good for now.

Figure 8-5. Directional costing summary
Now let’s consider the data center business. If you’re using a cloud provider, it will have costing spreadsheets that make this sort of thing easy. For example, the AWS Cost Calculator helps you plan out the fees you’ll be facing monthly, which is great because it makes all the costs clear. You can fill it out quickly, get a number, and plug it into your directional costing spreadsheet.
The point of this pattern is not to mislead you with respect to the many sophisticated frameworks out there for estimating work. It’s to say this: a lot of times what executives need is not a perfect number, but a directional cost. They really do want a rough ballpark and don’t expect it to be perfect. They want to know if it’s more like $1M or more like $10M.
So sometimes it’s more helpful to produce an estimate quickly, even if it’s not that great. Executives are used to big numbers and tons of ambiguity. So being able to tell them the project is likely around $25M all-in is useful, even if it turns out to cost a bit less or a lot more than that. They are calculating things other than what they are asking you about. They are wondering if they should do the project at all. But they may be thinking of buying a company, and if they can buy a whole company with this capability for $50M and get it today instead of two years from now, and get all their talent and revenue now, then that might be a better option.
Which is to say that while the rough estimate may be maligned, it’s often useful—as long as everyone has the same expectations around it. The Directional Costing pattern turns out to be more about setting proper expectations than about nerdy project management math. There’s a time and place for that, and it’s pretty well understood. So I lay out a different take on it here, in the hopes that this is useful too.
Priority Map
The Priority Map, shown in Figure 8-6 is a simple guide to help you prioritize your Use Cases (see “Use Case Map”) or your strategic initiatives as in your One-Slider (see “One-Slider”).
This pattern provides you with a mental map to quickly guide you through all the angles of both risk and opportunity as you prioritize strategy efforts and major projects during strategy season or big shifts. This won’t be useful for prioritizing sprint backlogs or anything like that, but that’s not what we’re after here.
The map shown in the figure is not the only one you could draw of this kind, but it’s a good start. You could use the Priority Map in conjunction with the Growth Matrix (see “Ansoff Growth Matrix”), Investment Map (see “Investment Map”), or a spreadsheet you devise to score each of your strategic initiatives across all of these items, weight them, and produce a number you can use at least as a starting point for the priorities.
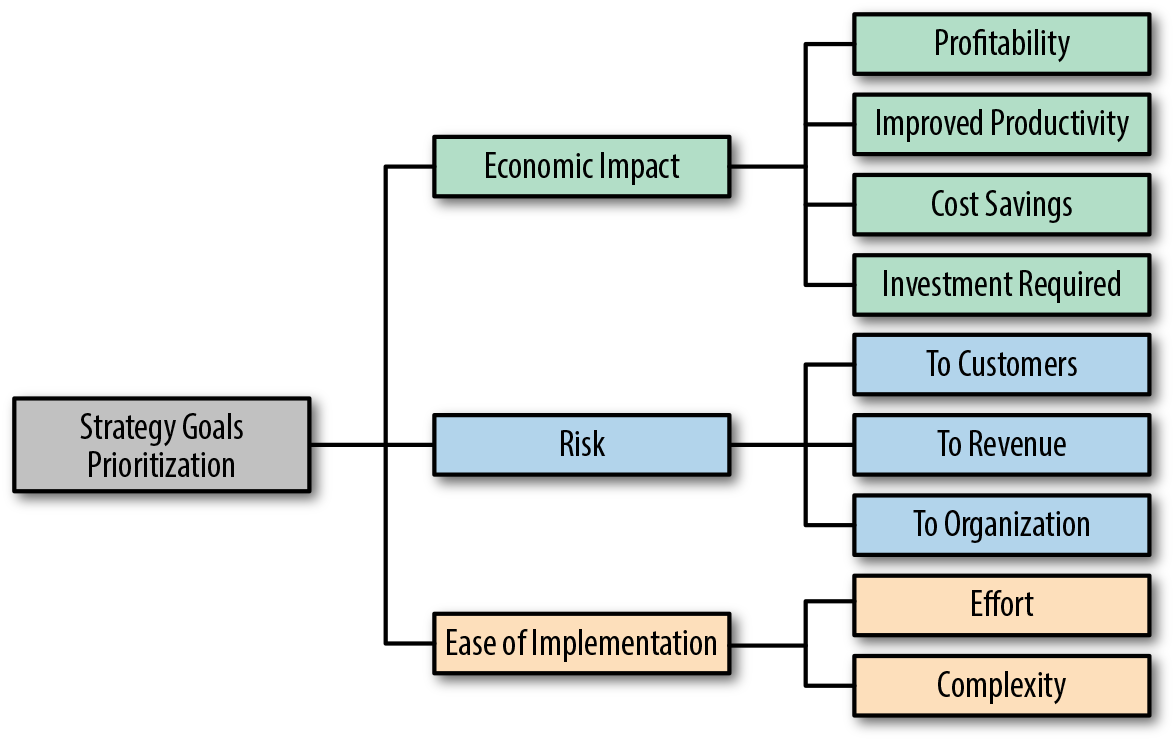
Figure 8-6. Strategic Priority Map
Technology Radar
How can we have a simple way to help us communicate our Roadmap for technology tools and practices to broad and diverse technical teams, collect feedback, and measure progress against advances on our strategy?
The Technology Radar pattern was invented by ThoughtWorks. The company publishes on its website, every six months or so, the set of technology tools it is reviewing, and gives a summary of its view on that technology.
The radar is divided into four parts: Tools, Techniques, Languages & Frameworks, and Platforms. Then ThoughtWorks further divides the technologies within each of those areas into a category based on how the company advises you to consider them. These subcategories are Adopt, Trial, Assess, Hold.
I like to look at this radar on occasion to consider how ThoughtWorks is thinking about technology. But they company opened up its radar-making tool so that you can generate your own radar using your own categories and list of items. This is a terrific way for you to visualize and share with your teams how you’re thinking about the set of tools out there. Depending on your culture, this can be more of a dictum or more of a guide.
The radar is not merely a frozen perfect tech future represented in boxes and arrows, but shows the tools and techniques together and presents them in a clear, easy-to-understand framework, and presupposes that you will evolve and update it.
The radar is a set of concentric circles representing criticality and standardization levels, showing what teams should start using now, what to learn about and test, and what to contain and avoid.
The Technology Radar will evolve over time, in a methodical, inclusive, transparent manner. This is a more evocative, realistic, and planful way to show your thoughts on technology features than a traditional single, pristine architecture target state as if it could be frozen in time. Figure 8-7 shows a sample from ThoughtWorks of what this pattern looks like.

Figure 8-7. Technology radar
There’s value in helping your teams see how you’re thinking, topics they should be researching, or areas where they might suggest other items you weren’t aware of. Instead of providing a merely beautiful, oversimplified, isolated, frozen snapshot of a future state (as architects all too often do), you can represent architecture as an evolving radar, improving the signal-to-noise ratio, and support a practice of directing capabilities toward a strategy. This can help us offer options through a variety of lenses.
Remember, too, that the radar-making tool can include any categories and items, so you could use it as a way of presenting strategy priorities in conjunction with the Priority Map (see “Priority Map”).
Build/Buy/Partner
Sometimes we’re brought into conversations with the business development folks who do mergers and acquisitions. We can use the Build/Buy/Partner pattern as a way of framing our conversations with them. It’s important to align these decisions with your technology strategy. Let’s take an overview of each of the three options in turn.
Build
There are many reasons to build your own software application or product:
-
You are, or want to be, a pioneer or leader in the market.
-
You have some reason or desire to own the intellectual property.
-
You have technologists in-house with the proper skills.
-
You have time to build it.
-
You want to own the technology for a long period because it’s core to your business.
-
You have expansion plans and you’d be in a more flexible strategic position if you owned the intellectual property.
-
You think what you would do with the product is innovative enough that it could be patented and licensed and become a valuable asset long-term.
The advantages of building yourself are that it provides you with the most product control: you can have every feature customized just your way; it offers the best opportunity for profit if you can market it; it offers you the potential for lowest cost in the long term; and you get an asset with value.
There are a few disadvantages too: it’s the longest time to market, and you’ll need to keep a number of development folks around to maintain it. You could find yourself in a precarious situation if you later want to switch and have gotten quite used to having all your processes exactly customized to your company’s nonstandard way of doing things.
If you’re thinking of building a big software system yourself that someone else could sell you instead, consider these questions:
-
Is this the way you want to use the time and resources of your organization? Are there other opportunities you won’t get to pursue because of this allocation, and is that OK with you?
-
Do you have the resources to not only pursue it, but to complete it, and do it in a significantly better way than what’s otherwise available?
-
Will you realize a meaningful cost savings?
Basically, it comes down to asking if this software represents a significant differentiating factor for your company that helps position you strategically and helps you compete in the market.
Buy
The Buy option represents the quickest time to market. You still have to face integration challenges, but not on top of making the system in the first place.
The biggest drawbacks are obvious: you don’t own the software, you may find it very limiting in the options it offers in terms of customization, you may have to change your business processes around the software or have to do things differently than you really want to, and it’s expensive. You also have the least control during the project, because there will be expenses of a different kind in terms of coordination and management, and there can be many lengthy contract negotiations and unmet expectations.
There really are two things meant by “buy”: you can buy off-the-shelf software such as Workday or Salesforce to run noncore functions or functions that are important but don’t differentiate you in the market. That is, no one is buying your software product because of the nuances of your HR system. But the other thing is that you outright buy the technology or the company that you want to get to market with. As an example, think of Google buying DeepMind. Google wanted to become an AI leader and start exploiting that capability, and would be years behind DeepMind, leaving it available for a competitor to pick up. Sometimes you want to buy a company or a key technology just to keep someone else from getting it.
The Buy decision comes down to determining what your core priorities really are. Ask if this is out of scope for the capabilities you are the best at, and if you bought another company’s solution, whether you could improve your competitive advantage. If you look at buying anything, perform a thorough Due Dilligence (see “Due Diligence”) and hope the deal folks trust the assessment of the tech teams. If not, this can be a very painful, incredibly costly disaster.
Partner
This blended option means you work together with another company, and each brings something distinct that’s of value, in an area that you’re a leader in, thereby creating a new thing of value.
The advantage here is that you get to market quickest doing something complex. This lowers later switching costs, assuming you design the integrations properly and you get to save on resources.
The challenge with this option is that you get the least control over your fate, and will lose certain revenue opportunity, depending on the structure of the deal, of course. Partnering is nice because you have another company to share the risk with, to help popularize the product, and to extend the name recognition and reach of your own brand.
When evaluating a partnership, ask yourself:
-
Is the potential partner financially healthy? Will they be able to hold up their end of the bargain and still be around in a few years?
-
How important or strategic is this deal to them? What’s in it for them to make sure this is successful?
-
Relationship: How well do you know each other, have you done business before, will your styles of working and your systems be compatible?
-
Execution: Will both of you be able to fulfill the obligations of the deal?
-
Speed: Is speed to market the most important thing, and will this technology enhance your existing offering in a credible, clear way? Does the partnership buy you time to get into a market and assess how much real potential there is?
With a partnership, the clear trade-off you’re making is for control. It’s also the middle road, the most compromising kind of decision.
I’m usually not a fan of partnerships. I’ve seen a number of them go poorly, and precious few go even well. Eventually, someone needs to decide if they want to be in this business or not, and if they do, they should own the solution and go be the best in the world at it. That said, partnerships can be a good way to test the waters if you really need to see more in order to make that determination. If there is no clear market leader, partnerships can allow you to work together as a longer-term way of deciding on an acquisition.
You can use the Build/Buy/Partner pattern in conjunction with Due Diligence.
Due Diligence
As part of the conversations we have during Build/Buy/Partner (see “Build/Buy/Partner”), if things advance to the Buy stage, we’ll need to perform a Due Diligence. This is an assessment of the technology and operational aspects of the target company. It’s very important, because it’s used to determine if the company should be bought at all. Depending on the outcome of your assessment, it may suggest that you leave the company be, or pay a different price than what the company is asking, or go a more nuanced route and pick up only part of its software, or enter into a licensing agreement. There are too many variables to make those suggestions into a template here, so this pattern is confined to helping you consider all the technological aspects so that you can make an informed decision. I encourage you to make your own template as suits your purposes. This pattern offers you a strong starting place for performing this kind of analysis.
First make a spreadsheet that will represent your template. Create a summary page, as we did with the Directional Costing template (see “Directional Costing”). It looks like this:
| Characteristic | Definition |
| Maintainability | Degree of effectiveness and efficiency with which the product or system can be modified to improve it, correct it, or adapt it to changes in environment and requirements. |
| Manageability | Degree of effectiveness and efficiency with which a product or system can be monitored, configured, and deployed. |
| Portability | Degree of effectiveness and efficiency with which a system, product, or component can be transferred from one hardware, software, or other operational or usage environment to another. |
| Security | Degree to which a product or system protects data so that persons or other products or systems have only the degree of data access appropriate to their types and levels of authorization, and demonstrates modern security. |
| Compliance | Degree to which a product or system complies with auditing and compliance requirements. |
| Privacy | Degree to which a product or system protects information deemed to be restricted due to privacy concerns. |
| Resiliency | Degree to which a system, product, or component performs specified functions under specified conditions for a specified period of time. |
| Compatibility | Degree to which a product, system, or component can exchange information with other products, systems, or components, and/or perform its required functions, while sharing the same hardware or software environment. |
| Performance | Degree to which a product, system, or component, relative to the amount of resources used under stated conditions, is performing. |
| Usability | Degree to which a product or system can be used by specified users to achieve specified goals with effectiveness, efficiency, and satisfaction in a specified context of use. |
| Functional suitability | Degree to which a product or system provides functions that meet stated and implied needs when used under specified conditions. |
This is your master list of concerns in the assessment. You can add one for your own company’s particular concerns, and how well the target aligns with your strategy and Roadmap, distinct from these generally reusable and standard categories.
You will create a set of questions in each of these categories and give the target product’s answer a score. Make a legend like this:
0: Unsupported and not on the Roadmap
1: Unsupported but on the Roadmap
2: Implemented but weak
3: Implemented and suitable
4: Implemented and world-class
Add another column to reflect these scores, as summed on each section’s individual worksheet.
These scores of 0–4 will cover most of the circumstances I tend to see when doing this kind of work. If the company states that a particular feature you’re interested in is unsupported in the current system, and not on the Roadmap, that’s a different signal to you than if the company knows it’s important and has it prioritized but just hasn’t done it yet.
Then create separate worksheets for each of those categories that have the drill-down questions. These will form the core of your assessment.
Each subsection spreadsheet (you’ll have 12 of them) will look something like Figure 8-8.

Figure 8-8. Due Diligence subsection spreadsheet
Make a similar worksheet for each of the remaining primary characteristics. You then score each one of these individual items with a value from your legend, 0–4. This should sum up to a score for that characteristic and then appear in the summary page. Together, these all add up to a score for the product.
There’s a second use for this template: note that as a software vendor, you could also offer this to large enterprise customers as they assess whether they should license your software or not.
Internal Use
But wait, there’s more—there’s a third amazing use for the Due Diligence template.
Maybe you’re thinking that you don’t have the opportunity to go around buying companies every week like Oracle, and this pattern is maybe not that useful. I love to use this tool in a novel way. Recall from “Rented Brain” that we sometimes (or often) want to act as if we are a consultant for our own company, so that we can be a bit more objective, stay out of politics, and speak truth to power. If you’re a technology leader on a development or product management team, I encourage you to turn your sights inward, and execute the Due Diligence on your own products, as if you were from a different company and sent to assess the quality and state of the software product.
After making the assessment on your own products, you have an excellent Roadmap for fixing technical debt, improving features in lagging areas, and providing a communication mechanism for talking with other leaders about how well your software is positioned. In this sense, Due Dilligence acts like a Process Posture Map for a single product. While I frequently use this template for both purposes, I’ve found that we really get a lot of mileage toward improving quality by designating an architect to run this internally.
Architecture Definition
I’m going to have to contextualize this template a bit. Let’s start with recent attitudes toward how we express architectures.
In my experience, the predominant form architectures take is in the clever people expressing their views over email and in meetings. This is too informal, too untraceable for architecture work. To be clear: I reject this mode of business unless the team is small, they all share extra-sensory perception, and what you’re building doesn’t require any physical load bearing. If you’re building Yet Another Trivial Social App for neighbors to spy on and gossip about each other, that should work just fine.
But when this “method” finds its way into the enterprise, absent any formal means, teams in these environments will be confused or uncertain about how to do things. The role of the architect lacks clarity, and there is insufficient accountability for their decisions. The products will also suffer as a result, and thereby so will your customers. Moreover, the architect, and thus the organization, is unable to scale, since they’re required to be present and speak to how they want things built. This is far too slippery and sloppy a mode for any really helpful architect.
Yet in recent years we hear formal architecture definitions—and perhaps even the practice of architecture itself—sometimes derided in the posh voice of maverick trendsetters, those impresarios of the modern software stage who denounce waterfall, reject RUP, and poison the well for any way of representing requirements that doesn’t fit on a Post-it note. We mustn’t plan because the world “changes” so fast, we are told. We have no problem spinning up 150 people to type their hearts out for two years, presuming to use $25M of someone else’s money to build something without a plan or design. But we can’t afford to have three smart people think about how to build this thing for three weeks. I find this irresponsible. We need to have a clear picture of what we’re doing, why we’re doing it, and how we’re doing it, and we need to be able to refer to those things.
But the currently prevailing trendy attitude in some—not all—software circles can be very inefficient. It can create significant churn, waste, confusion, redundancy, alienation, and lack of alignment. Yet in the name of saving time, we sometimes dismiss formal architectures. “We don’t have time to write this stuff down,” I’ve had dev leaders tell me. There’s never enough time to do it right, but there’s somehow always enough time to do it over.
Other detractors would denude the art and science of software development methods or architecture documents down to a set of platitudes proclaiming “disruption” and “obsession with customer feedback” as if their “platforms” will spring to life without a clear picture of what they’re doing, why they’re doing it, and how they get there. “Move fast and break things” works if you don’t think your customers are people, and what you’re “breaking” is trivia within a predominantly closed system entirely of your own devising with no operational contractual responsibilities, and you hold people, relationships, and data as playthings. I wouldn’t hope to get on an airplane built by software teams proclaiming this hollow creed.
For many practitioners, “Agile” seems to have devolved into “we don’t have to write requirements,” and “iterative” often translates to “we don’t have to think about what we’re doing.” But since it’s iterative, we can just revisit the same code and the same problems over and over, like a scene from Groundhog Day, or enter a Sisyphean eternal return from which one day hopefully someone will rescue us.
Consider that Google was built on a tremendous architecture foundation. The many (publicly available) founding papers for web search and PageRank are 20 pages long each—including diagrams and math!—adding up to many pages of descriptive, specific, planful architecture that paid careful attention to business architecture (though they don’t call it that, instead referring to the vulnerability of the algorithm as what eventually become known as “Google bombs”), and thoughtful and specific design around the scalability and the core components. Though the folklore likes to suggest that Silicon Valley is full of freewheeling geniuses who ride around on colorful bikes and don’t need to think about how to build their systems because it will all “just work” as long as they’re thinking about disruption, this is a false narrative.
This pattern represents a template to record architectural decisions and goals with the aim of guiding development teams working in an Agile environment. So it is up-front. In my experience, architecture is best expressed with a formality somewhere between a long hallway conversation and a full-blown Turing-complete intricate specification written in thousands of pages with Leslie Lamport’s TLA+. If you think even this middle-road way of recording architecture is too formal, this is how real companies are built: see the Google Search Architecture, the Google BigTable architecture, and the original Cassandra paper describing its architecture from its creators at Facebook. Often these papers were written for the public after the fact to explain how the systems were built. When this level of forethought isn’t applied initially, the software tends to quickly be rewritten and eventually scrapped. Consider the entire AWS website Amazon has devoted to its whitepapers, or a talk by a hero of mine, Amazon CTO Werner Vogels, on scalable architecture and how architecture must work with the business. There are a lot of PhDs writing these architecture papers. And they didn’t do it after the companies made their first billions. However people may talk, this level of detail, thought, and comprehensive planning is how the grown-ups do architecture.
In my view, to best help guide teams and direct systems toward demonstrating strong nonfunctional attributes, and to best scale the organization, the architect needs a template. This template might be called the Architecture Definition Document. It’s the document analogous to the blueprints of a building architect.
The product management team owns the functional requirements: what the system does. These items are expressed in epics and user stories and stored in something like CA Agile Central. That’s great. But the architecture team owns the nonfunctional requirements: how the system will be realized—and what’s their form of expressing the architecture?
The purpose of the Architecture Definition pattern is to express in clear, executable, measurable, testable, directive text what the nonfunctional requirements (NFRs) of the system are. These are the -ilities,” which we covered in “The Architect’s Role”.
I’ve used the same basic template for well over a decade to express architecture requirements. It’s based on TOGAF, but is much lighter and, I believe, more pragmatic. In this pattern, we’ll walk through the major sections of this template. Then anytime you have an architecture question that needs answering, you can use this template. It scales from just several pages if you’re making a change to a single component inside a system, to large documents that cover how to build entire new systems. I’ve used it to write architectures in just 6 or 10 pages, to 50 pages, to 150 pages. It scales in a different way too. The lead or enterprise architect might write one capturing the broad contours of a system, and then have local application architects on a team write “child” architectures that represent specific subsystems.
One question that comes up is: When should architects weigh in? I use the following informal little rule of thumb, and make sure the team knows it too:
When something is going to cross a data center or other significant network boundary
When something is going to cross system boundaries
Anything architecturally significant
The question of what’s “architecturally significant” seems slippery, but it’s actually rather decidable. It breaks down to one or more of these, based on the Wikipedia list:
-
There is high business value, it’s highly visible across teams, or it has high technical risk.
-
There is high risk of budget overruns or high business risk based on past experience with similar projects.
-
There are outstanding questions or concerns from a key stakeholder or business leader.
-
This component is new or first-of-a-kind to the organization—none of the responsibilities of existing components in the current architecture addresses it, or it must dramatically change.
-
The requirement has Quality of Service or SLA (service-level architecture) characteristics that deviate from all the ones that are already satisfied by the evolving architecture.
If there’s other stuff, architecture can be silent on it and let the team leads handle it. Now let’s look at the template itself.
The Template
There are five primary sections to the Architecture Definition template I use:
Metadata or Front Matter
Business Architecture
Application Architecture
Data Architecture
Infrastructure Architecture
Metadata
First, you have the front matter, the document’s metadata. Include the system name, author, and date. I don’t care about version, because the date to me seems like the superclass of that data; the date a unique thing like the version number, and it tells you how long ago the document was written, which adds useful context. I also like to list the people who reviewed and contributed to the document to make sure that readers know who else was involved and how holistic the perspective is.
My favorite part of the metadata is the Internet Engineering Task Force (ETF) keywords. I always include “must,” “may,” and “should” as keywords and state that the document will use them with special status, like this:
Use of IETF Keywords
This document employs a subset of the Internet Engineering Task Force keywords found in RFC 2119. These words are MUST, SHOULD, MAY, and their counterparts MUST NOT, SHOULD NOT, MAY NOT. They are capitalized throughout the document to draw attention to their special status as keywords used to indicate requirement levels.
I love the IETF keywords because they are MECE and clear. They nudge document authors toward decisiveness and specifics, and make the implementation path more sidirected for readers.
Business Architecture
This part is one of the least understood aspects of architecture for technical people. Its aim is to provide a map of the common understanding of the organization as a system, with its organizational models, processes, and capabilities in order to establish alignment with strategic goals and tactical plans. In that sense, business architecture has been an underlying focus of much of this book.
It answers, or at least collects and reflects answers to, the following core questions:
-
What organizations do we have?
-
What capabilities do we have?
-
What are our Value Chain models (see “Value Chain”) and their attendant processes? What is the present posture (see “Process Posture Map”) of those processes in order to assess our preparedness to support strategic goals stated by the business or strategy teams?
-
What information must flow through their processes as their fuel for them to run?
These are the basic building blocks. But any business architecture practice that stops there isn’t creating anything of value. We have to take these raw ingredients and make something useful. This means drawing connections. We ask:
-
What are the relevant regulations, applicable laws, rules, or corporate policies that might constrain our system?
-
Who are the stakeholders (see “Stakeholder Alignment”)? Who owns what decisions? What events are generated when a decision is made?
-
What initiatives are under way, and how well aligned are they with the strategy and each other?
-
What are all our products and services, as listed in our APM (see “Application Portfolio Management”)? How well aligned are those with the strategy and with each other?
-
What training might be required by the new organization or new system or component we’re architecting?
-
What metrics will we use to measure how well we are doing toward achieving our desired outcomes? What data do we need to support those metrics? How well aligned across organizations (or machines) are they? What behavior do they drive?
Now you can start to determine the gaps between your current state business architecture and where you need to be to support your initiative. Recall our model in Chapter 2. In this way, you can view the first set of previous questions as your data findings—the collection of research and raw materials—and the second set of questions as being occupied with the insights you can draw from it.
For me, any good business architecture will answer these two questions—different sides of the same coin:
-
What business constraints exist that will inform or modify the proposed technology system? How will they do so?
-
How will our business need to change in order to support the proposed technology system? What training will teams need to successfully realize the system? What governance will need to be in place through the large project or subsequent to its completion? What processes or teams will be impacted by the system?
When you make a scalable business machine (see “Scalable Business Machines”), you are making an executable model of your business architecture.
As with many things in this book, the business architecture as I describe it here is fractal: each part has the same statistical character of the whole. That is, you can ask these same questions about a single component that you’re writing an Architecture Definition for, or for the architecture of a new greenfield application you’re building.
Such a template could look like this:
- Major Features
-
Describe the purpose of the system and its high-level feature set. What will this system do? What current capabilities can we draw on? What must be repurposed or modified?
- Strategic Fit
-
What aspect of the business and/or technology strategy does this effort and design support? How does it help realize strategic goals? If counter to the goals, how is that justified?
- Business Drivers
-
Make a bullet list of the reasons for doing this project. What money would be saved, what efficiencies would be created, what process improved, what customer opportunities enabled?
- Business Priorities
-
Given a conflict of priorities, what is the stakeholder bias (time to market versus quality, performance versus security, SLA versus costs).
- Assumptions
-
Make a bullet list of your assumptions about the current state of the world, your organization, and your systems that, if later proved false or changed, could dramatically impact this system. Consider people (what existing roles or new roles do you assume will be in place that you might require), process (consider Procurement, HR, Finance, approval gates, ETO, GNOC, Security), and technology (consider stated drivers, standards, or architectural direction or patterns from the leadership team).
- Constraints
-
What are any applicable laws governing the data or processing of this system? Consider GDPR, or other European personal data laws, for example. List applicable regulations, such as ADA, PCI, and PII.
- Risks
-
List business risks in doing the project as envisioned, and risks to the customer or existing business prospects or processes. Can the project be maintained and operated properly, are staffing resources easy to find, is funding secured, what countries or markets will be targeted, what risks are inherent in trade-offs made?
- Impacts
-
What will this project or this architecture create in terms of the organization, training, and process?
- Stakeholders
-
List internal and external business partners who are concerned with or impacted by this project.
- Governance
-
How will the project be governed? Is there an executive steering committee, or a responsible stakeholder committee? What cadence and form will they take, with what explicit purpose?
The Business Architecture section should be the first primary section of your burgeoning Architecture Definition Document, after the headers or metadata.
Application Architecture
This is where you describe the software components and how they are built:
- Applicable Standards and Policies
-
Make a list of links to published guidelines and conventions for dev teams to follow (e.g., any internal policies, OTA/HTNG specs, PCI guidelines, ADA guidelines).
- Guidelines and Conventions
-
Make a list of links to published guidelines and conventions for dev teams to follow, most likely published internal standards documents, Google Java coding guidelines, JavaScript conventions, code quality guidelines, and the like.
- User Interface
-
Specify the anticipated impact of UI/UX to the project, existing design work, wireframe method, and libraries to be used. You may have a Concept Model to reference.
- Services
-
List services to be created or existing services to be reused, and the owners of those services. This one requires some real analysis beforehand.
- Security
-
Specify the security requirements and design: how data will be secured, encrypted, authorized, authenticated at rest, in transmission, or in processing. Outline the use of OWASP Top Ten and how those are addressed. Cover user roles and authentication methods and authorization. What security groups are required? How will credentials be stored, and how will keys be managed? Will you use two-factor authentication? Highlight security requirements for development such as bastion hosts. List transport or TLS/SSL requirements.
- Availability
-
Target SLA in terms of 9’s uptime and how specifically the architecture will support such numbers. Document how recoverability, disaster recovery, and the like is being supported. What compensating actions are taken? Will a circuit breaker be used? What redundancy is there? What caching? Health check page? Multideployments?
- Scalability and Performance
-
List the number of transactions per second at this latency and CPU utilization. What is the unit of scale (container, VM, cluster)? What are the ways the application and services can scale through statelessness, autoscaling groups? State thresholds.
- Extensibility
-
List APIs, ways that the application affords future change, how the application supports customizing per customer, and how configurations are afforded.
- Testability
-
How will this be tested, what tools will be used, and what specific automation and targets will be in place? Include functional testing, regression testing, automation, tools used, chaos testing, and resilience testing. What is the load-testing plan?
- Maintainability
-
What software guidance for developers will help make the code base easier, cleaner, and simple to maintain in the long term? What are the code repository needs or project needs? What is the maintenance schedule anticipated or downtime for upgrades strategy?
- Monitorability and Metrics
-
What tools and dashboards are required, and what are the logging requirements? State how the software itself must support event publishing to increase visibility. What are the specific metrics that will indicate system uptime, health, and proper performance? How will alerts be triggered, and at what threshold? Consider CPU, memory, drive/filesystem volumes, database process monitoring, logs, event logs, and required procedures. These will end up in an operational playbook or hopefully getting automated.
Data Architecture
The next aspects of the template are all about data: how to get it, what to do with it, how much there is, how long to keep it, how to move it, and how to get rid of it.
This section might include the following:
- Data Sources
-
Where should the team get key data from (existing services or databases or new)? Where is data stored? What database software will be used to store what data? Which instances of those databases should be used?
- Data Strategy
-
What are the hard limits on the number of key data rows? What are the key data transaction size limits? What is the tolerance for eventual consistency for key aspects of the solution? Include data warehousing, storage and management requirements. Transfer requirements. Long-term storage.
- Transactional Requirements
-
What are transaction requirements such as two-phase commit, eventual consistency? What data volumes must be supported? Include data movement policies and requirements.
- Volatility
-
How often will key pieces of the data change?
- Data Maintenance
-
Describe how data will be maintained, data retention policies, scripting to offload, data restoration. How will data be populated for different environments for this application? Will data be truncated? At what interval? How will data be encrypted? Are there GDPR or PII/PCI requirements to be stated for dev teams or infrastructure admins?
- Data Migration
-
How will data get into the system? Is connecting to a legacy system required? How will you replicate data? Is Golden Gate or Kafka or ETL or another tool in use? What time period is anticipated for this? Will data have to be synchronized over a certain period time?
- Data Volume
-
How many rows are anticipated to be added daily for the key services? What size database is anticipated? Will there be multiple data stores?
- Logging
-
Log rotation policies, Splunk requirements, and indexes.
- Analytics
-
What data must be exposed by the application to support business analytics? How must that data be exposed to support analytics tools?
- Caching Strategy
-
Requirements for caching and the locations and technology to support caching.
Infrastructure Architecture
These aspects of the template are about the data centers, the network, the hardware, and the operational aspects. We can’t leave these out: the application and its environment are all of a piece, and the architecture must consider the full stack.
The key sections here might include:
- Cloud and Data Center Requirements
-
Which data center will this be deployed to? How many? How will communication between data centers be supported? Will this be a cloud-based application? How will that be supported? What about cost management strategy? Deployment pipeline requirements? How will the infrastructure be stood up—are there infrastructure-as-code or containers and orchestration opportunities? Do you need to be “cloud-agnostic” (good luck)?
- Deployments
-
List how deployments will be executed, outlining any blue/green deployments, deployment pipeline, and CI/CD.
- Disaster Recovery
-
Is DR required by this solution? Will it be built-in DR based on data replication and redundancy?
- Network
-
Describe and diagram networking with firewalls, gateways, load balancers, VIPs, zones to be used (e.g., PCI, DMZs, routing), and DNS-specific needs.
That’s the template. It’s a lot, but not all sections are equally important, of course, depending on the size and nature of the product. I really hope that thinking about your architecture this way helps you make great systems.
Executable Architectures
I can see you rolling your eyes already: making a document like this would take too long! No one will read it! Documents like this just wither and die when we post them on the wiki. They’ll languish at the edge of the known universe for years. I urge you to think otherwise. Here’s why. I have used documents like this for a decade, at different-size companies, and they work. But not in a vacuum—they must be used as a first step to translate them into what will be executable within the project team.
But the NFRs need a system for their expression, and we just have to close the gap between that formal expression of your architecture and the teams typing the code. We can do that. Depending on the size of the system or component you’re architecting, there are different ways to handle this.
First, I encourage you to work with the product team and the analysts to get your NFRs into the acceptance criteria of user stories about functional requirements. This is the best way to make sure your architecture work isn’t ignored. That also ensures that you are writing the architecture requirements in such a way that they are easily transferable to story form, demonstrable, and testable.
The second way you can do this is to help guide the analysts or product teams to write stories specifically for the NFRs. If you’ve defined your NFRs properly, as measurable and specific and testable and demonstrable, this should be easy to do. I like this way much less, because it tends to make some of the teams think they aren’t responsible for thinking about the NFRs, and it means that you can’t have the proper sense of ownership and delineation.
The definition defense
You cannot simply write an Architecture Definition Document, hand it off to the development teams, and expect anything good to happen. Your architecture won’t be realized. We all know that won’t work. The teams won’t implement it, and you will be viewed as (and unfortunately actually be) irrelevant.
A critical part of success here is to actually talk to the teams, but with the document as a center piece of these conversations. This lets you eat your cake and have it too: you get the formality of the document and the engagement and understanding of the two-way conversation.
Dissertation Defense
If you’re not familiar with the term the “dissertation defense,” it’s the final committee meeting before a PhD candidate is granted her doctorate. The candidate has written a book-length document on her subject, called a dissertation, and must defend her claims in person before the committee in a process that takes hours, to ensure that she really knows the material and that it makes sense. She must defend her methods and research and choices to the committee.
To aid in this eating our cake and having it too with the formality and the conversation, some years ago I came up with borrowing the idea of a dissertation defense for us as architects. You need a forum for people to argue things over, ask questions, clarify misunderstandings, and agree to move forward. This will act too as a refining opportunity for you to gain insights into where the architecture isn’t optimal or the constructs make sense but aren’t expressed clearly.
Have meetings to walk through the document. Invite application architects, enterprise architects, develpment leaders, analysts, product managers, and relevant technical stakeholders. These are long forums in which the teams can ask clarifying questions of the architect, similar to a dissertation defense in graduate school. It’s similar to an architecture review board, but inverted, because the architect who authored the document presents the material instead of being merely a passive participant as some “star council” sits in judgment.
The dissertation defense meeting has a form similar to this:
-
Write your definition document.
-
Schedule a meeting that has a clear agenda—a definition defense meeting. People should know what that is. Your invite should include the definition document in the meeting agenda as an attachment.
-
Give people a week or few days to read it and remind them to do so before the meeting.
-
Many still won’t read it. Chastise them roundly, and then spend the first bit of the meeting reviewing your document’s major decisions and most different, key aspects.
-
Open the room up for discussion and welcome questions from the group. Clarify for them, and take criticisms without defensiveness.
-
Take notes and after the meeting revise the document as applicable and resend it to everyone, thank them for their time and great ideas, and then follow up in the ways we’ve discussed to be sure their feedback is incorporated into the work.
If all this sounds very too-too much, my view on that is, “If you think education’s expensive, try ignorance.” Having a coherent, unifying vision is the best way to help people understand what they are doing, why they are doing it, and how their work maps to the bigger picture and the work of their colleagues. Of course the length and depth and most relevant sections will be different depending on the size and nature of the system you’re building. I’ve made versions of these documents that were five pages and took a day to write, and I’ve led large greenfield systems representing a major overhaul of a core business product for which our architecture team produced hundreds of pages of architecture definitions, suitable for different teams.
If you still don’t like it, consider the alternatives: you could put it all in software. I’ve never been a fan of the software that purports to make your architecture executable. It seems forever grandiose, out of touch, and really disparate to the way teams actually work. It takes a long time, is forever out-of-date, generates suspect code, and rarely maps to the real requirements. These approaches are for people who think a commercial tool will solve their problems more than rigorous thinking, pencil, and paper. Those people struggle on my teams.
Treating your role, your department, as a scalable business machine (see “Scalable Business Machines”) with a clear output in the form of this document and attendant local requirements in stories is the best way to ensure that your architecture features are realized in the final product.
You have now made your templates because you know you will frequently repeat this kind of work and need to externalize what you know so you can move on to the next big, exciting work. Then you’ve filled them out in collaboration with knowledgeable colleagues so you have a mass of insights to use in myriad ways as you weave together your final strategy in a coherent, compelling set of decks.
Summary
In this chapter, we covered eight patterns to help you talk about your strategies and architecture decisions to a wide variety of audiences at different levels. The tech teams, management and decision-making executives, and customers will all benefit from the patterns presented here:
-
One-Slider (see “One-Slider”)
-
Use Case Map (see “Use Case Map”)
-
Priority Map (see “Priority Map”)
-
Directional Costing (see “Directional Costing”)
-
Technology Radar (see “Technology Radar”)
-
Build/Buy/Partner (see “Build/Buy/Partner”)
-
Due Dilligence (see “Due Diligence”)
-
Architecture Definition (see “Architecture Definition”)
The next chapter will show you different types of slide decks that you can use to tell others about your great ideas and how to structure them so those people understand them, like them, and fund them.