Chapter 5. Corporate Context
In this chapter, we look at the patterns that operate internally within the sphere of your own company. There are more patterns in the corporate sphere than in the others, as the work of your technology strategy is primarily centered on how to position your company for competitive advantage. They are:
Stakeholder Alignment
RACI
Life-Cycle Stage
Value Chain
Growth-Share Matrix
Core/Innovation Wave
Investment Map
Stakeholder Alignment
Strategy without tactics is the longest route to victory. Tactics without strategy is the noise before defeat.
Sun Tzu
The way to be successful in a company is to do something that matters to someone who matters. To test the validity of this assertion, consider the alternatives.
The first is for you to spend time doing stuff that doesn’t matter to the people who matter. If the work you’re doing does not matter to the executive leadership in your company, you face a choice. On one hand, you can get on board with something that does matter to them. Drop what you’re doing and find a different team, a different role, or a different project that does matter to them; or redefine what you’re doing so that it fits better with the stated direction and values. On the other hand, some soul searching may reveal that your passion for that misaligned project or process is so consuming, persistent, and fierce that you simply do not want to give it up. In that case, you must convince the executive leadership that it must change, or you can leave the company for one that shares your passion or start your own.
Projects that don’t matter to the people who matter are misaligned. These projects will keep you employed for a short time perhaps, but they are not likely to complete, and will not advance your organization or your career. Eventually, someone will ask about that little project line item on a budget spreadsheet. If no one in the conference room knows what it is or why we’re doing it or who the customer is, it will be sidelined and cancelled. Being on the team of misaligned projects wastes the time and resources of both you and the organization.
The second alternative is to do stuff that does matter, but only to people who are not the leaders. The leaders set the strategy—the technical and business direction—and expect it to be executed.
In both of these scenarios—even if your personal contribution is strong, and you show up every day with conviction and do your best—if your project is misaligned, it will be cancelled. If somehow you and your team do cross the finish line with a misaligned project, that day will see your meagerest rejoicing,1 as it will highlight something that was previously thriving only because it was under the radar. If you are associated with projects that don’t matter to people who matter, it dramatically lessens your own chances of being viewed as a strategic, go-getting up-and-comer in the organization. The impact to the company is that resources are hidden or misspent, delaying the chance to complete the strategic projects.
If your organization has a proliferation of projects that don’t matter to the people who matter, it must gain alignment so can spend its resources working on stuff that does matter. Organizations that cannot do this fail.
Therefore, you must be sure that you have the support of the most powerful leader you can. The most technical or highest-ranking leader in your organization will likely be the CTO or CIO, or in smaller organizations, the VP of IT. It goes without saying that there is no meaningful technology strategy without their support. However, their support alone is not enough. You must also have the highest-level executive’s support, or the probability is high that your strategy will stagnate and suffer. It is the noise before defeat.
In my view, the best leaders and the best-led organizations are sharply focused on strategy, and the projects they fund and the customers and partnerships they pursue all logically follow as consequents from this strategy.
Yet not every leader recognizes the centrality of strategy. Your president or EVP or SVP may change direction quickly, without notice, chasing any dollar waved in front of him for any customer or attractive project that comes along. He may have an unhealthy relationship with partners, vendors, or customers, resulting in an inability to see himself as master of his own fate. He may simply lack the focus and tenacity to stick to a plan that spans longer than a quarter. These are very difficult working conditions for the strategically minded architect.
Executives in some organizations may ignore or even show outright contempt for strategy. They proudly act on instinct and inspiration, and consider any strategy as the work of bureaucrats or dreamers disconnected from the real world, or as something quaint and cute that best belongs on the shelf to collect dust with the rest of the stuffed animals. People can enjoy the freewheeling lifestyle and moderate success that sometimes accompany this mode, but this is not how market leaders are typically made.
Alternatively, your executive leaders may not have quite such an adversarial view, but still may not understand the importance of your technology strategy. But regardless of what it is, you must understand your highest leader’s view on strategy. This is the only way to know where you’re starting from. Typically, leaders will readily sort themselves into strategic, or something else. That “something else” will lurk in the guise of “intuitive” or “deal-driven” or “operational” or too busy to think about the future. If your CEO or business unit president or Chief Whatever Officer is not interested or well versed in strategy, you can still be successful, but will have a longer, harder road ahead of you. If this person shows outright contempt for strategy, my estimation of the probability of your success is low. In that case, my recommendation is that you put down this book, stop caring about strategy, and ride the roller coaster until it goes off the rails, or, if you find yourself now inspired and steadfast in the joys and fruits of strategy, find a more clueful organization to work for.
It may also be the case that your leadership understands well enough that it must have a strategy, and you have simply been tasked with creating or contributing to your organization’s technology strategy. That’s a fortuitous first step, and saves you the work of convincing them that strategy matters. That’s a hard row to hoe.
Determining Stakeholders
If you want to get something meaningful done, you must first understand the organization chart. To do so, start at the top. Find out who is the CEO, and your business unit president. Ultimately, your strategy must matter to these people, or it will fail.
Stakeholders in What?
All this stakeholder business is more about who has an interest in the project that will result from your strategy. It’s not about the stakeholders in the process of creating the strategy documents. But use it as applicable.
You must know who reports to whom so you can make smart decisions about who to communicate with and include in your strategy creation project. To gain support for your strategy, you must have alignment from only three groups of people:
-
The people who will pay for it and stand on a stage and tell others that it’s important (your leaders, the executive team).
-
The people who will execute it, and need to understand it well enough to care about it and execute it properly (your teams, the individual contributors doing the work).
-
The people who will ignore or undermine it if their views, aspirations, and concerns aren’t represented (your peers).
Therefore, you must have a 360-degree view of the organization. This will help you understand how your organization works, aspects of the process of getting things on the Roadmap and funded, where bottlenecks might be, and more.
Determining Drivers
Once you have examined the org chart, determine what leaders at the VP, Senior Director, and/or Director level matter in terms of your strategy.
These people will be inside your technology organization, but you must also take into account those in other organizations within your company. If the operations or “run” team is under a different leader, identify key leaders here. You must consider product management, sales and account management, the legal team, project management, and the HR team. Your strategy will not be the right strategy, and will not be supported or effective, if you do not consult key leaders in these organizations.
Similarly, you should expand the circle and consider those outside your company entirely. Depending on your business, it is likely a good idea to consult with key customers and important franchisees, and gain an understanding of what plans and views your vendors and suppliers have.
While you must understand these fundamentals, it is not necessary or practical to consult everyone. Don’t do this. It will take inordinate time, and likely result in something that looks like it was designed by a committee, whereby everything is watered-down and compromised to such an extent that it is drained of all meaning. If you find that your strategy contains any platitudes that might make good candidates to be printed on a T-shirt or chiseled in the lobby’s marble floor, this is a sign that you have gone too far. If you are not making statements that someone could reasonably argue with, you are not making a meaningful or impactful statement—you’re not making a choice and putting a stake in the ground to forge a new future.
Who stands out as powerful on this team? While most leaders will at least try to make it appear that they love all their children equally, in reality they do not. Based on their background and proclivities, where they are trying to take the company, the problems and opportunities they face, or the tenure of the members of their executive team, the CFO may exercise far more power than the head of sales, or vice versa. The mergers and acquisition (M&A) team may be two people languishing with no funding to buy anything and therefore little of consequence to do. If the prevailing view is that it is too risky, error-prone, and lengthy to build many things from the ground up, and the strategy is to acquire the best and integrate them, then the M&A team at a conglomerate might be very large and well funded (read: powerful) and busy buying another company every week. In such a case, it is important to consult this team, as their input matters more, and your strategy should reflect that.
If your business unit president cares about the sales team more than anything else, you must include relevant messages for your sales team, and give them a script to talk to customers with. If your CEO seems to listen most closely to her CMO, and you frequently see them on stage together, it would be wise to consult them both and see what materials they have that you can start with.
Reaching out to these extended members of the leadership team for their input has the additional benefit of making them aware of your strategy.
Stakeholder List
Once you have considered all the different teams and leaders just discussed, you might find your list is surprisingly long. You will not be able to keep it in your head.
Therefore, keep your list of the key stakeholders in a list. Make a simple spreadsheet with columns for:
- Name
- Title
- Organization
- Contact information
If it seems that the stakeholders are too obvious, or that there are too few to bother making such a list, you have not dug deep enough. Expect that the list will contain 10–30 names, depending of course on the size and nature of your organization.
Creating the list is simple. It will serve as a building block for other useful documents, such as the Stakeholder Matrix (see “Stakeholder Matrix”) and the RACI chart (see “RACI”).
You will also need it for later, in architecture documents, town hall invite lists, invite lists for steering committees, and more.
Stakeholder Matrix
Different stakeholders have different roles within your strategy project. The frequency and type of interaction you have with each of them depends on the nature and focus of your strategy. Consider your work from their point of view. Is their support important to its success? Do they have knowledge or expertise that could improve, refine, and strengthen your strategy? How much will your strategy change their processes or daily work once implemented?
Once you have your stakeholder list, add two columns to it:
- Influence
- Impact
Influence refers to how important this person’s support is. What is her ability to change your direction, impose new priorities, dictate critical aspects, ensure your funding, or otherwise determine constraints for your technology strategy? It’s the degree to which she can impact your strategy.
Impact, on the other hand, refers to the degree to which your strategy, as it becomes realized, will impact her. For example, your strategy will have a high impact on the developers now using an aging technology stack if you’re proposing to consolidate on a single modern toolset. If you are introducing a services strategy, you must be closely engaged with the product management team. If your strategy involves outsourcing nondifferentiating systems to vendors, this may impact sales and HR. Of course, these are simply examples and depend on what your company does.
Now that you have these two additional columns, use them to score each stakeholder on a scale of 1 to 5 for his or her influence and impact.
Generating 2×2 Matrices
We’ll do a lot of generating 2×2 matrices, the four-quadrant charts that plot values to help drive decision making. The basic process is that you enter the values in Excel, create a bubble chart, and then color the backgrounds to create the quadrants.
See http://bit.ly/2MlCIpr for a tutorial or download my template from http://www.aletheastudio.com.
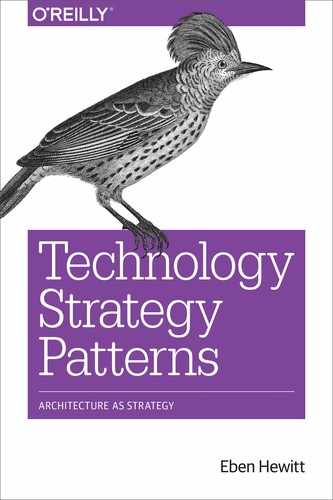
You can now use the scores to plot your stakeholders on a 2×2 chart with influence on the y-axis and impact on the x-axis. It contains four quadrants, as shown in Figure 5-1:
- Monitor
-
Those who are relevant enough to make the list, but have comparatively low scores for both influence and impact.
- Maintain confidence
-
Those who have high scores for influence but low scores for impact.
- Keep informed
-
Those who have low scores for influence but high scores for impact.
- Collaborate
-
Those who have high scores in both influence and impact.
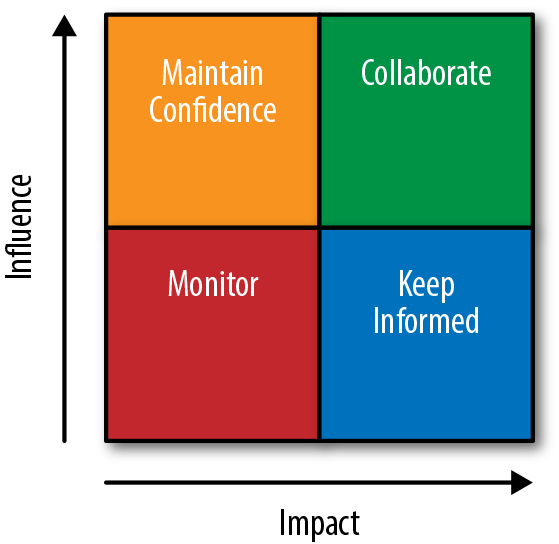
Figure 5-1. Once your matrix is complete, the names will appear in the quadrants
Here is how you work with the stakeholders represented in each quadrant:
- Monitor
-
Ask them on a regular basis about changes in their worlds and what they see coming, and note what might inform your work. Check in with them occasionally and informally regarding your progress. Broader understanding of what you are doing and why will create additional groundswells of support that may be handy later.
- Maintain confidence
-
Invite them to executive steering committees for your technology strategy. Send them reports on your activities. Be sure they understand your milestones and know how you are doing with respect to achieving those. Ensure they understand and approve your metrics for success. Ask about trends or insights they have that might modify your strategy. Follow up on their continued buy-in on the Roadmap. Discuss your progress and funding regularly in some detail in one-on-one meetings.
- Keep informed
-
Include them in an email distribution offering occasional updates on the strategy. Invite them to broad forums such as a town hall where you are presenting an update. Talk with them about work they might have to prepare, such as communications, trainings, deck updates in their departments, or other materials they might have to create as your strategy progresses. Go to their department meetings to present specifically to their team. Discuss the strategy and progress with them at cocktail parties.
- Collaborate
-
Actively work with these people on a regular basis in full partnership to co-create the ideas and execution plans within your strategy.
Now you’ve got a strong understanding and representation of the organization. You may need to update this from time to time as people come and go, get promoted, and change positions, depending on the length of your project. But now you are well prepared to quickly get things done in parallel threads.
RACI
Now that you have created your Stakeholder List (see “Stakeholder List”) and Stakeholder Matrix (see “Stakeholder Matrix”), you have the raw material for helping you collaborate and communicate about your technology strategy project.
RACI is an acronym originating at the Project Management Institute (PMI). It stands for Responsible, Accountable, Consulted, Informed. These are classifications for the participants in your project.
We make a separate document for the RACI instead of just adding to the Stakeholder Matrix. That’s because though there will be some overlap, these lists tend to have different people on them.
List broad categories of work down the lefthand side:
- Responsible
-
These people do the hands-on work to complete this task. Depending on the nature of the items in your work list, this can be any level of title.
- Accountable
-
These people are answerable to executives for this item being delivered on time with appropriate fitness and quality. May be a VP or director.
- Consulted
-
These are subject matter experts on some aspect of the system. They are not directly on the hook for doing the work. They may make local decisions or certain aspects that you seek them out for. They’ll give advice such that their ideas will change your work, the design, or otherwise modify your strategy. Identifying the right Cs on a project is the difference between a lot of buy-in and a robust product, and something more tepid. If you’re making new software, you should likely consult the CISO’s office.
- Informed
-
This is a one-way street. You update these people on project status, and they don’t have a say or a recommendation about the work you’re doing and can’t change it. This category might include the VP of tax so that he’s aware of your project and can look you up when it’s time to determine if he can apply for an R&D tax credit.
In the column headers across the top of the RACI spreadsheet, list who is involved in the project in each of these four ways. To complete the spreadsheet, enter an R, A, C, or I at the cell intersecting which person is assigned that role for that item. Not all of the cells will be filled in. For each work item, you must have exactly one person assigned as accountable for each item. For the other items, at least one person must be assigned to each of the four roles. Typically, there are one or more responsible people, several consulted, and several informed. The completed RACI document looks like Figure 5-2.

Figure 5-2. A typical RACI spreadsheet (source: Wikipedia)
The primary mistake I see people make in RACIs is the temptation to assign multiple people as accountable for a given item. Because the accountable person is typically a VP, or someone with the power to stop or change the definition of that item, or to build the team involved, she must have decision-making authority, and her boss must have the convenience of going to one leader capable of creating the outcome and reporting on progress. Yet assigning multiple accounting parties seems to happen every time people start to make a RACI. Still, you must force yourself and the team to pick only one accountable person for each item. It is tempting to do otherwise because it seems democratic, and multiple stakeholders may have a vested interest in the outcome, or a team may be shared. But it’s likely a sign that you have not defined the task properly. Inspect the task with the team to see if it needs to be recast or split. If upon inspection it truly is the proper definition and level of granularity, and two leaders still seem right, pick the one who has the most control or vested interest in the outcome of that item.
Horizontal Headers
Excel has a feature that every project manager knows, but technologists might not: you can turn your header text horizontal to save space. This little trick compacts your RACI and makes it more readable.
RACIs are very valuable and often underused. On the surface, technologists might view them as too obvious or superfluous to bother creating. They might dismiss the RACI as busy work that doesn’t matter. If you find yourself tempted to do so, I urge you to reconsider and to take the time to create the RACI. You can often get it done in a short time, and you will refer to and refine it throughout your project as things become clearer.
The RACI clarifies the first two of the following key aspects of any project (the last two are represented in the vision and the project plan):
What are we doing?
Who is doing it?
When must we do it?
Why are we doing it?
That’s going a long way for very little investment.
Alignment Meetings
You can use the RACI and the Stakeholder Matrix in a variety of ways. You’ll be surprised how often you return to them and refine them as your project progresses. Their uses include:
-
Performing work streams or creating work breakdown structures
-
Creating the project plan, Roadmap, and backlog
-
Structuring town halls in which you announce the strategy and provide periodic updates
-
Populating invite lists to executive steering committee meetings
-
Informing working group meetings for a specific subset of your project
-
Providing customer forum updates
-
Delivering business updates with vendors and partners
-
Conducting one-on-one meetings with stakeholders
There are numerous variations on RACI, including one from Bain called RAPID. If you feel something’s missing, or are fascinated by the subject, you can read more about it on wikipedia.
Life Cycle Stage
Companies, like living creatures, have a life cycle. They’re created, they grow, they enter maturity, they decline, and eventually they reach the end of life. Every company that exists is at some point within this life cycle.
Companies, like people, stay in these different stages for different periods of time. It’s important for you to know at what stage your company currently is, how long it has been there, and how long you estimate it’s likely to stay there before moving to the next.
The reason this matters is that there are typically different levels of value associated with companies at different points in their life cycle. That sense of value creates a level of willingness to pursue innovation. This is typically very high in the beginning of a company’s life, when it’s trying to create a new product and gain market share or create a market. It’s usually more cautioned and considered in mature companies, and all but absent in companies in decline. Knowing the stage you’re in gives you a sense of how much work you’ll have to do to get something done. It also gives you some guidance on what your tech strategy should be about.
Determining your company’s current stage is easy. If you’re in a public company, you can read the 10-K report. This report is required by the Securities and Exchange Commission and details the financial performance and the outlook for future earning prospects. There are quarterly earnings statements posted, and quarterly earnings calls that anyone can listen to or read transcripts of. This gives you a good idea of where your company might be. What you’re looking for are specific revenue numbers. Figure 5-3 illustrates the basic flow of each stage, but it’s just for rough guidance.

Figure 5-3. Life cycle value stages
The following are some basic guidelines; these are in no way hard-and-fast rules. Companies have hiccups and turnaround efforts, change how they report revenue, and so forth. So you can’t just read one number and know the answer. Longstanding companies can enter dark periods and then get a leader with a different vision and create renewed energy, introduce a great new product, and emerge successfully. So anything goes, but let’s look at some broad categories as a guide:
-
If your company made 5–8% more revenue than it did last year, you may be in a mature company. These companies tend to be well established. They may have long-term customer contracts. They may have saturated market, having sold their flagship product so well that now there’s no one left to sell it to. That means the business will be looking for alternate growth strategies. Its sales pipeline may be dry, and so it may be looking for greater share of wallet—the business term for how much money you’re getting from a customer versus your competitors or other vendors. The company may be looking for ways to cross-sell. In that case, a tech strategy that foregrounds platforms or focuses on stickiness, or quick-win add-ons to the existing product, could be relevant and lucrative.
-
If your company made 8–15%, look at its revenues from the previous years. This could be strong growth, or a sign of slowing down, depending on the charts. This will likely be a soul-searching strategy season for your company in which it must figure out carefully how to position itself for sustained growth. Expect a pivot of some kind, and be sure to stay close to your executives to know how this should inform your technology plans. Expect fluidity and volatility, and ensure your tech strategy aligns with this pivot by focusing on agility in the system, such as microservices or improved Agile development methods.
-
If the company made 20% or more, it’s likely in growth mode. Your strategy might focus on getting to market quickly and strengthening your core. If you have deadbeat products that aren’t performing, do you resurrect them or kill them off? Explore this further in the Core/Innovation Wave pattern (see “Core/Innovation Wave”).
-
A company whose revenues are on a continuous downward trend, or which is growing at 0–5%, is likely in the declining side of maturity. Employees tend to expect a 3% raise every year just for showing up. If your company is growing at 3%, and a primary cost driver is labor, it’s not growing at all. Ask why this is happening. Look at what in your tech product portfolio you can repurpose quickly. To know how to focus your strategy in this case really requires careful planning, and using more of the patterns here to create a more holistic strategy will be important. It will also be important to focus your strategy on cutting costs. However, you must consider how your strategy will positively impact both top-line revenue and bottom-line costs.
Companies with negative revenue growth tend to go into a spiral: they have to cut costs to make up for missing revenue, which leaves no money to innovate, which makes them lose more customers and more revenue. This is a tough one.
If you’re in a private company, leaders tend to be tight-lipped about the financial performance of the company, and it can be difficult to determine what stage you’re in. Consider how long you’ve been in business, ask some executives if they’ll divulge the revenue numbers, especially in comparison with recent years, and have them characterize it.
This is a simple pattern: you determine the life cycle stage your company’s in, and then use the preceding guide to informally consider how should shape your insights and hypotheses. These are some relevant questions you could consider at different stages of the life cycle:
- Introduction
-
Can you expand from one key customer to other customers in the same market? How can you properly time your investments in help so you can grow rapidly without overinvesting? How can you get your name out there and acquire more customers? This is survival mode, and you are all about revenue.
- Growth
-
Here the concerns shift a bit. To grow substantially, you’ll be considering expansions. New market, new products, new customers. This means you’ll need to consider automation strategies, but balance that investment as more opportunities and customer feedback change your product. Do you need to update your product to include more internationalization or localization features? How are you examining your processes for efficiency? How do decisions get made now? Is the culture getting away from you? How can you deal with the fact that “what got you here won’t necessarily get you there”? How can you reuse certain aspects of the business? Have you mastered your product quality? It’s not only about revenue now, but about cost management as well.
- Maturity
-
At this point, a company has significant market share, is a known leader in some area, enjoys recurring revenues from its scaled business model, and can reasonably manage costs. That means it has a target on its back, and a set of existential questions before it: How can it expand into other markets in order to diversify its kingdom? It will have taken some time to reach this stage, and the world has been changing. What are the environmental threats as suggested by a PESTEL (see “PESTEL”)? What substitutes might be introduced, even by a company with no direct aim of toppling you? What competitors are squarely aiming for you and your customers, and what are their methods, and what threats do they present as suggested by the Five Forces (as described in “Porter’s Five Forces”)? How do you stay relevant? Your processes are all in place; your employees, suppliers, and customers have all come to expect certain things; and yet you must in a sense reinvent yourself without losing your ground, to prepare for continued growth and defend against the threats.
Companies can potentially stay at this stage indefinitely, as long as they are sharply focused on operational management. But they won’t grow without doing something different.
- Decline
-
Companies do not have to decline, though of course most do eventually. The companies that cannot find a successful answer to these existential questions of reinvention will enter a death spiral of cost management, which prevents research and development and innovation, which precipitates stagnation and irrelevance, which continues the vicious cycle.
This analysis is but one input of many we’re discussing to help direct how your strategy should be focused, or at least what it should take into account; that’s all.
Value Chain
Competitive advantage cannot be understood by looking at a firm as a whole. It stems from the many discrete activities a firm performs in designing, producing, marketing, delivering, and supporting its product. Each of these activities can contribute to a firm’s relative cost position and create a basis for differentiation.
Michael Porter
In 1985, Michael Porter, whom you met earlier as the father of the Five Forces, wrote a book called Competitive Advantage: Creating and Sustaining Superior Performance, as a follow-up to his 1980 book, Competitive Strategy: Techniques for Analyzing Industries and Competitors (both from Free Press). Both books became classics within management circles and offered a new framework called the Value Chain.
One purpose of the Value Chain is to help you understand where your bread is buttered. That is, it divides the world into value creation and support to illuminate where value is created and where it isn’t. You should be crystal clear on what your company does to create value, what products they sell, and to whom. If this sounds too obvious to say, it’s surprising how this is not always clear, especially depending on your products and industry.
Let’s look at the framework itself, shown in Figure 5-4.

Figure 5-4. Porter’s Value Chain
The image envisions a company as a series of inputs, a transformation at each step, and subsequent outputs along the chain that work together to provide value and realize profit. Let’s unpack each of the five major activities leading to profits:
- Inbound logistics
- Operations
- Outbound logistics
- Marketing and sales
- Service
-
Repairing or correcting or improving the products after they’ve been purchased
You examine each point in the chain to find opportunities for improvement and deliver the maximum value for the minimum cost, and in so doing create a competitive advantage. Businesspeople are used to doing this sort of thing. But if you as a technologist approach your architectures with this in mind, you can create more value for your company.
Maximizing Efficiency
Here are some efficiency questions you might ask yourself:
-
In your software product development, can you reduce debilitating technical debt? Getting some of the cruft out of the way can improve time to market and time to value, as well as reduce what (at software companies, anyway) often amounts to 80% or more of the cost of doing business: human labor.
-
Are there parts of the code or systems architecture you can rework to reduce the server cost? We’ve all seen inefficient, long-running jobs and carelessly written or poor-quality code that spawns a million network messages when smarter code could accomplish the same work more efficiently. I’ve seen code on distributed systems get rewritten and double the throughput on half the servers with a lower network bill. These can be hard to measure based on your tools, but subject matter experts who know the system well will likely have an idea of where to start to sniff out such areas.
-
What are current manual processes that could be automated to reduce the turnaround time, improve quality, or save on human labor that can be used for more creative purposes?
-
Can you use free, open source software in certain places, replacing costly enterprise contracts with their attendant 20% or 22% annual maintenance fees? Or can you use free versions of commercial software such as MailChimp and Google Analytics?
-
Can you digitize outbound logistics with digitized training or delivery methods? Can you improve tracking and customer transparency? Can you create automated agents or assistants to bring more transparency or put more power in the hands of customers?
-
Can you reduce travel costs through digital or virtual applications, or free applications such as Skype, Hangouts, or FaceTime?
-
Can you reduce service costs and turnaround by designing and architecting your products in a more modular way, like Canon did?
-
Does this step truly add in your value proposition and market differentiation? If so, keep it in-house and become expert at it. If not, consider outsourcing or contracting. (For more on this difference, see the “Core/Innovation Wave”.)
-
Can you separate true needs at each step versus perceived needs? Sometimes inefficiencies leak in because “that’s how we’ve always done it.” Are there “entitlements” that have built up over time as what were once nice-to-haves became expectations, resulting in false requirements?
-
Can you use the cloud or Software as a Service in new ways? If you migrate to the cloud, can you foreground automation to turn servers on and off, particularly in nonproduction environments, so that you aren’t paying for what you’re not using? Can you be sensitive to transferring capital expenditures (capex) to operational expenditures (opex)?
-
Are there places where process participants can collaborate better, or collapse several steps into a few?
-
Are there redundant or legacy versions of products you can consolidate or kill off and offer lagging customers an alternative?
-
Can you organize your applications into services to reduce the likelihood of redundant, inefficient code?
Maximizing value
Similarly, at each point there are some value-related questions you can ask, based on the type of value that technologists can offer:
- Sustain the value
-
Running current business operations, and providing the systems, applications, plumbing as requested. There’s value in email and office software that we surely would feel if it left us. But the problem is that this is where we typically focus, and no one cares about it until it breaks. This is the preventative and regular maintenance category.
- Maximize value
-
Finding places to create value in current systems; doing the same things better.
- Discover value
-
Inventing new things of value. Can we provide new markets, new products, new channels? Can we discover Post-it notes in the lab while trying to do something else?
As usual, the way to approach this is by making a terrific analysis list as described in Chapter 2.
Supporting Functions
There are supporting activities as well—those necessary evils for a company of any size, like HR and the IT folks. Porter leaves out some obvious things, such as Legal, which could be a sizable, or at least powerful, portion of your company and even have some nontrivial impact on the Value Chain (I can think of a few large enterprise software companies for whom this is true. Some even make money suing their own sales reps.) So this kind of diagram sort of fails our prized MECE test (see “MECE”), but we can let that go.
The supporting functions, since they do not directly create value or competitive advantage, are more frequent candidates for cost-cutting measures than value-maximizing measures. For instance, look at how you can automate or outsource tax preparation and invoicing. Check with your legal team about upcoming contract renewals to see if there are less expensive but still effective options.
Applying the Value Chain
A second purpose of the Value Chain is to help provide you a handy list of each of the key processes to check to determine where you can create more value, gain higher margin, create a differentiating advantage, and cut costs.
Here’s how I suggest using it:
-
Treat it as a high-level checklist to establish a baseline understanding of what your business unit does, as a reminder to yourself to not leave any of these process points unaddressed in your technology strategy. Of course, depending on the challenge you’ve been posed, certain areas will be more or less relevant.
-
Determine the owners or some knowledgeable, communicative person within each of these areas to determine how it works, where it sees advantage, and where it needs help. Consider each in terms of people, process, and technology.
-
Consider and identify specific ways that your technology strategy can directly improve costs, improve margins, or add to profitability for each of the points in the process. Map technology recommendations to each.
You may wonder about technology being relegated to a support function. In 1985, the web didn’t yet exist, so we can still interpret the Value Chain chart pictured earlier as relevant today. In a software product company, we can think of operations as the function that makes the product, with technology still existing as it does on Porter’s chart as a support function in the form of the back office and plumbing.
Revenue diversity
But the larger the company, the more diverse it will be, and it will have its hands in many cookie jars, making money in a variety of ways—even within a single division. We all are familiar with Pepsi, and think of it as a soft drink maker. It’s easy to assume all the money comes from Pepsi cola. But the company also owns Tropicana and Gatorade and partners to sell the ready-to-drink beverages you buy from Starbucks (which, by the way, owns a record label), and Lipton tea, and Stolichnaya vodka. Yet, in the last decade, despite how Pepsi might be thought of in the popular imagination, beverages accounted for only 50% of PepsiCo’s revenues. Pepsi also owns Quaker Oats (which also sells Rice-a-Roni and Cap’n Crunch), has had numerous restaurant chains like California Pizza Kitchen, and acquired Wilson Sporting Goods equipment company in 1970, and even owned North American Van Lines.
Did you ever see the movies Stripes, Ghostbusters, Karate Kid, or Tootsie in the 1980s? They were produced by Columbia Pictures in the five-year period that the movie studio was owned and run by none other than…the Coca-Cola Company.
The candy company Mars ran a company called Chappell Brothers. You may not have heard of them: they make dog food. But that shouldn’t be surprising given that Nestle, whom you probably think of as a chocolate bar company, owns Purina, one of the largest pet food manufacturers in the world, and has a significant stake in L’Oreal, the makeup company. In fact, Nestle has over 8,000 brands.
What about Proctor & Gamble? In 2014 it announced that it was selling off 100 brands in order to focus on its remaining 65 brands, which represented 95% of the company’s profit. That’s a lot of brands, and a lot of money concentrated in only 39% of the company (recall the Pareto rule from Chapter 2).
But such revenue diversity is not the sole domain of conglomerates. We think of hotels as selling hotel rooms. While of course that’s true, most higher-end hotels typically make only half their money on selling hotel rooms, with the rest coming from restaurants, meeting rooms, convention fees, tee times, spas, and the like. Many hotels in Las Vegas sell the room for very cheap or even give it away for free, because the bulk of their revenue comes from gambling.
And these things change and shift with differences in consumer trends and competitive forces. According to a Bank of America report, in 1990 nearly 65% of revenue in Las Vegas came from gambling. Twenty years later, a Business Insider article reported that 65% of its revenue came from nongaming sources, such as shopping and restaurants.
Companies enter joint ventures, partnerships, agreements, and licensing arrangements. If you think you know how you get paid in your company, I urge you to investigate and dig deeper to really find out all the sources of revenue. Only then can you understand all the sources of value creation in your company and how to account for them in a supporting architecture. You might build a set of different microservices or design a data model differently if you understand these aspects of your business.
Then there’s the other side of the coin: things companies do strategically but that don’t have clear revenue streams yet. These can matter tremendously. At the recent O’Reilly Artificial Intelligence conference in New York City, a Google executive stated quite plainly, “Google is an AI company, full stop.” We think of Google as making money through selling ads (since even in recent years that’s where $80 billion of its revenue comes from, with all its other products and businesses generating only $10 billion altogether). Of course there is a plan there, and it’s holistic. All those other businesses feed Google the data it needs for its current and future AI work. Waymo, the division within Google for autonomous vehicles, is projected to add as much as $40 billion to Google’s top line by 2025.
So companies are more diverse than they may at first appear, and place a number of bets—some of which they expect to pay off long-term, and some more near-term. Understanding the ecosystem within the Value Chain is helpful to the business-minded architect. I once created an architecture that probably wasn’t the optimal design for a particular system, because I was too focused on the technology and thought of one company in particular as a big competitor. That was true, but unbeknownst to me, that company was also our partner in a joint venture arrangement little known outside the executive team. Had I been aware, I would have made different technology choices. Since then, I do my best to know where our bread is buttered and make the architecture decisions and technology strategies accordingly.
The Value Chain is intended to be used within a single business unit or division, to keep things coherent. But you can also apply it within a department, depending on the level of analysis you’re performing and for what purpose. But Porter’s statement from the epigraph at the beginning of this pattern doesn’t preclude us from using the Value Chain breakdown at the global level, the industry level, the corporate level, or the department level. We are not business professors. People get entire PhDs on the idea of Value Chains. People can get incredibly nerdy about this stuff. If you want to be nerdy about Value Chains, you’re welcome to read Porter’s 600-page book and its companion volume, which is a slimmer 400 pages. For us, it’s just a picture. And that’s just fine. We needn’t adhere to the strict dicta around the use of a tool like this. Think of it instead as a good reminder of all the different areas of your division to tour. Your strategies will be more holistic, more pertinent, and more impactful if you are sharply focused on real business problems and creating value, and see many opportunities to do so.
Getting your baseline metrics
One final but critical point: you need to get a sense of the relevant costs in each of these areas. Take a baseline and know where you’re starting from. That way, after your new solution is implemented, you’ll be able to measure and demonstrate the costs reduction you created. This will be an important metric to have in your back pocket, not only so that you understand how effective your solutions were, but so that management knows that too.
The Process Posture Map (see “Process Posture Map”) will help you with the Value Chain.
Growth-Share Matrix
The Growth-Share Matrix is also known as the “BCG Box.” It was created by Bruce Henderson in 1970 for the Boston Consulting Group. It was intended as a tool to help companies analyze and manage their portfolios. Its purpose is to help companies allocate resources.
Here are the four quadrants. Depending on the size of your company, this matrix can be used to view products in your portfolio or entire business units:
- Cash cows
-
These have low growth but high market share. These are your successful, mature products in an established industry and mature market. You milk them for the cash they consistently bring, and they’re fantastic because they don’t cost much to keep running. You don’t want to invest much in these products, because the opportunity for further growth is limited if the market is not growing. You won’t see a great return on additional money, even though these products are cherished. These parts of the business tend to be used to fund innovations or startup areas in the business.
- Question marks
-
These are the problem children. The market is growing, but this product has low market share. These are typically young products or startups. You must ask why they are not more successful. Do they just need more time, is the market too crowded, has a competitor gained on you with better features or stability, are customers not interested in your product, or have substitutes emerged? The job here is to determine how to turn them into stars by getting more share. This usually requires big investments and can be a tough decision. If after years of investing they can’t grow, they become dogs. So these are the ones to focus your analysis on.
- Stars
-
These products enjoy high market growth and high market share. They’re big and getting bigger. These are where you invest and protect. But continuing growth requires continuing capital investment. Your hope is that you can dominate the market and these become cash cows.
- Dogs
-
These products have low market growth and low market share. Stop investing and retire them.
The Growth-Share Matrix is shown in Figure 5-5.

Figure 5-5. The Growth-Share Matrix
Generating the Growth-Share 2×2
You should just keep a template around for making these since you’ll do it with some frequency. That’s because executives and business strategy consultants simply adore these kinds of four-quadrant overlays on scatterplots. If you are attacked by a wild strategy consultant, do not run: simply show him a PowerPoint slide with a 2×2 matrix on it, and he will be instantly absorbed and begin looking for holes to poke in it, giving you time to escape. (See the note in “Stakeholder Matrix” for a quick way to generate the 2×2 for this and similar matrices).
You can use this matrix in your portfolio planning and strategy season exercises. You should at the least be aligned with the strategy team on the placement of the applications. Do not make grandiose plans to make a lot of upgrades and feature enhancements in dogs.
The Growth-Share Matrix is a very familiar tool to many businesspeople. If you don’t spend too much time on it or treat it too seriously, it makes a nifty way to visualize where to focus your time and attention in a product management Roadmap.
Core/Innovation Wave
As shocking as it may be to hear, people don’t always automatically agree on what projects to fund and how much to fund them. Arriving at the answers for what systems, products, and projects to fund; what features to pursue; and how much of the pie each item should get is hard to determine and can be highly contentious. These matters are debated by product management, product development, architecture, strategy, IT, business operations, and finance, of course with a breezy executive dropping an occasional bomb on the proceedings on the order of, “Oh, didn’t I tell you? The leadership team just decided to move all the operations to the moon. Can you redo everything with that in mind?”
The process is sometimes fraught with ego and emotion. Worse, it’s played as a zero-sum game: if you get that $10 million, then that’s $10 million less for my project.
To create a modicum of order, the strategist will look for a list (or better, a 2×2 grid) to diffuse the intensity and bring data to bear. Enter the Core/Innovation Wave. This tool was shown to me by Sabre Hospitality Chief Strategist Balaji Krishnamurthy.
This pattern is useful if you’re considering a set of future projects, and you aren’t sure which ones to pursue or ask for funding for. Sometimes you want to get a quick idea of how complex it might be to do something. If it’s far from your core business or most mission-critical systems, then it may be something you’re not mature in, don’t understand well, and will need more time or more funding to pursue properly. This is even more true if the project you’re considering represents creating something entirely new to the world or to your organization.
During strategy season in late spring, you can use the Core/Innovation Wave as a planning tool to assist you in envisioning where the applications in your portfolio lie with respect to two key vectors: proximity to the core and innovation (see Figure 5-6). It’s useful in conjunction with an Ansoff Growth Matrix (see “Growth-Share Matrix”) and an Investment Map (see “Investment Map”) and Application Portfolio Management (see “Application Portfolio Management”).
Proximity to the core refers to how close this proposed project, acquisition, product, or feature is to your main business or your key applications. Proximity to the core means how mission-critical the application is to your division and your customers. How much revenue is generated by each application today, and how much revenue is expected to be generated? How much other stuff does it enable? The ones with the most are your core products.
The x-axis is Innovation: Does this feature already exist entirely, or a little bit but it needs modification, or not at all? How differentiating is it with respect to enabling your future? Like babies, innovative young projects need far more nurturing than they can give in return. Moreover, you will have a harder time reaching new customers, accessing new markets, and doing things differently.
Figure 5-6. Core/Innovation Wave
To use the tool, get a list of your applications, the companies you’re considering acquiring, or the projects you’re considering asking the board for funding to do. In the figure, the dots represent the scatterplot for each application or proposed product or proposed acquisition or activity. Consider them across these two axes.
You can use a chart such as this to score each item as shown earlier. When you’re done, layer over the waves to tag the priority level of the funding each should get, with a bias toward those in the upper right: these are the ones that are most innovative and closest to the core of your business.
The “waves” are meant to help you sort out your bubbles into general categories. For things that are close to the core and not innovative, you likely have many maintenance teams already working on them. You can staff those differently than innovative work that has little customer-facing, revenue-generating impact. You will need to fund that to ensure proper maintenance. The risk profiles are different, and the pioneering mindset, attitude, and maturity and talent of the individuals needed will be different.
You can also use this to help visualize a timeline projection, to help the executive and your teams talk with customers and present to their management. What work you will do in the next year? Next two or three years? It helps them start to conceptualize what the opportunity size might be, and why they should care.
Used in an executive slide, this chart can provide a wonderful opportunity for them to ask questions, understand broader strategic alignment, and see where your Roadmap is headed. You can show a set of pursuits you want to make in acquiring new technology companies to add to your platform.
It’s easy to get this done quickly, and use that as input to a more detailed Roadmap planning session with development management.
Note that you don’t have to use this tool only in strategy season once a year for big budget asks. The Wave also helps you sort other aspects of how to staff projects, and how much architectural attention to give them. You can use it just within your architecture team to determine where, and how extensively, you need to write architecture definition documents (see “Architecture Definition”) to support dev teams, or otherwise make specifications about toolsets and understand the emerging tech.
You can also use it within a project team. As with many patterns here, you can consider this a fractal, and use it to help prioritize the work of your Roadmap within a single project or system. When you’re triaging features, which happens frequently, this can help you assign management or other oversight of the work, and determine places where you can try out new technologies or may need more time (if something is innovative and close to the core).
As management, you may look at items that are very innovative and see if you can carve out 5–10% of the team for some R&D work, and not load them up with commitments on the daily Roadmap. Otherwise, don’t expect the items to get addressed.
Don’t use this pattern on its own. Use it in conjunction with the Growth-Share Matrix and Investment Map. The Wave alone won’t make any decisions for you. But it will help frame the conversation as you have the budget planning and trade-off discussions, and will help you communicate easily to executives within the deck you’re building.
Investment Map
You can’t do everything at once, and you can’t invest equally in All The Things. You must prioritize.
The Investment Map isn’t so much about money as offering a simple lens for the executive to view, in a quick and easy way, her portfolio of applications plotted against how you are thinking of planning the next year or so of work. It marries your current application set along with your emerging, innovative ideas for where you think the Roadmap should go. It will spur terrific conversations between product management, strategy, product development, and architecture about where your tech organization’s focus should be.
The purpose of the Investment Map is to help you temper and balance the exciting, cool things that you want to do, the level of difficulty and preparedness you’ll need to pull them off, how ready you hypothesize (see “Hypothesis”) the market is to receive them, and how big the barriers might be.
Here’s the process to create the map:
-
In a spreadsheet, list the items in your portfolio and list the ideas you have for work you want to do to create new products, enhance existing ones, or try a new technology. This could include major architectural changes to key systems that might require a project to complete.
-
Score them according to the two key vectors: how difficult will it be to do that item, and how ready, right now, are your current customers and the market you’re serving in general?
-
Generate the 2×2 matrix and label the quadrants.
-
Use it as input to team conversations, Roadmap planning, budgeting, and prioritizing.
- Add it to a slide in your burgeoning Strategy Deck.
The result of this exercise will look like Figure 5-7.

Figure 5-7. The Investment Map
The first vector is how hard or easy something will be to do (which can include its novelty, risk, complexity, level of effort, budget requirement, number of critical unknowns, and so forth).
The second vector is how ready your customers are to receive it. For example, years ago a number of the big hotel chains wanted to add digital keys that could be sent to guests’ mobile phones on check-in. There were two barriers: the guests weren’t ready, and their franchising customers weren’t ready. There were some startups that offered this tech. But it was new, so it didn’t work perfectly. If a game on your phone doesn’t work, you can just turn it off. If you can’t get into your hotel room, that’s a bigger problem. Market research revealed that there weren’t enough people with smartphones—sure, tech company executives all had them as early adopters and could afford them. Even today, only 75% of Americans have a smartphone of any kind. But nearly everyone has to stay in hotels, and phones run out of juice, so you’d need the regular door lock anyway, which is expensive to hoteliers. So the idea, even though it was a good one and continues to trickle into the market today, was incredibly slow to catch on. A sizeable, pioneering investment here would have been a mistake, as neat as the idea was.
The Investment Map works great in concert with Growth-Share Matrix/BCG Box and the Core/Innovation Wave. You want to consider these during strategy season, and budget season, and Roadmap planning season. You might update this twice per year.
I won’t belabor this tool further since it’s not likely going to be used every day, and by now generating 2×2 matrices should be old hat for you. It’s just a handy, easy way to help drive general direction for both your current portfolio and future-oriented ideas.
Summary
In this chapter, we reviewed several patterns at the corporate or business unit level:
-
Stakeholder Alignment (see “Stakeholder Alignment”)
-
RACI (see “RACI”)
-
Life Cycle Stage (see “Life Cycle Stage”)
-
Value Chain (see “Value Chain”)
-
Growth-Share Matrix (see “Growth-Share Matrix”)
Core/Innovation Wave (see “Core/Innovation Wave”)
Investment Map (see “Investment Map”)
In the next chapter, we’ll examine just a few quick patterns with a tighter focus: the departmental or organizational level within your company.
1 This phrase is from “Something Identifies You” by Peruvian poet César Vallejo: “Something separates you from the one who remains with you, and it is your common slavery to depart: thus, your meagerest rejoicing.”