
3
Common Tools and Frameworks
Every test automation engineer or SDET will have to take advantage of existing tools to build and maintain automation frameworks. For most common use cases, teams could benefit immensely by making use of a plethora of tools and libraries to suit their needs and deliver top results. We introduced test automation and the considerations for devising an effective strategy in the previous two chapters. This chapter will equip you with practical insights and steps to use the command-line interface (CLI) and Git, which are basic skills needed for any test engineer.
We will also touch upon a variety of test automation frameworks and their architecture. This will give you a flavor of different frameworks, their primary purposes, and their benefits. The tools selected for our review here are some of the most commonly used in the market, at this time, and can be applied to different kinds of testing.
The following are the main topics we will be looking at in this chapter:
- The basic tools for every automation engineer
- Common test automation frameworks
- Choosing the right tool/framework
Technical requirements
In this chapter, we will be looking at working examples of the CLI and Git. We will be using the Terminal software on macOS for our examples in both sections. Windows users can use the in-built PowerShell to execute these commands.
The basic tools for every automation engineer
One of the primary tasks of a test automation engineer is to create, edit, or delete code daily. Test engineers will often also have to interact with the shell of the system under development to tweak their test environments or the underlying test data. In this section, we will be covering a few basic commands that test engineers will need to be able to access the source code and navigate the system under test. This section is a quick refresher for readers who are already experienced in the software engineering space, and can help to build a good foundation for beginners.
Let us start by looking at the CLI.
The CLI
The CLI is a means to interact with the shell of the system under test. A lot of the tasks performed through the graphical user interface can be done through the CLI too. But, the real might of the CLI lies in its ability to programmatically support the simulation of these tasks. Let’s try and get familiar with a few basic CLI commands. The CLI commands covered in this section can be run on Terminal software on macOS, or PowerShell on Windows:
- The ls command lists all the files and directories in the current folder:
➜ls
The output to the preceding command should be as follows:
test.py test.txt testing_1 testing_2 testing_3 testing_4
➜
- The cd command stands for change directory and is used to switch to another directory. The cd .. command navigates to the parent directory.
The syntax is as follows:
cd [path_to_directory]
The command and output should be as follows:
➜cd testing_1➜ testing_1 cd ..
- The mkdir command creates a new directory under the current directory.
mkdir [directory_name]
The command and output should be as follows:
➜mkdir testing_5
➜ls
test.py test.txt testing_1 testing_2 testing_3 testing_4 testing_5
➜
- The touch command creates a new file in the current directory without a preview.
The syntax is as follows:
touch [file_name]
The command and output should be as follows:
➜ touch testing.txt
➜ls
test.py test.txt testing.txt testing_1 testing_2
testing_3 testing_4 testing_5
Note
Windows PowerShell users can use ni as touch is not supported.
- The cat command allows the user to view file contents on the CLI.
The syntax is as follows:
cat [file_name]
The command and output should be as follows:
➜ cat vim_file
This is a new file
➜ cli_demo
So far, we have looked at how to create and modify files. Next, let us look at the commands for deleting files and folders:
- The rm command can be used to delete folders and files. Let us look at some specific examples of how to go about this deletion.
To remove a directory and all the contents under that directory, use the rm command with the –r option.
The syntax is as follows:
rm –r [directory_name]
The command and output should be as follows:
➜ ls
test.py test.txt testing.txt testing_1 testing_2
testing_3 testing_4 testing_5 vim_file
➜ rm -r testing_1
➜ls
test.py test.txt testing.txt testing_2 testing_3
testing_4 testing_5 vim_file
➜
- To delete the file(s), the same rm command can be used followed by the filename.
The syntax is as follows:
rm [file_name]
The command and output should be as follows:
➜ cli_demo ls
test.py test.txt testing.txt testing_2 testing_3
testing_4 testing_5 vim_file
➜ cli_demo rm test.txt
➜ cli_demo ls
test.py testing.txt testing_2 testing_3
testing_4 testing_5 vim_file
➜ cli_demo
Next, let us quickly look at Vim, which is a commonly used file-handling tool for the CLI.
Working with Vim
Vim is an in-built editor that allows you to modify the contents of a file. Vim aims to increase efficiency when editing code via the CLI and is supported across all major platforms, such as macOS, Windows, and Linux. Vim also supports creating custom keyboard shortcuts based on your typing needs. Let’s look at a basic example of editing and saving a file. This editor supports a wide range of commands and can be referenced at http://vimdoc.sourceforge.net/. To edit and save a file, you need to do the following:
- To execute the editor, the user has to type vi, followed by a space and the filename:
workspace vi test.txt
- Then, type i to switch to INSERT mode and type in the contents of the file.
- Press the Esc key to quit INSERT mode.
- Next, type :wq to save and exit. This command is a combination of :w to write the contents of the file to the disk and q to quit the file.
- Then, press i to enter INSERT mode and type the required contents in the file.
The CLI commands we have looked at so far should serve as a good starting point for new users. Now, let us familiarize ourselves with flags in the CLI.
Flags in the CLI
Flags are add-ons to enhance the usage of a command in the CLI. For example, the –l flag can be applied to the ls command to alter the displayed list of files and folders in a long format.
The syntax is as follows:
ls –l
The command and output should be as follows:
➜ls -l
-rw-r--r-- 1 packt staff 0 Jun 25 09:33 test.py
-rw-r--r-- 1 packt staff 0 Aug 14 18:14 testing.txt
drwxr-xr-x 3 packt staff 96 Jun 26 10:20 testing_2
drwxr-xr-x 2 packt staff 64 Jun 25 09:32 testing_3
drwxr-xr-x 2 packt staff 64 Jun 25 23:16 testing_4
drwxr-xr-x 2 packt staff 64 Aug 14 18:13 testing_5
-rw-r--r-- 1 packt staff 19 Aug 14 18:26 vim_file
➜
There are thousands of flags that can be attached to various CLI commands, and it is impossible to know all of them. This is where the man command comes in handy. man can be used with any CLI command, and it gives all the options and an associated description for each command. There are usually multiple pages of help content and you are encouraged to browse through them.
For example, to learn all the information associated with the ls commands, you just have to run the following command:
man ls
There are a few tips/tricks to keep in mind regarding CLI usage, such as the following:
- All the CLI commands are case sensitive
- The pwd command lists the current working directory
- The clear command clears the contents on the current shell window
- The up/down arrow keys can be used to navigate through the history of the CLI commands
- The Tab key can be used to get autocomplete suggestions based on the string typed so far
- The cd – and cd ~ commands can be used to navigate to the last working directory and home directory, respectively
- Multiple CLI commands can be run in a single line using the ; separator
The power of shell scripting
The ultimate utility of the CLI lies in writing automated scripts that perform repeatable tasks. Shell scripting can be used to achieve this and can save you a great deal of time. Users are encouraged to refer to the full documentation at https://www.gnu.org/software/bash/manual/bash.html to learn more about commands and their syntax. To understand the power of the CLI, let us look at an example of a shell script in this section. This script creates a folder, named test_folder, and then creates a text file, named test_file, within it. The script then uses the curl command to download a web resource that is passed as an argument and stores its output in test_file.txt. Now, $1 refers to the first argument used when invoking this file for execution. -o is used to override the contents of the file. Then, it reads the file using the cat command and stores it in a variable named file_content. Finally, this file is removed using the rm command:
#!/bin/bash
mkdir test_folder
cd test_folder
touch test_file.txt
curl $1 -o test_file.txt
file_content=`cat test_file.txt`
echo $file_content
rm test_file.txt
This script can be executed using the bash sample_bash_script.sh https://www.packt.com/ command, where sample_bash_script.sh is the name of the file. Please note that the web resource here can be downloaded at https://www.packt.com/ and that it is being passed as the first argument to the script.
We have just gotten a bird’s eye view of the CLI, and I strongly encourage you to dive deeper into CLI commands to increase your proficiency. Some major advantages of using the CLI include the following:
- Speed and security: CLI commands are faster and more secure to use than the corresponding actions being done through the graphical user interface.
- Scripting on the CLI: The CLI lets users write scripts to perform repetitive actions by combining them into a single script file. This is much more stable and efficient than a script run on a graphical user interface.
- Resource efficient: CLI commands use much fewer system resources and therefore provide better stability.
Now that we have familiarized ourselves with the CLI, let us look at another tool that is an absolute necessity for the maintenance of a software project of any size.
Git
Git is a modern distributed version control system that allows tracking changes to the source code and is a versatile tool to enable collaboration in the engineering team. Git primarily helps in synchronizing contributions to source code by various members of the team, by keeping track of the progress over time.
Every software application is broken down into code repositories and production code is stored on a branch called master on the repository. When an engineer is ready to begin working on a feature, they can clone the repository locally and create a new branch to make their changes. After the code changes are complete, the engineer creates a pull request that is then peer-reviewed and approved. This is when they are merged into the master branch. Subsequently, the changes are deployed to the staging and production environments. There are various hosting services, such as GitHub, that provide a user interface to maintain, track, and coordinate contributions to the code repositories. Now, let us look at some of the common Git commands that test engineers might have to use frequently:
- git --version shows the version of Git software installed on the machine:
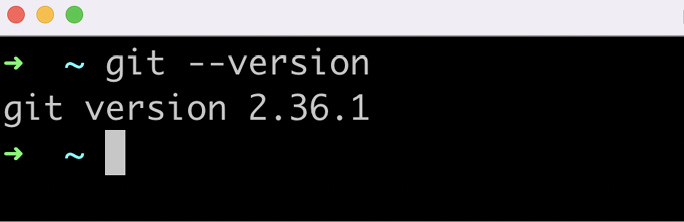
Figure 3.1 – git version
- git init initializes the project folder into a GitHub repository:

Figure 3.2 – git init
- git clone [repository_URL] creates a local copy of the remote repository:

Figure 3.3 – git clone

Figure 3.4 – git push
- git pull pulls all the latest code from the remote branch and merges them with the local branch:

Figure 3.5 – git pull
- git log lists the entire commit history:

Figure 3.6 – git log
![Figure 3.7 – git branch [branch_name]](https://imgdetail.ebookreading.net/2023/10/9781804615492/9781804615492__9781804615492__files__image__Figure_3.7_B19046.jpg)
Figure 3.7 – git branch [branch_name]
- git branch lists all the local branches created so far. * indicates the branch that is currently checked out:

Figure 3.8 – git branch
- git branch –a lists all the local and remote branches created so far:

Figure 3.9 – git branch -a
- git checkout [branch_name] switches between local Git branches:
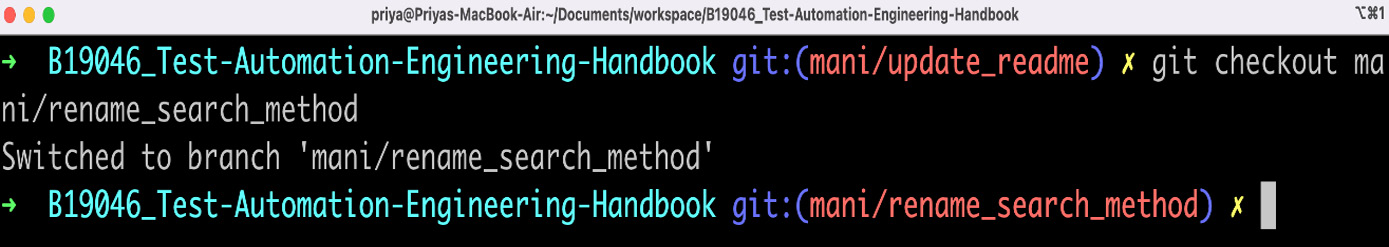
Figure 3.10 – git checkout

Figure 3.11 – git status
- git diff shows the difference between files in the staging area and the working tree:

- git add . adds all the modified files to the Git staging area:

Figure 3.13 – git add
- git commit –m "commit description" saves the changes to the local repository with the provided description:

Figure 3.14 – git commit
- git branch –D [branch_name] force deletes the specified local branch.
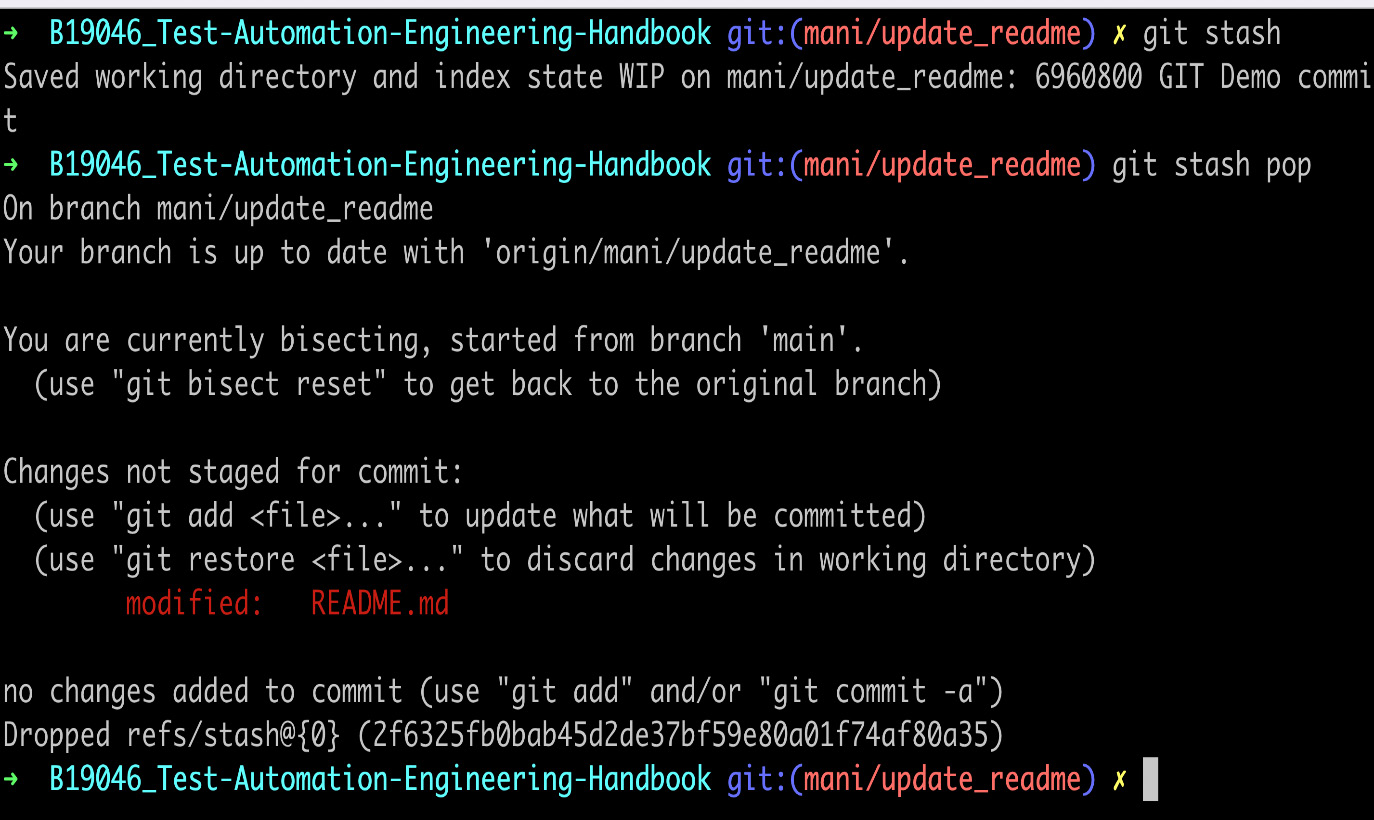
- git stash temporarily removes the changes on the local branch. Use git stash pop to apply the changes back onto the local branch:
- git remote -v gives the name, as well as the URL, of the remote repository:

Figure 3.16 – git remote
This overview provides you with a healthy introduction to Git and its most commonly used commands. You can explore additional commands and their usage here at https://git-scm.com/docs/git. Next, let us dive into some of the most commonly used test automation frameworks.
Common test automation frameworks
Test automation frameworks are a collection of tools and processes that help standardize the test automation effort. They act as technical guidelines for any test implementation. We touched upon the importance of test automation frameworks in Chapter 2, Test Automation Strategy, in devising a sound test strategy. In this section, we will look at a selection of frameworks that assist in diverse kinds of testing. For each of these frameworks, we will try to understand their high-level architecture and the primary purpose they serve. In the subsequent chapters of this book, we will implement automated test cases using most of these frameworks. You should note that there is a whole array of effective test automation tools available on the market to serve specific organizational needs. For example, Playwright and Puppeteer are often considered to be modern alternatives for Selenium. The goal of this section is to equip you with knowledge about the basic architecture of some of these tools so that you can explore the other options further in detail.
To assist with our understanding of these frameworks, let us use a hypothetical banking loan application with frontend built-in ReactJS, and a backend comprising REST APIs. Let us ignore the database calls and other external integrations for simplicity. Figure 3.17 depicts this application with three pages in the frontend of applying for a loan, managing existing loans, and making payments. The backend comprises multiple REST APIs to support the frontend transactions. Let us also assume that Bank XYZ has mobile applications supported in iOS and Android platforms for these transactions. Let us look at how these frameworks can be used to test these applications in the upcoming sections.

Figure 3.17 – Example loan application
Let us jump right into exploring Selenium.
Selenium
Selenium is an open source tool that provides an interface to automate user actions on web browsers. Imagine a manual tester that must test the login page of an application. There are a variety of scenarios that can be run such as validating various kinds of inputs, empty fields, and incorrect entries. This must be done across multiple browsers such as Chrome, Firefox, and Safari. Also, whenever there is a code change that impacts the login page, these tests must be repeated. Even though this is a simple scenario, in the real world, the efforts involved to test and keep retesting the changes can compound swiftly. When we apply this logic to testing the business flows of a complex enterprise application, modern software engineering teams simply do not have the capacity to scale the manual testing. This is where Selenium can turbocharge browser testing, helping software engineers and product teams tremendously.
Components of Selenium
At a high level, Selenium has three components that help create and orchestrate the tests. Let us look at each one of the following components:
- WebDriver: WebDriver is a critical component of the Selenium ecosystem that is responsible for executing the tests by invoking browser-specific drivers. WebDriver comes with an API that uses bindings to support various programming languages, such as Python, Ruby, Java, and C#. WebDriver hosts the API and bindings as a common library. WebDriver also includes support for various integrations, such as Cucumber and TestNG.
- Grid: Grid is a server that helps minimize test runtime by routing and balancing the test commands across multiple remote browser instances. It consists of a hub and a node, which handle the requests from the WebDriver and execute them on a remote WebDriver on a different device. Grid can be configured to dynamically scale to suit the test runs.
- IDE: The IDE is a record and playback tool that comes as a plugin on Chrome and Firefox. Users can enable the plugin on the browser and record transactions. The IDE internally generates the code in the supported programming languages based on the setting. This code is usually not reusable, and hence is not advised for bigger projects. This works well for quick checks.
In the next section, we will explore the high-level architecture of Selenium.
High-level architecture
We looked at how WebDriver orchestrates the call to execute tests on the browser in Chapter 2, specifically the The Factories pattern section. Here, we look at the illustration again in Figure 3.18. The test script initializes WebDriver, which sends the commands to the local browser instance. The driver executes the commands on the browser instance.
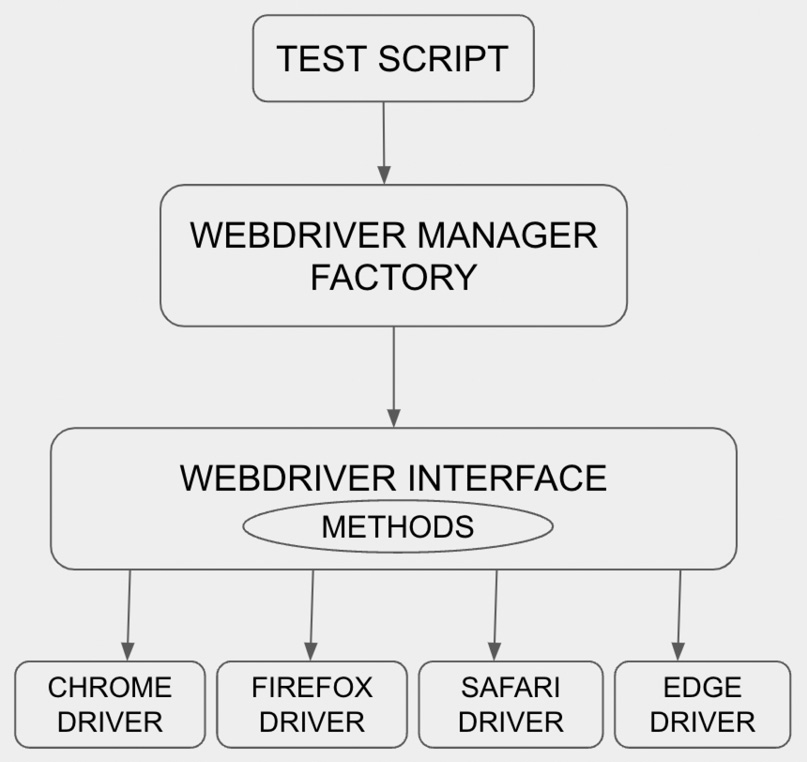
Figure 3.18 – Visual representation of how a test script utilizes a factory method to initialize and use the drivers
In cases where parallel test runs are required, the hub orchestrates the requests from a client and spreads them across multiple devices containing remote web drivers, as shown in Figure 3.19. A remote WebDriver instance has two internal components: a client running the test script, and a server to run the test on a remote device.

Figure 3.19 – Components of Selenium Grid
Selenium is very flexible in its setup, and hence it’s very popular among test and software engineers. Most browsers today have built-in support for Selenium testing, making it a very handy tool. Like any other open source tool, Selenium depends on community contributions for support through third-party libraries. Since it was open-sourced more than a decade ago, there have been continuous improvements done by users. The Selenium project can be found at https://github.com/SeleniumHQ.
Now, for the testing of our hypothetical banking application, Selenium can primarily be used to verify frontend aspects. We should be creating page object models for each of the pages and capturing UI elements using appropriate selectors. Then, we need to create a script to load the URL of the application and verify the flow along with the interaction of these elements. Scripts should also be set up to create the drivers and execute them on various browsers.
Even though Selenium is multi-faceted in browser automation, it lacks depth in supporting mobile-native applications. In the next section, let us look at Appium, which is a specialized tool for automating mobile-native applications.
Appium
Appium is an open source tool used for automating tests on platforms such as Android and iOS. It also supports mobile browser automation with extensive community support. Appium provides libraries backing a variety of programming languages, such as Java, Python, PHP, C#, JavaScript, and Ruby. Before diving into Appium’s architecture, let us look at the distinct kinds of mobile applications:
- Native apps: These are apps written on Android and iOS platforms that can be interacted with only after complete installation on the device
- Hybrid apps: These are apps that can be installed on the device, as well as accessed through a browser URL
- Web apps: These are apps that can be used only via a mobile browser
Appium offers a single API that can be used to write tests across all these platforms and greatly enables the reuse of test code. Now, let us look at what Appium comprises.
Components of Appium
Appium is primarily made of three components:
- Appium Client: Appium Client is the test script written to validate the logic of the mobile/web application. It also includes the detailed configuration used to access the various mobile platforms. Appium Client comes with libraries, with support for a wide variety of programming languages.
- Appium Server: Appium Server is the component that interacts with the client and transfers the commands to the end device. It is written in Node.js and parses the request from the client into a JSON format and relays them to the devices or an emulator.
- Device/emulator: These are mobile devices or emulators on which the test code sent by the Appium client is executed by the server.
Next, let us look at the architecture of the inner workings of Appium.
High-level architecture
As seen in the previous section, Appium is built on a client-server architecture. As shown in Figure 3.20, it comprises an HTTP server written on Node.js. Appium Client communicates with the server using RESTful APIs through MOBILE JSON WIRE PROTOCOL.

Figure 3.20 – Appium architecture/components
It is vital to know that Appium uses Selenium WebDriver commands to interact with the mobile interface. Appium Client libraries convert the test code into REST API requests and establish a session with the server. These requests are then forwarded by the server to the devices/emulators. Appium Client and the server use this session ID as a reference for their communication. Apple and Android devices have their own APIs to expose the UI elements on their devices. Appium interacts with these elements by sending JSON commands to these APIs.
For testing our hypothetical banking application, we would first set up the Appium server and add platform-specific configuration to support iOS and Android applications. We would also set up virtual devices with an appropriate version of the OS on emulators. With both the emulators and the Appium server set up, we can create and execute test scripts to validate the UI elements from the mobile application. We could also perform a similar configuration for physical mobile devices and run the tests on them.
This is the high-level architecture of the Appium tool. In Chapter 6, Test Automation for Mobile, we will look at a test case’s implementation using Appium. In the meantime, you can refer to Appium’s official documentation at https://appium.io/docs/en/about-appium/intro/. Now let us turn our attention to Cypress, which is another effective web automation tool.
Cypress
Cypress is an open source tool written in JavaScript and is primarily used for web automation testing. The main difference between Cypress and Selenium is that Cypress works directly on the browser, whereas Selenium interacts via drivers. Cypress also has the capability to run tests across multiple browsers. It can detect the browsers installed on a particular machine and display them as an option for test execution. Cypress comes in-built with the ability to access both frontend and backend parts of the application. This makes it a great E2E testing tool and is deemed a next-generation test automation tool for the modern web. Cypress is especially easy to set up and quickly functional in JavaScript-based environments. Now, let us look at the chief components of the Cypress tool.
Components of Cypress
Since Cypress is a Node.js application, it has a remarkably simple yet powerful architecture. Cypress sits directly on the browser itself and executes the commands taking full control of the browser automation. The components involved are few, but they are amazingly effective:
- Cypress Node.js server: This is the server on which Cypress runs and communicates with the test runner. This server constantly synchronizes the tasks between the test runner and itself, thereby enabling real-time responses to the application events.
- Cypress test runner: Cypress comes with an interactive test runner that shows the execution of commands as they run against the application.
Now, let us dig deeper into the architecture and inner workings of the Cypress tool.
High-level architecture
As mentioned in the previous sections, Cypress comprises a Node.js server that sits directly on the browser to execute the test commands. The Node.js server and Cypress constantly interact to keep total control of the frontend and backend aspects of the application under test. Cypress not only accesses the DOM and other browser objects but also monitors the networking layer. This helps it dictate actions both within and outside the browser. Figure 3.21 provides a diagrammatic representation of this architecture:

Figure 3.21 – Cypress architecture/components
Since the browser directly runs the Cypress tests, the test’s behavior can be modified dynamically by accessing the network traffic. For further reading on Cypress, you can refer to the documentation at https://docs.cypress.io. We will implement a test script using the Cypress tool in Chapter 5, Test Automation for the Web.
Cypress can be effectively used to set up E2E test scenarios for our hypothetical banking application. We could follow a similar approach as that of Selenium for setting up page objects to verify interaction with the frontend aspects of the application. Additionally, we could intercept the backend API calls and add validations to them. In this case, we would have test scripts covering multiple E2E flows, verifying both UI elements and the API responses involved in that flow.
Next, let us look at a performance testing tool.
JMeter
JMeter is an open source performance testing tool that simulates user requests to a server and then computes and stores the response statistics from the server. It comes with an intuitive user interface that assists in designing various parameters of the tests. It is a versatile tool that can be configured to run in a multithreaded fashion on Linux and Windows machines. It also supports a wide variety of protocols, such as REST, HTTPS, SOAP, Mail/SMTP, and JDBC. Let us look at the different components of the JMeter tool.
Components of JMeter
JMeter primarily comprises master/slave nodes and the user interface:
- JMeter master: This is a core component that configures the workers and integrates all the test results
- JMeter slave nodes: Distributes virtual machines used to run the tests
- User interface: This is a lightweight interface built using the Java swing component that can be used for test maintenance and configuration
Now that we are aware of the components within JMeter, let us look at its high-level architecture.
High-level architecture
JMeter uses the master-slave architecture where the tests can be scaled dynamically by increasing the number of slave nodes, thereby simulating real-time web traffic. The master node acts as an orchestrator where the tests are triggered and helps to spread the load across multiple nodes. Tests can be invoked via the CLI or the UI. Figure 3.22 illustrates the inner workings of the JMeter architecture:

Figure 3.22 – JMeter architecture/components
By sampling many threads simultaneously, JMeter effectively helps determine the performance of web applications. The official documentation for JMeter can be found at https://jmeter.apache.org/usermanual/index.html. We will look at a detailed implementation of a performance test in Chapter 8, Test Automation for Performance.
In the case of our banking application, we would initially look at setting up performance tests for each of the APIs. Every API should conform to an SLA in terms of the maximum number of concurrent users and response times. JMeter can be used to set up and verify that. Then, we move on to performance test the response times on the UI screens. We normally start with a minimal number of concurrent users and gradually throttle that number to observe the response times of the web pages. We could also stress test both the APIs and the UI pages by increasing the concurrent users to a point where it breaks the application.
Next, let us look at an accessibility testing tool, AXE.
AXE
Axe is a lightweight browser-based accessibility testing tool that is available as an extension. It checks a web page against pre-defined accessibility rules and generates a report of compliances/violations. It also provides options to check parts of a page and generate insights based on the generated report. There are additional libraries available to check compliance against audits and continuously monitor the accessibility status of the web page. You can further explore the capabilities of this tool by referring to https://www.deque.com/axe/core-documentation/api-documentation/.
For testing our hypothetical banking application, we would be adding the AXE tool plugin to our browser to get real-time feedback on the level of accessibility support. We could also explore implementing their linters within the application code bases to automatically review every merge.
We have looked at a sample of test automation tools and their high-level architecture so far in this chapter. Table 3.1 summarizes their primary usage and support:
|
Tool |
Popularly used for |
Applications tested |
Supported platforms |
Supported programming languages |
|
Selenium |
Web browser automation |
Web, mobile (with external integrations) |
Windows/macOS/Linux |
JavaScript, Java, Python, C#, PHP, Ruby, Perl |
|
Appium |
Native and hybrid mobile application automation |
Mobile |
iOS, Android, macOS, Windows |
JavaScript, Java, Python, C#, PHP, Ruby |
|
Cypress |
E2E testing for web applications |
Web |
Windows/macOS/Linux |
JavaScript |
|
JMeter |
Performance testing of web applications |
Web |
Windows/macOS/Linux |
Java, Groovy script |
|
AXE |
Accessibility testing and associated compliance |
Web, mobile |
Windows, macOS, iOS, Android |
JavaScript, Java, Python, C#, PHP, Ruby |
A common question that lingers in the minds of testing teams is how to pick the right tool for the task at hand. In the next section, we will look at some standard considerations in picking the right tool for the various kinds of testing.
Choosing the right tool/framework
In the previous chapter, Test Automation Strategy, we pondered over the selection and training needed to implement a test automation tool. In this section, we will reiterate some of those points, and additionally, we will break down the tool selection criteria by the types of testing. Every testing endeavor is unique and demands its own set of tools and techniques. The team composition and the overall maturity of the engineering organization also play a vital role in delivering the ROI on test automation tools. Let us now look at some tool selection guidelines for distinct types of testing.
Selecting a performance testing tool
Performance testing, as an activity, focuses on identifying and documenting the benchmarks for non-functional attributes of a software application. Even though the primary basis for a performance tool selection is cost, skills and the testing approach are also critical. Since every performance testing effort requires concurrent user load generation, there is a license involved on top of the open source aspect of the tool. Let us now review the various performance tool requirements:
- The ability to scale and coordinate concurrent users
- The ability to monitor and record performance metrics
- The ability to provide a user-friendly way to view the performance test results
- Licensing costs and restrictions
- The ability to generate user load across different stacks of the application
- The capability to record user actions and customize them into a generic performance test script
- A sufficient capacity to dynamically adjust the user load introduced into the testing infrastructure
- Support for different networks protocols such as HTTPS, SOAP, SSH, and SFTP
- Tool stability at relatively high user loads, especially when trying to execute stress tests to determine the breaking point of the application
- The presence of support from the tool vendor and the community at large
- The existence of resources skilled in the tool to undertake the performance testing effort from scratch and get it to a closure
Next, let us look at similar tool selection criteria for API testing.
Selecting an API testing tool
Modern cloud platforms with distributed architecture comprising shared APIs are a common occurrence in every organization. There is a stronger push than ever to move all the business logic into the API layer, keeping the frontend light and elegant. This makes API testing crucial to deliver business value. There is a constant need to validate the accuracy of the API logic and fix any bugs as quickly as possible. With these factors in mind, let us go through certain criteria for API tool selection:
- The ability to set up and execute API calls quickly and easily
- The capability to create test suites and automatically run them
- Options to mock an API call
- The ability to create a chain of API calls to simulate a business workflow
- Options to customize the test suite by adding additional scripting wherever needed
- Support for non-functional testing
- Support for various technologies such as REST, SOAP, messaging systems (Kafka), and databases
- The presence of thorough documentation
- Capabilities in free versus licensed versions
Even though extensive API testing provides sizeable test coverage, there are parts of the application that cannot be tested using APIs. This is where a good web testing tool comes in handy. Let us review the items to look for in a solid web testing tool.
Selecting a web testing tool
A good web testing tool provides more diverse test coverage than just validating the API logic. It confers the ability to set up tests addressing the complete system behavior. Some of the most important features of a good web testing tool are as follows:
- Support for specific platforms and technologies used by the application being tested
- Stability when setting up long-running end-to-end tests
- Support for capture and playback tests for getting tests up and running in a brief time
- The ability to monitor and inspect backend parts of the application while running frontend tests
- Support for constant improvements and documentation
Thus, a good web testing tool must be well rounded in its coverage to address end-to-end aspects of the application. Next, let us look at the factors that influence a mobile testing tool selection.
Mobile
A major chunk of the factors that we have looked at so far apply to mobile testing tools as well. Here, in this section, let us list the specific criteria that apply to mobile testing:
- Support for cross-device and cross-platform test setup and execution
- Support for custom scripting to extend the existing framework
- Integrates seamlessly with cloud-based mobile device emulators/simulators
- The ability to debug and pinpoint errors on various mobile platforms
In the next section, let us examine the common factors that play a key role in a user settling on a particular tool.
Common considerations
Every kind of testing demands its own set of standards in a test automation tool. But there are certain common details that must be analyzed upfront in this process. Let us examine them in this section.
CI/CD integration
Irrespective of the tool or the type of testing being performed, integration with a CI/CD tool is an absolute must in the current software engineering landscape. The tool’s ability to integrate with the current development infrastructure with ease is critical. Sometimes, the introduction of a new tool in the testing ecosystem demands software engineers to change the way they deliver software. The tool should offer plugins or other installable tools to blend with the CI/CD pipeline, thus paving the way for engineers to focus on writing the tests, with the tool taking care of the integration automatically. In fact, a testing tool should be an enabler of strong CI/CD processes if the team does not already have one.
Next, let us review some budget considerations while selecting a test automation tool.
Knowing your budget
Usually, one of the chief aspects of deciding on a test automation is its cost. Deciding between open source and building one from scratch is usually the first step. This depends immensely on the available time and resources at disposal. There should also be an upfront analysis done on the diverse options available in the licensed version to evaluate the fit. It is useful to analyze the risks involved in not adopting a tool and build on the benefits the tool will eventually offer. It is also important to assess how the licensing cost will change over time as the engineering organization evolves. It is vital to note that the introduction of a test automation tool would increase the costs initially, but eventually should reduce the quality and deployment costs when rightly integrated and used with the DevOps processes.
Let us next look at how having the resources with the right skills accelerates tool adoption.
Knowing the team’s skillset
Even a well-rounded testing tool that is not utilized to its full potential will not deliver the promised ROI. Having the skilled resources to use the testing tool makes an enormous difference in the test automation effort. It is crucial to get the team’s feedback about the tool selection process to make sure the tool addresses all the pain points faced by the team. Team members should be comfortable with the scripting language supported by the tool, and proper training must be provided to address the knowledge gaps. It also helps to select a language that is already being used by the software engineers on the team. This gives the team access to more coding experts. Quality engineers should be involved in the code review process, which would assist them in learning the intricacies and best practices of the programming language used. It would be wise to produce a tool onboarding plan and get it reviewed by all the users.
Summary
In this chapter, we looked at and understood some of the chief tools used for quality engineering on a daily basis. We started with the CLI and looked at some of the commonly used commands. Then, we explored what Git is and familiarized ourselves with basic Git commands to initialize and make changes to a code repository. We continued to review common test automation frameworks and their high-level architecture. We gained a solid understanding of the purpose of each of these tools/frameworks. In the concluding section, we reviewed the tool selection criteria for various kinds of testing and some common factors that influence testing tool selection.
Based on the contents of what we have seen in this chapter, you should be able to comfortably work on the CLI and should also feel ready to contribute via Git. You also gained a thorough understanding of the commonly used test automation frameworks and the analysis that goes before adopting one. In the next chapter, we will dive a little deeper into Git commands. We will also learn how to set up an IDE and familiarize ourselves with JavaScript.
Questions
- What is the CLI and why is it important?
- What is Git and how is it used?
- What is Selenium and what are its components?
- What is Appium mainly used for?
- How is Cypress different from Selenium?
- What is JMeter primarily used for?
- How is AXE used in accessibility testing?
- What are some common considerations when choosing a test automation tool?