Appendix 2
The Process of Research
“If a man will begin with certainties, he will end in doubts; but if he will be content to begin with doubts, he will end in certainties.”
—Francis Bacon
INTRODUCTION
A report involves three things: (1) research (investigation), (2) analysis, and (3) presentation. The reader’s interest in the report is primarily in its well-documented presentation of facts and conclusions, but a report can never meet the expectations or needs of the reader unless the writer labours through careful research and provides a critical analysis of the data collected. Therefore, to write reports (for decision makers in business), you should first understand some research methods and hone your analytical skills.
STEPS IN SCIENTIFIC RESEaRCh
In simple words, research is a search for facts—answers to questions and solutions to problems. Business research can be defined as a systematic inquiry that offers information to guide business decisions. There are two ways of searching for facts:
- Arbitrary, based on personal judgment and hunches
- Scientific
The scientific approach to research is a logical and systematic study of a problem, issue, or phenomenon in a step-by-step manner, following a logical process of reasoning. Research conducted in a scientific manner involves the following process of investigation:
- Defining the problem
- Formulating a hypothesis (or hypotheses)
- Selecting/proposing a method
- Collecting, organizing, and analysing data
- Making deductions and arriving at conclusions
Defining the Problem
The problem or the subject of investigation should be outlined well so that the solution is correct. We should narrow down the problem to specifics—what exactly needs to be done. By delimiting the problem from general to particular and to more specific problems, you can recognize the real problem that needs to be answered. The well-known set of ‘what, why, who, where, and when’ questions will help break down the general problem into specific ones. To know why something is wanted, we should first know what is wanted. So, we should first identify these two questions: the ‘why’ and the ‘what’. Once these two basic questions are isolated, the process of solution-finding has begun. At this point, you have to assume a tentative solution to the problem. The hypothetical solution will be subsequently tested for its validity and correctness.
Let us see an example of how we can narrow down a problem from the general to the specific. Suppose we want to study the wages of women. It is a vast subject. Millions of women workers all over the country fall within the scope of this problem. It is not possible to study such a broad problem, so we should limit its scope by asking the questions—what, why, where, when, and who. Assume that you are at Tata Steel and are required to submit a report on this problem. To study the wages of women workers at Tata Steel, Jamshedpur, this is how you can approach your investigation:
Research is a search for facts—answers to questions and solutions to problems.
- What [to study]: The wages of women workers
- Why: To determine whether their wages are fair and uniform
- When: Current time
- Where: Tata Steel, Jamshedpur
- Who: Women workers
You have now limited the proposed problem of your study to the current wages of women employed at Tata Steel, Jamshedpur. The delineation of the problem became possible by asking ‘why’—the purpose of the study. And once the purpose is well defined, the problem will accordingly become specific and exact.
Still, the subject/problem needs to be further clarified. The terms fair and uniform are vague. Women may be doing different work at different sites at Tata Steel. Jobs at Tata Steel may be different from jobs in Jamshedpur as a whole. So, when we talk of wages being ‘fair’ and ‘uniform’, do we mean the wages of women workers within various sites of Tata Steel or compared to the wages of women workers elsewhere? Or are we comparing the wages of women employees to those of men?
A hypothetical solution will be tested for its validity and correctness.
Defining Terms
The process of clarifying our concepts and terms is known as conceptualization. We conceptualize by defining our terms and stating them in specific terms with regard to the specific context of use. For instance, the term wages is vague unless we specify it by considering ‘hourly’, ‘daily’, ‘weekly’; if daily, then how many hours make a day; if weekly, then, how many days make a week (is Sunday included?); or if monthly, then, is a month the calendar month? Such questions help us to be exact about the concepts involved in our research.
Statement of the Problem
After clarifying all these questions, we can now state our problem thus—’This study proposes to survey the wages of women workers at Tata Steel, Jamshedpur, to determine whether the company wages are fair and uniform.’ The problem phrased in this way is limited in its scope.
Formulating Hypotheses
A hypothesis is a tentative statement about the possible cause and solution for a phenomenon. It is a tentative answer to the present question. It is tentative because it is assumed to be true but its validity is to be tested. A hypothesis is based on supposition and is to be proved or disproved as a result of research. For example, we may be interested in studying the percentage of savings in families with changes in family income. We may assume that the percentage of savings will increase if the income of families increases. It is just our supposition, not a proven fact. We can start with the hypothesis: ‘An increase in the income of the family leads to a rise in the percentage of income saved.’ This hypothesis is positive. Its validity is to be proved by testing it in our research.
Many researchers think that a positive hypothesis is framed by expecting a favourable ‘yes’ result from the study. Therefore, they prefer to use a neutral hypothesis, called a null hypothesis, which is required to be disproved to prove what is valid. The null hypothesis is stated in terms that show no prejudice to the results of the research. We can state the problem of family income discussed earlier in the following null hypothesis: ‘There will be no increase in the percentage of income saved if the family income increases.’ In business research, we prefer to use the null hypothesis as it indicates an objective and unbiased attitude towards the result.
The null hypothesis is stated in terms that show no prejudice to the results of the research.
Selecting a Suitable Method of Data Collection
The next step after defining the problem and postulating a hypothesis is to select a proper method of collecting the required information from the following commonly used methods of research:
- Library research
- Normative survey research
- Observational research
- Experimental research
The main concerns of business research in the social sciences and management research are about finding solutions to problems such as unemployment, poverty, social unrest, human relations, and problems in organizations. Research attempts to establish factual data on the prevailing plans and schedules for development on a realistic basis. Research studies bring out necessary facts for making sound decisions before committing resources.
Research studies seek to help planners evaluate alternative strategies and select the most suited strategy for developing different sectors, such as education, agriculture, industry, health, and social welfare. Evaluations of ongoing projects and schemes such as lead bank schemes and integrated rural development programmes are undertaken to indicate whether the plans need any modifications or new implementation strategies. Keeping in mind the basic purpose of the study, the researcher usually selects one or two of the four research methods mentioned here.
Library Research
In every research study, we need to know what others have already done. For collecting this information and knowing other views related to our investigation, we should consult the existing literature. This kind of collection of information is known as library research and is a part of all other methods of research. It constitutes a study of the background and involves a survey of the existing body of knowledge in the field of the proposed study.
Library research helps in the following ways:
- It helps avoid unnecessary repetition and duplication of effort and waste of valuable research time and funds.
- It helps establish points of departure for new research work.
- It helps set out directions and areas for conducting research in the field proposed for study.
Library research is done for solving problems in business, and it relates to the study of an organization’s records, annual reports, periodicals, account books, or any other documents recording business policies, decisions, and previous studies of the same or similar problems.
Library research is done for solving problems in business, and it relates to the study of an organization’s records, annual reports, periodicals, account books, or any other documents recording business policies, decisions, and previous studies of the same or similar problems..
Because library research provides us with material already contributed by others, it is known as a secondary source, and the information collected is called secondary data. Primary data is what we gather through our own observations, surveys, and experiments.
In using library research for collecting data, you should be careful not to create a heap of information. Collect only relevant material. Also avoid piling up the entire data in one place. It will be better to note and record information on separate sheets/cards under different headings with exact details of their source—for instance, keeping separate files for books, journals, news bulletins, company-specific information, and so on. This will help you use the collected material properly at the appropriate places in your report. This will also help in preparing your bibliography.
Normative Survey Research
In business research, normative survey research is frequently used to know the prevailing status of the situation being studied. It uses survey tools—questionnaires, interviews, checklists, and ‘opinionnaires’—to obtain information that may add to information already collected through secondary sources or validate the findings of the library research.
The surveys are called ‘normative’ because they lay down ‘norms’ or ‘standards’ or ‘what is’, or determine the present status of a situation or establish customary behaviour. The normative survey method is descriptive in nature. The limitation of this research method is that findings through such surveys are to be considered valid only for the present and not for the future, because the state of mind, attitude, or situation of the subject of study may change.
Normative surveys are called so because they lay down ‘norms’ or ‘standards’ or ‘what is’, or determine the present status of a situation, or establish customary behaviour.
For example, suppose we want to conduct a study of the attitude of employees towards voluntary retirement scheme (VRS) in a company. The only way to do this is to conduct a survey (through personal interviews or questionnaires) of those employees who, at the time of study, fall within the age group indicated for VRS eligibility. The findings based on the responses given by this group of employees will be valid about the present employees only. The management of the company will not be deciding wisely if these findings are held valid and applied to employees after, say, five years, during which the company’s economic situation or employees’ attitude towards work may have changed drastically.
Reliability and Validity of Survey Results Surveys may be done through personal interviews or questionnaires. The findings are considered reliable when they are found to be close to what is generally accepted as true. And they are held valid if they measure what they are supposed to measure.
Reliability also results from consistency in findings. A simple example of a situation in which a result may be valid but not reliable is measuring a person’s temperature with a thermometer. We may get a reading indicating fever, which is valid because the instrument measures what it should measure: a thermometer is meant to record human temperature. But suppose we doubt the accuracy of the reading and again, at that very moment, record the temperature with some other thermometer. We may get either the same reading or a different reading. If the reading is different, we will be confused. We do not know which reading is true. In order to determine which thermometer is reliable, we should again take the temperature with the first thermometer, first for one minute, then again for 2 minutes, and finally for, say, 3–5 minutes. If the readings are not close, then the thermometer is not reliable in its calibration. If it lacks consistency, which is the basic principle of the calibration of thermometers, the particular thermometer is unreliable.
Similarly, the principle of validity assumes that the results are true of not a specific group interviewed or questioned but of the total (in the VRS case all the employees supposed to be covered by the study). In order to get results that are both reliable and valid, we have to select a fairly representative sample or group (to continue with our VRS example) of the company’s employees. Population is the total number of individuals (items) to be surveyed (interviewed or questioned through questionnaires). The whole population may be in the thousands (something unmanageable), so we select a smaller number of employees that represents the whole population (all the employees in VRS age). This process is called sampling.
The principle of validity assumes that the results are true of not a specific group interviewed or questioned but of the total population.
In order to make the sampling reliable and valid, we follow the techniques discussed here:
- Random sampling: We need to sample to ensure that each individual member of the concerned population is studied by us. To make this possible, we use random sampling in which there is a ‘no-zero’ chance for every individual to be included in the sample. This, of course, is a very difficult task. In order to achieve it, we should take a fairly large number at random from a population so that persons representing varying characteristics are included in the sample proportionately. Thus, the sampling group and the total population should possess the same characteristics in the same proportions. To illustrate this point, let us continue with the VRS example. Our sampling is valid if our sampling group has the same percentage of different age groups, different salary groups, different years of service, and different ranks that the total population of employees has.
As the term random suggests, we do not choose, but allow an equal chance to all the members in a population to be chosen. One of the ways to do this is to first determine the size of the sample we want. Write down each name (in the population) on a piece of paper and mix them under a cover. Now, draw the number of slips you want for your sample group. The names thus drawn from the whole lot will be representative of the total population.
- Stratified random sampling: It is possible that the sample formed by following the steps just mentioned does not reflect the same percentage of various characteristics in the population. Therefore, we do what is called stratified random sampling. That is, we go on drawing the lots until we get, from each category, the sample group in the same percentage as exists in the total population.
- Systematic random sampling: Random sampling becomes systematic random sampling if we apply a system of picking out names in a definite sequence. For example, if we wish to take a sample of 250 from a population of 10,000, then 10,000 divided by 250 would be 40. Now, we can choose a number between 1 and 40, say, 4. Starting with 4, we need to select every 40th item. Thus, the series selected will be 4, 44, 84, and so on. This method ensures a no-zero chance for every individual in the population to get picked up for the sample. Such sampling techniques are useful to survey the preferences, habits, and attitudes of buyers for determining market trends or consumer behaviour.
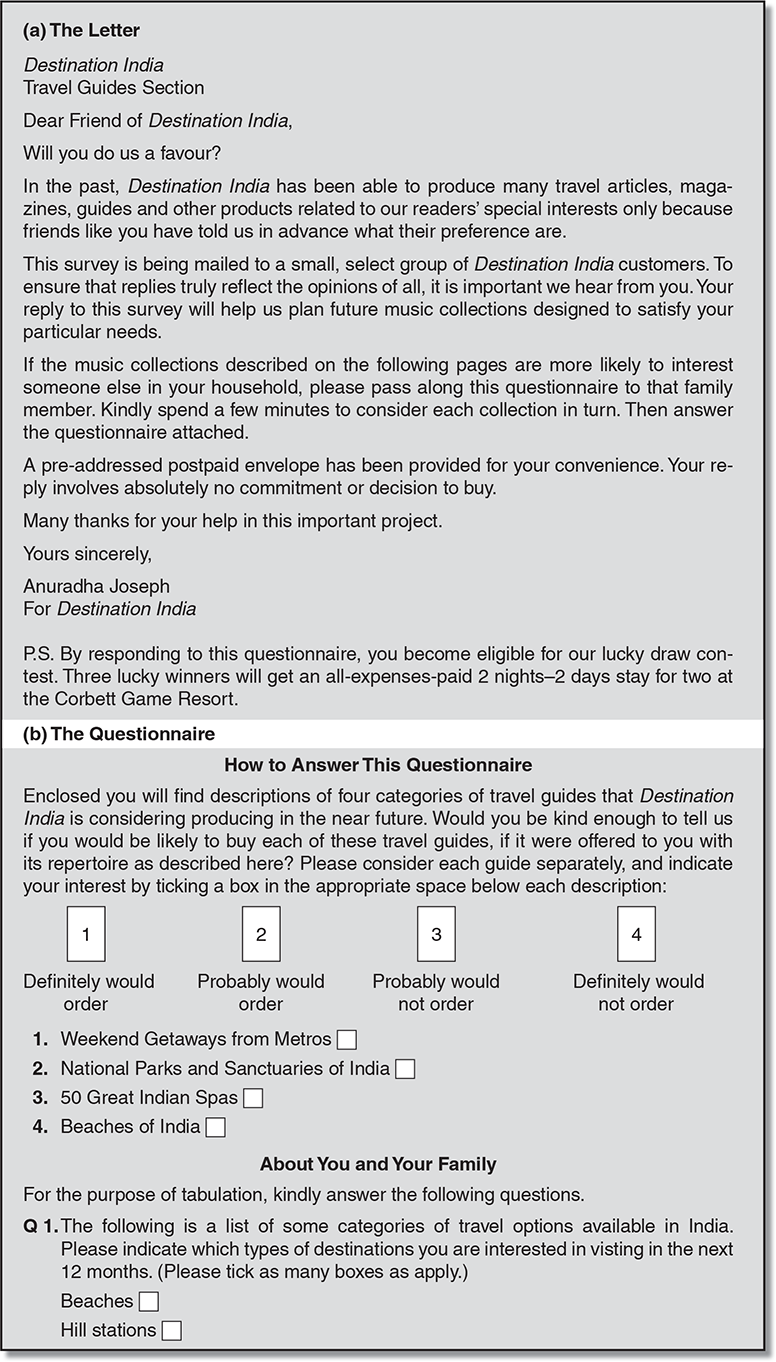
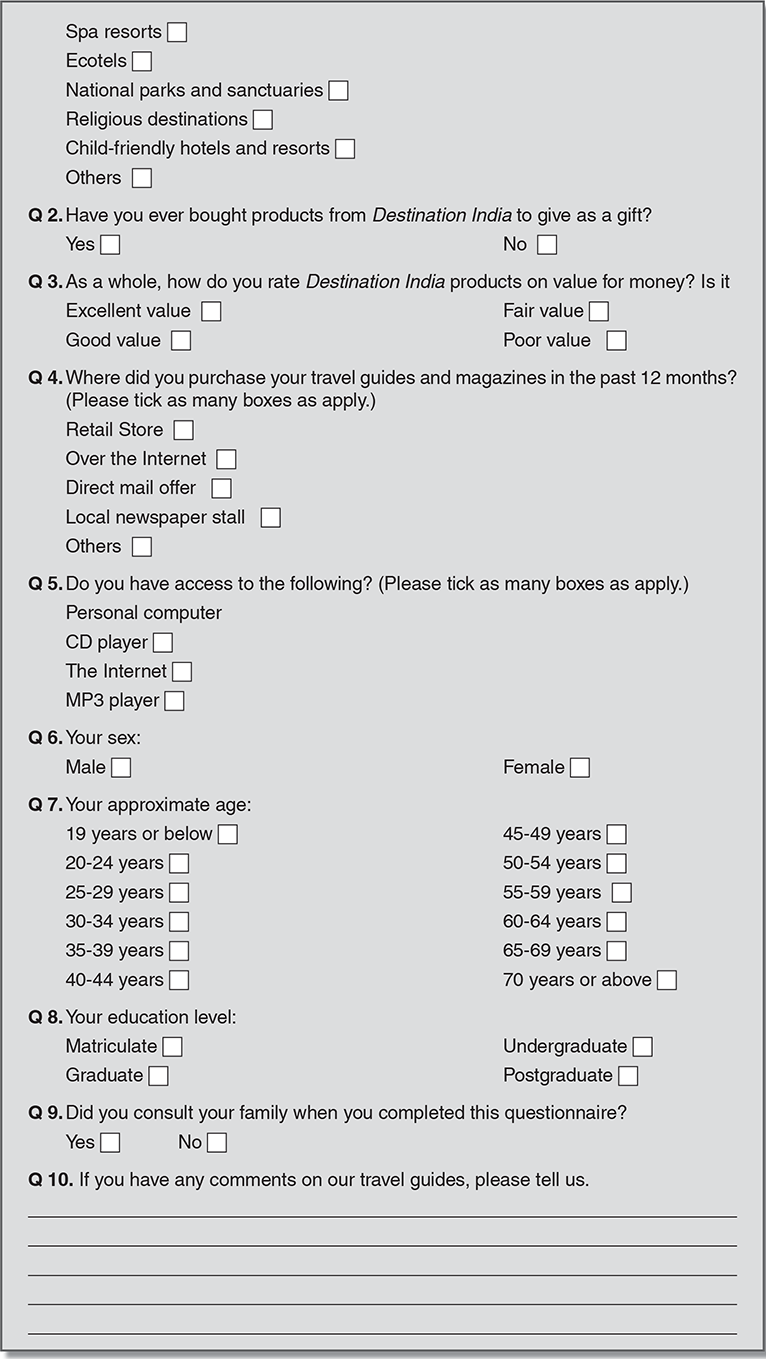
Instruments of Survey A survey is usually done with the instruments of a written questionnaire or a personal interview. A questionnaire is a set of questions that are written in order to collect maximum factual information from the respondents about their habits, attitudes, views, ratings, liking, and so on of the object under study. An example is given in Exhibit A2.1.
The questions may be grouped and sequenced according to the nature of the data. For example, if personal data is important for the analysis of the information gathered, then questions on age, gender, family size, number of earning members, and number of dependents may be grouped together for easy analysis. The name is usually left out. A questionnaire is generally treated as anonymous.
Questions should be worded in simple, clear, and exact language. Enough space should be left between the questions if we ask open-ended questions such as ‘What effect will the attrition policy/VRS scheme have on the economy of the steel plant?’ The questions can be objective-type questions, in which case the respondent has just to write ‘yes’ or ‘no’ or mark the circles/squares against the options as directed. For example, a question can be put in the following form:

Here are some guidelines for creating an effective questionnaire:
- Ask objective and factual information. Opinions, likes, and so on cannot be avoided, but they should be inferred from the objective information.
For example, instead of asking whether a person likes to buy a particular brand of soap, you can learn about his/her preference by asking how many times he/she has bought that soap. One rule to follow: Do not base your conclusions on opinions, because they may change from time to time. Rely on facts, not opinions.
- Do not ask questions that would embarrass or bother the respondent. Examples are, ‘When did you last spend more than a few hours with your parents?’ and ‘Have you stopped whistle-blowing or inside trading?’
- Do not ask contradictory questions.
- Avoid loaded questions that suggest built-in answers. An examples is ‘Would you like your wages to be increased?’ Obviously, the answer cannot be ‘no’.
- Keep the number of questions to a reasonable limit. Normally, 10–15 questions should be set. Long questionnaires are usually ignored as they take too much of the respondent’s time.
- Assure the respondent that the information given by him/her will be treated confidentially if you are asking questions on secretive matters.
- Sequence the questions from simple to difficult. Place easy-to-answer questions before the difficult ones.
- Write a brief letter to be sent with the questionnaire. The respondent should know why he/she is selected to answer the questionnaire. Also, he/she should be persuaded to answer each question freely. Instructions for answering the questions may also be given in the covering letter. Otherwise, the instructions may be briefly written on the top of the questionnaire.
- If the questionnaire is mailed, it should be accompanied by a self-addressed, stamped envelope. This will communicate your serious desire to receive the filled-up questionnaire.
- Promise the respondents that the findings of the survey will be shared with them.
- Mention the probable date by which you have to submit your study report or indicate the date by which the questionnaire may by returned. Remember that it usually takes time to respond and often the questionnaire remains unanswered. Hence, choose your respondents carefully and wisely.
Observation Research
In the observational method of collecting information, the receiver observes (inspects/ monitors) the activities of a subject or a group of persons, a phenomenon, or the nature of an entity without communicating with anyone. It differs from the survey method, which involves an interrogation and response process and is a method based on communication. Observational study uses the process of monitoring. The researcher notes and records the results obtained from his/her observations of each case. This is why observational research is also called statistical research—it involves statistical analysis of one or more sets of data.
Suppose we want to know if there is any correlation between time and traffic jams at a traffic intersection on a particular road, we will monitor the flow of traffic, record the count of traffic flow in different directions at different hours of the day, and determine the statistical correlations between the two sets of data: the count of traffic flow and the time of day.
Usually, in business, we use both observational and survey methods to solve problems. For example, a market researcher may first use the survey method to understand the buying behaviour of certain income groups. Then he would employ statistical analysis to observe/determine the correlation between buying habits and income levels. A combination of the two methods helps us identify the right markets for products.
Experimental Research
Experimental research is a systematic and scientific approach to research in which the researcher manipulates one or more variables and controls and measures any change in other variables. We are familiar with experimental research from our school days. Rmember how we took two test tubes and filled them with exactly the same liquid? We then added a new material to only one of them. The content in the other tube was kept as it was (original). After adding the new material to one tube, we noticed changes in that tube. It was obvious to us that any change that had taken place was due to the new ingredient. We noted our observations. The experiment explained the phenomenon of cause and effect.
A laboratory experiment is done under controlled conditions. The two samples are identical. The addition of a variable to one of the two samples causes certain changes in that sample. We conclude that the change is due to the variable. Thus, we can determine the causal relation between a variable and the change in the state of something. Accordingly, if we wish to bring about a particular change in the state of something, we can take help of the related variable.
Although experimental research is used to determine the effect of variables in social sciences and management, there are limitations to its applicability to social sciences. Unlike in the physical sciences, the study of social behaviour and human nature cannot be controlled. Motivation, efficiency, or tastes and choices cannot be subjected to controlled observation of the effect induced by a variable in two otherwise identical groups of people. Although we keep repeating the phrase ‘other things remaining the same’ as an essential condition for conducting experimental research in social sciences, it is largely an assumption and may not be, in fact, true.
In social sciences and management, experimental research is used to determine the effect of variables.
Experimental research is, however, commonly used in natural sciences like agriculture to determine the effectiveness of fertilizers or pesticides on crops. The study takes two plots of identical size, soil, fertility, quality of seeds, and irrigation facilities and adds a different quality of fertilizer to one of them or leaves it without manure. The yields of both plots of land are then recorded. The difference between the yields of two plots is due to the use of fertilizer.